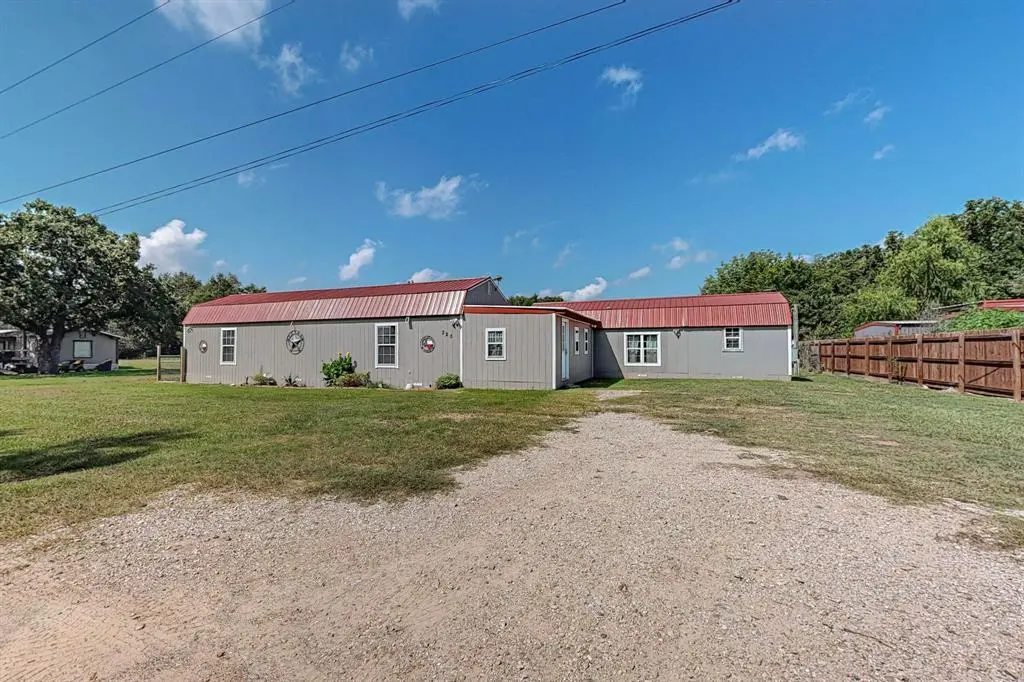
325 Teakwood Ave · Eureka, TX
Flood risk 1/10 · Minimal
- FEMA flood zone
- X
- Chance of flooding over 30 yrs
- 0.0%
- Est. flood insurance / yr
- $507 – $1,088
Fire risk 4/10 · Minor
- Est. fire insurance / yr
- $1,222 – $2,270
Heat risk 7/10 · Major
- Hot days now (above 110°F)
- 7 days/yr
- Hot days in 30 yrs
- 27 days/yr
Wind risk 6/10 · Moderate
- Chance of severe wind over 30 yrs
- 68.0%
Air-quality risk 2/10 · Minimal
- Unhealthy air days now
- 1 days/yr
- Unhealthy air days in 30 yrs
- 1 days/yr
Risk factors via First Street. Map © Google.
Why this score? — see what drove the D+ grade
The composite is a weighted blend of 9 inputs, each scored 0–100. Each bar is that input's sub-score; the figure is the points it added to the 100-point composite (weight × sub-score).
- Cash flow +14.6/30.0
- ARV discount +7.5/15.0
- Appreciation +6.0/10.0
- DSCR +4.5/10.0
- 1% rule +4.2/10.0
- Schools +3.2/10.0
- Livability +2.9/5.0
- Rent growth +2.5/5.0
- Condition / age +2.5/5.0
$159,990
🖨 Deal sheet (PDF) 📄 Offer letter ✓ Due diligence
Listing remarks MLS
Welcome home to this stunning 3-bedroom, 2-bathroom residence nestled in a quaint lake community on the south side of Richland Chambers Lake. Set on a generous third-acre lot, this property boasts a massive 15x15 master bedroom along with two additional spacious bedrooms. Located just 8 houses away from the lake, the community also offers a boat ramp and a refreshing pool for your enjoyment. 3D TOUR AVAILABLE!
Key facts
- Refreshing pool
- Boat ramp
- 0.34 acre lot
Tags
Neighborhood map
What this means for you Summary
Snapshot
- This is a 3-bed/2.0-bath single-family listed at $160k.
Deal economics
- At list price, monthly cash flow is $39 ($464/yr) — positive.
- The deal already cash-flows at list — no discount required.
- To meet the 1% rule (rent ≥ 1% of price), the offer needs to be $148k (7.6% below list).
- Recommended offer: $141k (12.0% below list) — sets the bar for market timing.
Location & tenants
- Location reads 58/100 on livability (#1,196 in TX) — a working-class tenant base; expect higher turnover. Strengths: cost of living A+, housing A+; Watch: schools D, crime D-, amenities F.
- Fairfield ISD (town): math 33% / reading 41% proficiency, ranked #475 of 826 in TX (top 58%) — families likely to look elsewhere, expect single-tenant / working-renter base with shorter leases.
- Market conditions: 102 active listings in the ZIP; 2 units permitted in Freestone County in 2024 (0 in 5+ unit buildings).
Forward outlook
- In year one you build about $4k of equity ($1k loan paydown + $3k appreciation (1.9% local appreciation)).
- Freestone County population projected to shrink 4% by 2050 — rents likely to lag national; underwrite the cash flow, not the appreciation.
- At projected returns (1.9% appreciation + 3.0% rent growth), your $45k cash investment doubles in ~8 years — after that, you're playing with house money.
- By year 8, paydown + projected appreciation supports a ~$31k cash-out refi (75% LTV) — recoverable capital for the next deal without selling this one.
Negotiation context
- It's been on market 713 days — a 12% lower offer ($141k) is reasonable based on typical stale-listing flexibility.
- 2 sale attempts since 4y ago; this cycle's ask has dropped $45k (22%) from the opening price — seller is motivated, your offer sets the floor, not the list.
Risks & watch-outs
- Climate carrying-cost: major wind risk, 68% chance of damaging wind over 30y; extreme-heat days projected 7→27/yr by 2055 (HVAC capex compounding) — expect insurance premiums to compound above CPI over the hold.
Questions for the listing agent
- It's been on market 713 days. Have you received any prior offers? Is the seller open to a 12% concession, seller financing, or rate buy-down credit?
- What does the HOA fee cover, when was the last increase, and are there any pending special assessments or reserve-fund shortfalls?
- Why hasn't it sold? Are there any deal-killer items the seller is aware of (foundation, flood, title, zoning, code violations)?
- Is there a deadline driving the sale (1031 exchange, divorce, estate, relocation)? That informs how much negotiation room exists.
- Schools are D-rated, which usually means shorter tenancies and higher turnover. Who's the typical renter profile here, and what's been the actual vacancy rate?
- Crime grade is D in this area — have there been break-ins, vandalism, or insurance claims at this property in the last 3 years? What carrier currently insures it and at what premium?
- The area grade is low — what's the realistic commute time and amenity access for the typical tenant pool here? Any planned neighborhood developments (good or bad) we should know about?
- What's the average days-on-market for RENTAL listings here right now (not sales)? A rising rental-DOM trend means longer vacancies and softer asking-rent achievability than the comps imply.
- What's the recent tenant-quality profile in this submarket — average credit score on applications, eviction rate, late-payment / NSF rate, and stable-employment percentage? A property-management company in the area should have these aggregated.
- How much new for-sale + rental construction is in the pipeline within 1–3 miles? Heavy new supply typically softens prices + rents 12–24 months out; constrained supply supports both.
Investment metrics
- 1% rule
- 0.92% ✗
- Cap rate
- 6.58%
- Cash-on-cash
- 1.04%
- DSCR
- 1.05
- GRM
- 9.0
CMA / ARV
- ARV (median comp)
- $331,129
- List price
- $159,990
- Delta
- -51.68%
- Verdict
- UNDERPRICED
- Comps
- 11 within 1.0 mi
Show comp detail 3 sales within ~0.75 mi
| Address | Dist | Beds/Ba | Sqft | Sold | Price | $/sf | Match |
|---|---|---|---|---|---|---|---|
| 210 September Dr | 0.25mi | 3/2.0 | 1,540 (-1%) | 12mo | $329,000 | $214 | 77 |
| 190 Deerwood Cir | 0.39mi | 3/2.0 | 1,651 (+6%) | 6mo | $329,000 | $199 | 66 |
| 149 Lakeview Dr | 0.32mi | 3/2.5 | 1,728 (+11%) | 10mo | $299,999 | $174 | 56 |
Match score weights: distance 35% · size 25% · config 20% · recency 20%. Top-matched comps best support the ARV.
Projected returns pro-forma
1.91% appreciation · 3.0% rent growth · sell at horizon
- IRR
- 5.3%
- Equity multiple
- 1.28×
- Total profit
- $12,762
- Equity at exit
- $62,352
- IRR
- 8.9%
- Equity multiple
- 2.20×
- Total profit
- $53,781
- Equity at exit
- $89,213
Cash invested: $44,797 (down + closing). Projections, not guarantees.
Landlord ↔ Tenant lean methodology
- Overall (STATE)
- 87 Strongly Landlord-Friendly
- State Texas
- 87 Strongly Landlord-Friendly · R+5
- County
- — inherits STATE
- City
- — inherits STATE
ZIP-level market 75859
- Home prices YoY
- 0.9%
- Active inventory
- 102
- Price-to-rent
- 9.0×
Monthly cashflow live
- Estimated rent
- $1,479 medium interval (Pro) →
- Mortgage (P&I)
- −$839
- Tax from tax record
- −$211 /mo · $2,533/yr
- Insurance
- −$67
- HOA
- −$13
- Vacancy / Maint / Mgmt
- −$311
- Net cashflow
- $39
Break-even live
Sensitivity live
| Price | -10% $129 | -5% $84 | +0% $39 | +5% $-7 | +10% $-52 |
|---|---|---|---|---|---|
| Rent | -10% $-78 | -5% $-20 | +0% $39 | +5% $97 | +10% $156 |
| Rate | -1.0pp $119 | -0.5pp $79 | base $39 | +0.5pp $-3 | +1.0pp $-45 |
UW: 25.0% down · 7.5% · 30yr · 1.5% tax · 5.0% vac · 8.0% maint · 8.0% mgmt
Financing live
Cash to close
- Down payment
- $39,998
- Closing costs
- $4,800
- Reserves months
- —
- Total cash needed
- —
Loan-product check · same deal, 3 products live
Conventional
25% down · 7.5% · 30yr
- Down + closing
- —
- Monthly P&I
- —
- Monthly cashflow
- —
- DSCR
- —
- Eligible?
- —
Personal DTI + credit; lowest rate.
DSCR
20% down · 8.5% · 30yr
- Down + closing
- —
- Monthly P&I
- —
- Monthly cashflow
- —
- DSCR
- —
- Eligible?
- —
No personal income docs; deal must DSCR.
Hard money
10% down · 12.0% · 12mo
- Down + closing
- —
- Monthly P&I
- —
- Monthly cashflow
- —
- DSCR
- —
- Eligible?
- —
Short-term bridge; refi at stabilization.
HOA detail
- Monthly dues
- $13 · $156/yr
- Likely covers
- pool
Listing history 12 events
-
2026-05-31days on market $159,990 Active 713 DOM
-
2026-05-30days on market $159,990 Active 712 DOM
-
2026-02-19price $159,990 413-char remark
Show marketing remark (413 chars)
Welcome home to this stunning 3-bedroom, 2-bathroom residence nestled in a quaint lake community on the south side of Richland Chambers Lake. Set on a generous third-acre lot, this property boasts a massive 15x15 master bedroom along with two additional spacious bedrooms. Located just 8 houses away from the lake, the community also offers a boat ramp and a refreshing pool for your enjoyment. 3D TOUR AVAILABLE!
-
2025-08-25price $174,990 413-char remark
Show marketing remark (413 chars)
Welcome home to this stunning 3-bedroom, 2-bathroom residence nestled in a quaint lake community on the south side of Richland Chambers Lake. Set on a generous third-acre lot, this property boasts a massive 15x15 master bedroom along with two additional spacious bedrooms. Located just 8 houses away from the lake, the community also offers a boat ramp and a refreshing pool for your enjoyment. 3D TOUR AVAILABLE!
-
2024-10-02price $175,000 413-char remark
Show marketing remark (413 chars)
Welcome home to this stunning 3-bedroom, 2-bathroom residence nestled in a quaint lake community on the south side of Richland Chambers Lake. Set on a generous third-acre lot, this property boasts a massive 15x15 master bedroom along with two additional spacious bedrooms. Located just 8 houses away from the lake, the community also offers a boat ramp and a refreshing pool for your enjoyment. 3D TOUR AVAILABLE!
-
2024-07-17price $199,900 413-char remark
Show marketing remark (413 chars)
Welcome home to this stunning 3-bedroom, 2-bathroom residence nestled in a quaint lake community on the south side of Richland Chambers Lake. Set on a generous third-acre lot, this property boasts a massive 15x15 master bedroom along with two additional spacious bedrooms. Located just 8 houses away from the lake, the community also offers a boat ramp and a refreshing pool for your enjoyment. 3D TOUR AVAILABLE!
-
2024-06-17$205,000 Active 413-char remark
Show marketing remark (413 chars)
Welcome home to this stunning 3-bedroom, 2-bathroom residence nestled in a quaint lake community on the south side of Richland Chambers Lake. Set on a generous third-acre lot, this property boasts a massive 15x15 master bedroom along with two additional spacious bedrooms. Located just 8 houses away from the lake, the community also offers a boat ramp and a refreshing pool for your enjoyment. 3D TOUR AVAILABLE!
-
2023-04-10soldstatus
-
2022-09-29historical
-
2022-09-07$105,000 Active
-
2019-04-17soldstatus
-
2011-03-25soldstatus
ⓘ Source: listings_history table (triggers on properties + properties_extension) + one-shot
backfill from property_details.listing_events for pre-trigger history.
Tax reassessment forecast TX · Resets to sale price
- Current annual tax
- $2,533 · $211/mo
- Projected year-2 tax
- $2,928 · $244/mo
- Expected delta
- +$395/yr (+$33/mo · 15.6%)
ⓘ Screening estimate from a state-policy table — verify with the county assessor before closing.
Climate risk First Street
- Flood 1/10 Low FEMA zone X · 0% chance over 30 yrs
- Wildfire 4/10 Moderate
- Heat 7/10 Severe 7 d/yr ≥110°F today · 27 d/yr by 30 yrs out
- Wind 6/10 Major 68% chance of damaging wind over 30 yrs
- Air quality 2/10 Low 1 unhealthy d/yr today · 1 by 30 yrs out
Nearby sold comps map
Loading sold comps map…
Walkable amenities ~0.75 mi
Loading nearby amenities…
Taxation est. · year 1
- Rental income
- $17,748
- − Mortgage interest
- −$8,962
- − Property taxes
- −$2,533
- − Insurance
- −$800
- − Repairs & maintenance
- −$1,420
- − Management
- −$1,420
- − HOA
- −$156
- − Depreciation
- −$4,654
- Taxable loss
- −$2,197
- Est. tax savings @ 24.0%
- +$527
- After-tax cash flow
- $991/yr
For passive investors: Depreciation is non-cash, so a rental often shows a tax loss while cash-flowing — sheltering income. Rental losses are passive: they offset passive income freely, and up to $25,000/yr can offset ordinary (W-2) income if you actively participate and your MAGI is under $100k (phasing out to $0 by $150k); unused losses carry forward. On sale, claimed depreciation is recaptured at up to 25%, and gains may owe capital-gains tax (a 1031 exchange can defer both). Figures are a year-1 estimate at your 24.0% rate — not tax advice; consult a CPA.
Schools (NCES district)
- District
- Fairfield ISD
- NCES district ID
- 4818940
- Math proficiency
- 33% ▼ -9.00%
- Reading proficiency
- 41% ▼ -9.00%
- Median HH income
- $46,909
- Composite
- 31.68/100
- National rank
- #5926
- State rank
- #475 of 826 in TX
Livability — Eureka
- Score
- 58/100
- State rank
- #1196
- US rank
- #20931
Category grades
Schools grade is shown separately in the Schools card above.
Census & demographics
- Population (ZIP)
- 2,468
Population outlook (Freestone County) Hauer SSP2
- Today (2025)
- 19,591 people
- By 2030
- 19,470 · -0.6%
- By 2040
- 19,111 · -2.5%
- By 2050
- 18,700 · -4.5%
- By 2075
- 17,586 · -10.2%
- By 2100
- 14,933 · -23.8%
Race, ethnicity, and origin ACS 2023
- Neighborhood character
- Predominantly White (78%)
- Race & ethnicity
- White 78% Hispanic / Latino 10% Two or more races 7% Black 6%
- Hispanic origin (detail)
- Mexican 10%
- Common ancestry
- Slovak 2% Romanian 1% Scandinavian 1%
- Foreign-born
- 2% · Canada
- Languages at home
- 91% English-only · Spanish 8% Other Indo-European 1%
Political lean MEDSL · Freestone
- 2024 margin
- Solid R (+66.3) · D 16.6% · R 82.9%
- 2008→2024 swing
- -22.8pp toward R · 2008: -43.5pp · 2024: -66.3pp
- All cycles
- 2024: R+66.3 2020: R+61.5 2016: R+59.6 2012: R+50.2 2008: R+43.5
Not yet ingested
- Civics
- —
Market trends
- HPI YoY
- ▲ 1.91%
- Current HPI
- 204.2727
- Rent YoY
- —
- Metro
- —
- State GDP YoY
- ▲ 3.95%
- F500 in state
- 110
Industry mix (Fortune 500 HQ in TX)
| Industry | F500 HQs | Revenue |
|---|---|---|
| Energy | 16 | $1,198B |
|
||
| Technology | 5 | $198B |
|
||
| Engineering / Construction | 4 | $72B |
|
||
| Energy Services | 3 | $60B |
|
||
| Utilities | 3 | $41B |
|
||
| Healthcare | 2 | $330B |
|
||
Price history
+52.4% since first listed10 events — show timeline
- 2026-02-19 Price Changed $159,990 NTREIS
- 2025-08-25 Price Changed $174,990 NTREIS
- 2024-10-02 Price Changed $175,000 NTREIS
- 2024-07-17 Price Changed $199,900 NTREIS
- 2024-06-17 Listed $205,000 NTREIS
- 2023-04-10 Sold (Public Records) — Public Records
- 2022-09-29 Listing Removed — NTREIS
- 2022-09-07 Listed $105,000 NTREIS
- 2019-04-17 Sold (Public Records) — Public Records
- 2011-03-25 Sold (Public Records) — Public Records
Property tax history
+16.7%/yrLatest (2025): $2,533 · +57.3% YoY. Source: county tax records.
Cash-flow waterfall
monthlySold comps — $/sqft
last 12 mo · ≤1 miLoading sold comps…