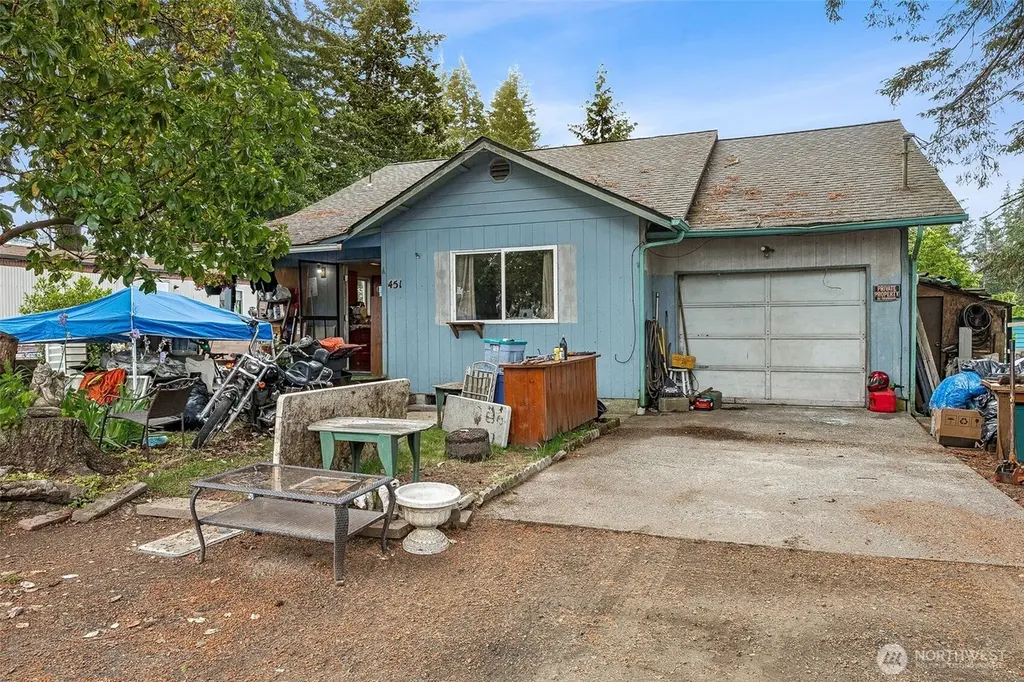
451 E Birch St · Shelton, WA
Flood risk 1/10 · Minimal
- FEMA flood zone
- X (unshaded)
- Chance of flooding over 30 yrs
- 0.0%
- Est. flood insurance / yr
- $507 – $1,088
Fire risk 3/10 · Minor
- Est. fire insurance / yr
- $604 – $1,122
Heat risk 3/10 · Minor
- Hot days now (above 88°F)
- 7 days/yr
- Hot days in 30 yrs
- 14 days/yr
Wind risk 1/10 · Minimal
- Chance of severe wind over 30 yrs
- —
Air-quality risk 7/10 · Major
- Unhealthy air days now
- 9 days/yr
- Unhealthy air days in 30 yrs
- 10 days/yr
Risk factors via First Street. Map © Google.
Why this score? — see what drove the D+ grade
The composite is a weighted blend of 9 inputs, each scored 0–100. Each bar is that input's sub-score; the figure is the points it added to the 100-point composite (weight × sub-score).
- ARV discount +15.0/15.0
- Cash flow +14.0/30.0
- DSCR +4.3/10.0
- Livability +3.7/5.0
- Schools +3.4/10.0
- 1% rule +2.6/10.0
- Rent growth +2.5/5.0
- Condition / age +2.5/5.0
- Appreciation +0.0/10.0
$235,000
🖨 Deal sheet 📄 Offer letter ✓ Due diligence
Listing remarks
INVESTOR ALERT! Opportunity awaits with this charming Shelton rambler ready for your vision and updates! With 1,048 sq ft of well-utilized living space, this home offers a functional floorplan featuring a spacious living room that flows seamlessly into the dining area and galley-style kitchen with appliances that stay. Three oversized bedrooms and a full bathroom provide plenty of space and flexibility. Newer roof (2022). This is property is ready for improvements including fresh interior paint, kitchen updates, and landscaping enhancements to unlock its full potential. The large, fenced yard offers ample room for entertaining on the deck, beautiful fruit trees, gardening space, or creating
Key facts
- Gardening space
- Galley-style kitchen
- Newer roof
Tags
Property features AI
Finance
- Other: Buyer brokerage compensation 2.5%
- Financial info: Listing terms: Cash or Conventional
Exterior
- Parking: Attached garage; Garage (total 252 sq ft); Covered parking for 1 vehicle; Driveway and off-street parking
- Security: Partially fenced
- Utilities: Electric energy source; Public water (City of Shelton); Sewer connected (City of Shelton); Power provided by PUD #3
- Home design: Single-family residence; One story; Built on lot; Main entry; Has a view
- Construction: Wood construction; Composition (shingle) roof; Poured concrete foundation; Effective year built 1991
- Exterior features: Wood siding / wood products; Deck; Partially fenced yard; Outbuildings; Fruit trees; Paved lot
Interior
- Kitchen: Microwave; Refrigerator; Stove/Range
- Bedrooms: 3 bedrooms (all on main level)
- Flooring: Laminate; Vinyl; Carpet; See remarks
- Bathrooms: 1 full bathroom with tub and separate shower
- Heating & cooling: Wall furnace (heating); No central cooling
- Interior features: Dining room; Water heater
- Laundry & utility: Washer; Dryer; Electric water heater located in garage
Neighborhood map
What this means for you Summary
Snapshot
- This is a 3-bed/1.0-bath single-family listed at $235k.
Deal economics
- At list price, monthly cash flow is $31 ($377/yr) — positive.
- The deal already cash-flows at list — no discount required.
- To meet the 1% rule (rent ≥ 1% of price), the offer needs to be $178k (24.1% below list).
- Recommended offer: $178k (24.1% below list) — sets the bar for 1% rule.
- Cap rate 6.5% vs local median 3.1% in Shelton — top-decile yield for the area; either an underpriced asset or a hidden risk that comps aren't pricing in. Stress-test before assuming the spread holds.
Location & tenants
- Location reads 73/100 on livability (#203 in WA) — a middle-class / working-renter tenant base. Strengths: housing A+, health & safety A+, amenities A-; Watch: employment D+, crime F, commute F.
- Shelton School District (town): math 31% / reading 43% proficiency, ranked #237 of 291 in WA (top 81%) — families likely to look elsewhere, expect single-tenant / working-renter base with shorter leases.
- Zoned schools: Evergreen Elementary School (429 students, 86% FRL); Shelton High School (1,473 students, 62% FRL) — zoned schools average 74% FRL vs 59% district-wide (16 pts higher); higher-poverty schools than district average — tighter screening recommended.
- Market conditions: 439 active listings in the ZIP; 1 comparable units currently listed for rent nearby; solid renter incomes; 299 units permitted in Mason County in 2024 (0 in 5+ unit buildings).
Forward outlook
- Local home prices are declining (-3.0%/yr); year-one equity from $2k of loan paydown is wiped out by about $7k of value loss. Plan a longer hold.
- Mason County population projected at -14% by 2050 — secular population decline; favor cash flow + early exit over multi-decade hold.
Negotiation context
- Only 3 days on market — expect competitive offers; lowballing is unlikely to land.
- Current owner paid $145k; list at $235k implies a 62% gain — meaningful room to come down on a strong offer.
Questions for the listing agent
- Is there a deadline driving the sale (1031 exchange, divorce, estate, relocation)? That informs how much negotiation room exists.
- Schools are D-rated, which usually means shorter tenancies and higher turnover. Who's the typical renter profile here, and what's been the actual vacancy rate?
- Crime grade is F in this area — have there been break-ins, vandalism, or insurance claims at this property in the last 3 years? What carrier currently insures it and at what premium?
- The area grade is low — what's the realistic commute time and amenity access for the typical tenant pool here? Any planned neighborhood developments (good or bad) we should know about?
- What's the average days-on-market for RENTAL listings here right now (not sales)? A rising rental-DOM trend means longer vacancies and softer asking-rent achievability than the comps imply.
- What's the recent tenant-quality profile in this submarket — average credit score on applications, eviction rate, late-payment / NSF rate, and stable-employment percentage? A property-management company in the area should have these aggregated.
- How much new for-sale + rental construction is in the pipeline within 1–3 miles? Heavy new supply typically softens prices + rents 12–24 months out; constrained supply supports both.
Investment metrics
- 1% rule
- 0.76% ✗
- Cap rate
- 6.45%
- Cash-on-cash
- 0.57%
- DSCR
- 1.03
- GRM
- 11.0
CMA / ARV
- ARV (on-the-fly)
- $321,736
- Comps found
- 3
Show comp detail 3 sales within ~0.75 mi
| Address | Dist | Beds/Ba | Sqft | Sold | Price | $/sf | Match |
|---|---|---|---|---|---|---|---|
| 531 E Birch St | 0.07mi | 3/1.0 | 1,008 (-4%) | 5mo | $309,225 | $307 | 86 |
| 723 N 5th St | 0.57mi | 3/1.0 | 1,004 (-4%) | 1mo | $324,000 | $323 | 66 |
| 722 718 W Franklin St | 0.73mi | 3/2.0 | 1,156 (+10%) | 8mo | $220,000 | $190 | 38 |
Match score weights: distance 35% · size 25% · config 20% · recency 20%. Top-matched comps best support the ARV.
Projected returns pro-forma
-3.0% appreciation · 3.0% rent growth · sell at horizon
- IRR
- -15.5%
- Equity multiple
- 0.45×
- Total profit
- $-36,202
- Equity at exit
- $35,039
- IRR
- -7.1%
- Equity multiple
- 0.55×
- Total profit
- $-29,451
- Equity at exit
- $20,319
Cash invested: $65,800 (down + closing). Projections, not guarantees.
Landlord ↔ Tenant lean methodology
- Overall (STATE)
- 28 Tenant-Leaning
- State Washington
- 28 Tenant-Leaning · D+8
- County
- — inherits STATE
- City
- — inherits STATE
ZIP-level market 98584
- Active inventory
- 439
- Price-to-rent
- 11.0×
Monthly cashflow live
- Estimated rent
- $1,784 medium interval (Pro) →
- Mortgage (P&I)
- −$1,232
- Tax from tax record
- −$48 /mo · $575/yr
- Insurance
- −$98
- HOA
- −$0
- Vacancy / Maint / Mgmt
- −$375
- Net cashflow
- $31
Break-even live
UW: 25.0% down · 7.5% · 30yr · 1.5% tax · 5.0% vac · 8.0% maint · 8.0% mgmt
Financing live
Cash to close
- Down payment
- $58,750
- Closing costs
- $7,050
- Reserves months
- —
- Total cash needed
- —
Loan-product check · same deal, 3 products live
Conventional
25% down · 7.5% · 30yr
- Down + closing
- —
- Monthly P&I
- —
- Monthly cashflow
- —
- DSCR
- —
- Eligible?
- —
Personal DTI + credit; lowest rate.
DSCR
20% down · 8.5% · 30yr
- Down + closing
- —
- Monthly P&I
- —
- Monthly cashflow
- —
- DSCR
- —
- Eligible?
- —
No personal income docs; deal must DSCR.
Hard money
10% down · 12.0% · 12mo
- Down + closing
- —
- Monthly P&I
- —
- Monthly cashflow
- —
- DSCR
- —
- Eligible?
- —
Short-term bridge; refi at stabilization.
Rent comps 1 comps
| Address | Beds | Baths | Sqft | Rent | $/sqft | DOM | Units | Dist |
|---|---|---|---|---|---|---|---|---|
| 650 E Dearborn Ave Unit 2 Shelton, WA | 2.0 | 1.0 | 800 | $1,200 | $1.50 | 43d | 1 | 0.93mi |
Listing history 4 events
-
2026-06-01statusdays on market $235,000 Pending 3 DOM
-
2026-05-31days on market $235,000 Active 2 DOM
-
2026-05-29$235,000 Active
-
2009-06-26soldstatus $145,000
ⓘ Source: listings_history table (triggers on properties + properties_extension) + one-shot
backfill from property_details.listing_events for pre-trigger history.
Tax reassessment forecast WA · Resets to sale price
- Current annual tax
- $575 · $48/mo
- Projected year-2 tax
- $2,303 · $192/mo
- Expected delta
- +$1,728/yr (+$144/mo · 300.6%)
ⓘ Screening estimate from a state-policy table — verify with the county assessor before closing.
Climate risk First Street
- Flood 1/10 Low FEMA zone X (unshaded) · 0% chance over 30 yrs
- Wildfire 3/10 Moderate
- Heat 3/10 Moderate 7 d/yr ≥88°F today · 14 d/yr by 30 yrs out
- Wind 1/10 Low
- Air quality 7/10 Severe 9 unhealthy d/yr today · 10 by 30 yrs out
Nearby sold comps map
Loading sold comps map…
Walkable amenities ~0.75 mi
Loading nearby amenities…
Taxation est. · year 1
- Rental income
- $21,412
- − Mortgage interest
- −$13,164
- − Property taxes
- −$575
- − Insurance
- −$1,175
- − Repairs & maintenance
- −$1,713
- − Management
- −$1,713
- − Depreciation
- −$6,836
- Taxable loss
- −$3,764
- Est. tax savings @ 24.0%
- +$903
- After-tax cash flow
- $1,280/yr
For passive investors: Depreciation is non-cash, so a rental often shows a tax loss while cash-flowing — sheltering income. Rental losses are passive: they offset passive income freely, and up to $25,000/yr can offset ordinary (W-2) income if you actively participate and your MAGI is under $100k (phasing out to $0 by $150k); unused losses carry forward. On sale, claimed depreciation is recaptured at up to 25%, and gains may owe capital-gains tax (a 1031 exchange can defer both). Figures are a year-1 estimate at your 24.0% rate — not tax advice; consult a CPA.
Schools (NCES district)
- District
- Shelton School District
- NCES district ID
- 5307900
- Math proficiency
- 31% ▼ -1.00%
- Reading proficiency
- 43% ▼ -3.00%
- Median HH income
- $45,467
- Composite
- 34.1/100
- National rank
- #10288
- State rank
- #237 of 291 in WA
Livability — Shelton
- Score
- 73/100
- State rank
- #203
- US rank
- #5586
Category grades
Schools grade is shown separately in the Schools card above.
Census & demographics
- Census place
- Shelton, WA
- County
- Mason County · 40,606 people
- City population
- 40,606
- Metro
- Shelton, WA
- Population (ZIP)
- 40,606
- Household income
- $78,610
- Rent vs Own
- Severe rent burden
- 687.0
Population outlook (Mason County) Hauer SSP2
- Today (2025)
- 60,005 people
- By 2030
- 58,567 · -2.4%
- By 2040
- 54,735 · -8.8%
- By 2050
- 51,470 · -14.2%
- By 2075
- 46,276 · -22.9%
- By 2100
- 39,883 · -33.5%
Race, ethnicity, and origin ACS 2023
- Neighborhood character
- Predominantly White (72%)
- Race & ethnicity
- White 72% Hispanic / Latino 15% Two or more races 11% Native American 3%
- Hispanic origin (detail)
- Mexican 8%
- Common ancestry
- Portuguese 4% Slovak 3% Italian 2%
- Foreign-born
- 8% · Canada
- Languages at home
- 88% English-only · Spanish 10%
Political lean MEDSL · Mason
- 2024 margin
- Toss-up / Even · D 47.2% · R 49.7% · Other 3.2%
- 2008→2024 swing
- -11.2pp toward R · 2008: 8.7pp · 2024: -2.5pp
- All cycles
- 2024: R+2.5 2020: R+3.9 2016: R+6.0 2012: D+6.9 2008: D+8.7
Not yet ingested
- Civics
- —
Market trends
- HPI YoY
- ▼ -232.42%
- Current HPI
- 199.0698
- Rent YoY
- —
- Metro
- Shelton, WA
- State GDP YoY
- ▲ 4.65%
- F500 in state
- 22
Industry mix (Fortune 500 HQ in WA)
| Industry | F500 HQs | Revenue |
|---|---|---|
| Retail | 2 | $269B |
|
||
| Technology / Retail | 1 | $638B |
|
||
| Technology | 1 | $245B |
|
||
| Telecommunications | 1 | $38B |
|
||
| Food / Beverage | 1 | $36B |
|
||
| Automotive / Trucks | 1 | $34B |
|
||
Price history
+62.1% since first listed2 events — show timeline
- 2026-05-29 Listed $235,000 NWMLS as Distributed by MLS Grid
- 2009-06-26 Sold (Public Records) $145,000 Public Records
Property tax history
-5.1%/yrLatest (2026): $575 · -77.7% YoY. Source: county tax records.
Cash-flow waterfall
monthlySold comps — $/sqft
last 12 mo · ≤1 miLoading sold comps…