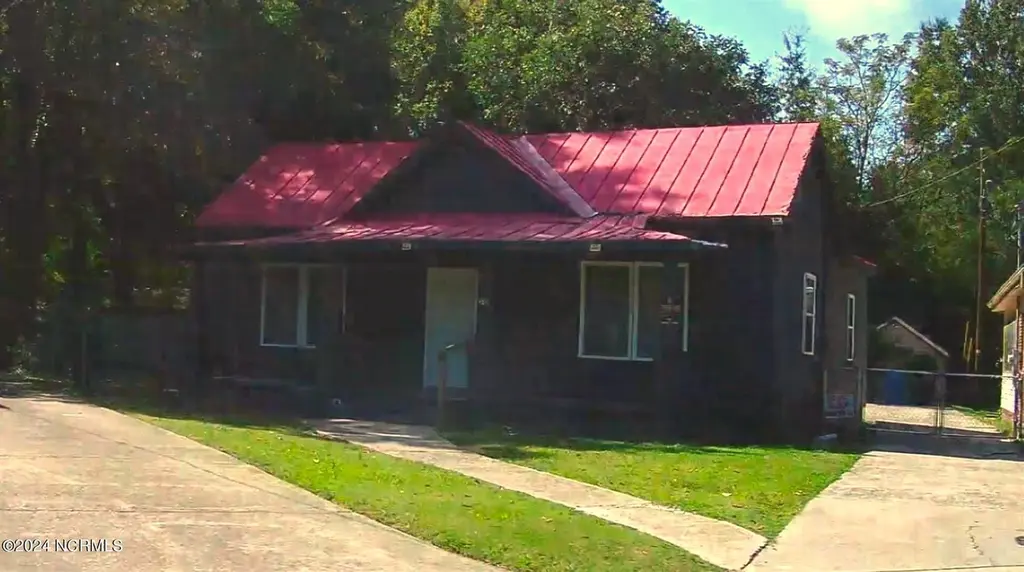
310 Finch St SE · Wilson, NC
Flood risk 1/10 · Minimal
- FEMA flood zone
- X (unshaded)
- Chance of flooding over 30 yrs
- 0.0%
- Est. flood insurance / yr
- $507 – $1,088
Fire risk 2/10 · Minimal
- Est. fire insurance / yr
- $906 – $1,684
Heat risk 7/10 · Major
- Hot days now (above 107°F)
- 7 days/yr
- Hot days in 30 yrs
- 16 days/yr
Wind risk 6/10 · Moderate
- Chance of severe wind over 30 yrs
- 76.0%
Air-quality risk 2/10 · Minimal
- Unhealthy air days now
- 2 days/yr
- Unhealthy air days in 30 yrs
- 2 days/yr
Risk factors via First Street. Map © Google.
Why this score? — see what drove the B+ grade
The composite is a weighted blend of 9 inputs, each scored 0–100. Each bar is that input's sub-score; the figure is the points it added to the 100-point composite (weight × sub-score).
- Cash flow +30.0/30.0
- ARV discount +15.0/15.0
- DSCR +10.0/10.0
- 1% rule +8.5/10.0
- Rent growth +4.3/5.0
- Schools +3.3/10.0
- Livability +3.2/5.0
- Condition / age +2.5/5.0
- Appreciation +0.0/10.0
$84,900
🖨 Deal sheet 📄 Offer letter ✓ Due diligence
Listing remarks MLS
Great investment property to add to your portfolio; 2BR, 1BA, 886SFwith huge backyard. Selling ''AS IS''
Key facts
- 6,970 sq ft lot
- Built 1925
- Listed 828 days
Property features AI
Finance
- Other: Property on city street and state road frontage; Zoning: GR6
- HOA & community: No association amenities
Exterior
- Parking: Paved parking
- Utilities: Public water; Sewer available; Water service available
- Home design: Single-family residence; One story
- Construction: Asbestos siding or construction materials; Metal roof
- Exterior features: Front porch; Chain link fencing
Interior
- Bedrooms: Total of 3 rooms (includes bedrooms and living areas)
- Bathrooms: 1 full bathroom
- Heating & cooling: Central air conditioning; Electric heating with heat pump
- Interior features: No fireplace; Crawl space basement
Neighborhood map
What this means for you Summary
Snapshot
- This is a 2-bed/1.0-bath single-family listed at $85k.
Deal economics
- At list price, monthly cash flow is $383 ($5k/yr) — positive.
- The deal already cash-flows at list — no discount required.
- Meets the 1% rule at list price ($1k rent vs $85k).
- Recommended offer: $75k (12.0% below list) — sets the bar for market timing.
- Cap rate 11.7% vs local median 3.4% in Wilson — top-decile yield for the area; either an underpriced asset or a hidden risk that comps aren't pricing in. Stress-test before assuming the spread holds.
Location & tenants
- Location reads 64/100 on livability (#374 in NC) — a middle-class / working-renter tenant base. Strengths: cost of living A+, housing A+, health & safety A; Watch: crime F, amenities F, commute F.
- Wilson County Schools (rural): math 38% / reading 40% proficiency, ranked #119 of 178 in NC (top 67%) — families likely to look elsewhere, expect single-tenant / working-renter base with shorter leases.
- Zoned schools: Vick Elementary (math 12% / reading 17%, grade F, #1,331 of 1,410 statewide, top 96%, 323 students, 99% FRL); Forest Hills Middle (math 32% / reading 38%, grade F, #286 of 475 statewide, top 61%, 670 students, 99% FRL); James Hunt High (math 67% / reading 58%, grade B-, #179 of 535 statewide, top 34%, 1,069 students, 60% FRL) — zoned schools average 86% FRL vs 58% district-wide (28 pts higher); higher-poverty schools than district average — tighter screening recommended.
- Market conditions: Rents rising fast (+7.0%/yr); 261 active listings in the ZIP; lower-income renter base — watch delinquency; 580 units permitted in Wilson County in 2024 (168 in 5+ unit buildings).
Forward outlook
- Local home prices are declining (-3.0%/yr); year-one equity from $587 of loan paydown is wiped out by about $3k of value loss. Plan a longer hold.
- Wilson County population projected to shrink 5% by 2050 — rents likely to lag national; underwrite the cash flow, not the appreciation.
- At projected returns (-3.0% appreciation + 7.0% rent growth), your $24k cash investment doubles in ~6 years — after that, you're playing with house money.
Negotiation context
- It's been on market 828 days — a 12% lower offer ($75k) is reasonable based on typical stale-listing flexibility.
- 5 sale attempts since 5y ago with the ask held roughly flat each time — persistent listings suggest the price (not the market) is what's stuck; bring a comps-based counter.
- Current owner paid $22k; list at $85k implies a 295% gain — meaningful room to come down on a strong offer.
Risks & watch-outs
- Watch-outs: built in 1925 — expect roof / HVAC / electrical / plumbing capex.
- Climate carrying-cost: major wind risk, 76% chance of damaging wind over 30y; extreme-heat days projected 7→16/yr by 2055 (HVAC capex compounding) — expect insurance premiums to compound above CPI over the hold.
Questions for the listing agent
- It's been on market 828 days. Have you received any prior offers? Is the seller open to a 12% concession, seller financing, or rate buy-down credit?
- Built in 1925 — when were the roof, HVAC, electrical panel, plumbing, and water heater last replaced?
- Why hasn't it sold? Are there any deal-killer items the seller is aware of (foundation, flood, title, zoning, code violations)?
- Is there a deadline driving the sale (1031 exchange, divorce, estate, relocation)? That informs how much negotiation room exists.
- Schools are F-rated, which usually means shorter tenancies and higher turnover. Who's the typical renter profile here, and what's been the actual vacancy rate?
- Crime grade is F in this area — have there been break-ins, vandalism, or insurance claims at this property in the last 3 years? What carrier currently insures it and at what premium?
- What's the average days-on-market for RENTAL listings here right now (not sales)? A rising rental-DOM trend means longer vacancies and softer asking-rent achievability than the comps imply.
- What's the recent tenant-quality profile in this submarket — average credit score on applications, eviction rate, late-payment / NSF rate, and stable-employment percentage? A property-management company in the area should have these aggregated.
- How much new for-sale + rental construction is in the pipeline within 1–3 miles? Heavy new supply typically softens prices + rents 12–24 months out; constrained supply supports both.
Investment metrics
- 1% rule
- 1.35% ✓
- Cap rate
- 11.70%
- Cash-on-cash
- 19.32%
- DSCR
- 1.86
- GRM
- 6.2
CMA / ARV
- ARV (on-the-fly)
- $122,268
- Comps found
- 12
Show comp detail 12 sales within ~0.75 mi
| Address | Dist | Beds/Ba | Sqft | Sold | Price | $/sf | Match |
|---|---|---|---|---|---|---|---|
| 304 Reid St E | 0.30mi | 2/1.0 | 915 (+3%) | 2mo | $117,000 | $128 | 79 |
| 912 Atlantic St E | 0.33mi | 2/1.0 | 869 (-2%) | 7mo | $35,000 | $40 | 75 |
| 1310 Washington St E | 0.24mi | 3/1.0 (+1) | 951 (+7%) | 8mo | $145,000 | $152 | 65 |
| 913 Faison St E | 0.57mi | 2/1.0 | 905 (+2%) | 8mo | $91,000 | $101 | 63 |
| 112 East St E | 0.41mi | 2/1.0 | 823 (-7%) | 10mo | $119,000 | $145 | 61 |
| 1006 Washington St E | 0.30mi | 3/1.0 (+1) | 967 (+9%) | 7mo | $107,000 | $111 | 60 |
| 902 Washington St E | 0.39mi | 2/1.0 | 792 (-11%) | 10mo | $120,000 | $152 | 56 |
| 1319 Carolina St E | 0.32mi | 3/1.0 (+1) | 1,016 (+15%) | 1mo | $140,000 | $138 | 55 |
| 1024 Faison St E | 0.54mi | 2/1.0 | 800 (-10%) | 5mo | $72,500 | $91 | 54 |
| 807 Vance St E | 0.54mi | 3/1.0 (+1) | 929 (+5%) | 12mo | $122,900 | $132 | 52 |
| 1845 E Trail Dr SE | 0.73mi | 2/2.0 | 888 (+0%) | 16mo | $180,750 | $204 | 48 |
| 1803 Ruffleleaf Cir | 0.75mi | 3/1.0 (+1) | 960 (+8%) | 13mo | $145,000 | $151 | 36 |
Match score weights: distance 35% · size 25% · config 20% · recency 20%. Top-matched comps best support the ARV.
Projected returns pro-forma
-3.0% appreciation · 7.01% rent growth · sell at horizon
- IRR
- 15.4%
- Equity multiple
- 1.65×
- Total profit
- $15,403
- Equity at exit
- $12,659
- IRR
- 26.7%
- Equity multiple
- 3.78×
- Total profit
- $66,129
- Equity at exit
- $7,341
Cash invested: $23,772 (down + closing). Projections, not guarantees.
Landlord ↔ Tenant lean methodology
- Overall (STATE)
- 85 Strongly Landlord-Friendly
- State North Carolina
- 85 Strongly Landlord-Friendly · R+3
- County
- — inherits STATE
- City
- — inherits STATE
ZIP-level market 27893
- Rents YoY
- 7.0%
- Active inventory
- 261
- Price-to-rent
- 6.2×
Monthly cashflow live
- Estimated rent
- $1,145 medium interval (Pro) →
- Mortgage (P&I)
- −$445
- Tax from tax record
- −$41 /mo · $493/yr
- Insurance
- −$35
- HOA
- −$0
- Vacancy / Maint / Mgmt
- −$240
- Net cashflow
- $383
Break-even live
UW: 25.0% down · 7.5% · 30yr · 1.5% tax · 5.0% vac · 8.0% maint · 8.0% mgmt
Financing live
Cash to close
- Down payment
- $21,225
- Closing costs
- $2,547
- Reserves months
- —
- Total cash needed
- —
Loan-product check · same deal, 3 products live
Conventional
25% down · 7.5% · 30yr
- Down + closing
- —
- Monthly P&I
- —
- Monthly cashflow
- —
- DSCR
- —
- Eligible?
- —
Personal DTI + credit; lowest rate.
DSCR
20% down · 8.5% · 30yr
- Down + closing
- —
- Monthly P&I
- —
- Monthly cashflow
- —
- DSCR
- —
- Eligible?
- —
No personal income docs; deal must DSCR.
Hard money
10% down · 12.0% · 12mo
- Down + closing
- —
- Monthly P&I
- —
- Monthly cashflow
- —
- DSCR
- —
- Eligible?
- —
Short-term bridge; refi at stabilization.
Listing history 26 events
-
2026-06-19days on market $84,900 Active 828 DOM
-
2026-06-18days on market $84,900 Active 827 DOM
-
2026-06-17days on market $84,900 Active 826 DOM
-
2026-06-16days on market $84,900 Active 825 DOM
-
2026-06-15days on market $84,900 Active 824 DOM
-
2026-06-14days on market $84,900 Active 822 DOM
-
2026-06-13days on market $84,900 Active 821 DOM
-
2026-06-10days on market $84,900 Active 819 DOM
-
2026-06-09days on market $84,900 Active 818 DOM
-
2026-06-08days on market $84,900 Active 817 DOM
-
2026-06-07days on market $84,900 Active 816 DOM
-
2026-06-05days on market $84,900 Active 813 DOM
-
2026-06-03days on market $84,900 Active 812 DOM
-
2026-06-02days on market $84,900 Active 811 DOM
-
2026-06-01days on market $84,900 Active 810 DOM
-
2026-05-31days on market $84,900 Active 809 DOM
-
2026-05-30days on market $84,900 Active 808 DOM
-
2026-03-26status Active
-
2026-03-26historical
-
2026-03-01status Active
-
2026-02-28historical
-
2025-03-13status Active
-
2025-03-01historical
-
2024-02-29$84,900 Active
-
2021-04-09soldstatus $21,500 104-char remark
Show marketing remark (104 chars)
Great investment property to add to your portfolio; 2BR, 1BA, 886SFwith huge backyard. Selling ''AS IS''
-
2021-03-23$30,000 104-char remark
Show marketing remark (104 chars)
Great investment property to add to your portfolio; 2BR, 1BA, 886SFwith huge backyard. Selling ''AS IS''
ⓘ Source: listings_history table (triggers on properties + properties_extension) + one-shot
backfill from property_details.listing_events for pre-trigger history.
Tax reassessment forecast NC · Resets to sale price
- Current annual tax
- $493 · $41/mo
- Projected year-2 tax
- $696 · $58/mo
- Expected delta
- +$203/yr (+$17/mo · 41.3%)
ⓘ Screening estimate from a state-policy table — verify with the county assessor before closing.
Climate risk First Street
- Flood 1/10 Low FEMA zone X (unshaded) · 0% chance over 30 yrs
- Wildfire 2/10 Low
- Heat 7/10 Severe 7 d/yr ≥107°F today · 16 d/yr by 30 yrs out
- Wind 6/10 Major 76% chance of damaging wind over 30 yrs
- Air quality 2/10 Low 2 unhealthy d/yr today · 2 by 30 yrs out
Nearby sold comps map
Loading sold comps map…
Walkable amenities ~0.75 mi
Loading nearby amenities…
Taxation est. · year 1
- Rental income
- $13,738
- − Mortgage interest
- −$4,756
- − Property taxes
- −$493
- − Insurance
- −$424
- − Repairs & maintenance
- −$1,099
- − Management
- −$1,099
- − Depreciation
- −$2,470
- Taxable income
- $3,397
- Est. tax owed @ 24.0%
- −$815
- After-tax cash flow
- $3,778/yr
For passive investors: Depreciation is non-cash, so a rental often shows a tax loss while cash-flowing — sheltering income. Rental losses are passive: they offset passive income freely, and up to $25,000/yr can offset ordinary (W-2) income if you actively participate and your MAGI is under $100k (phasing out to $0 by $150k); unused losses carry forward. On sale, claimed depreciation is recaptured at up to 25%, and gains may owe capital-gains tax (a 1031 exchange can defer both). Figures are a year-1 estimate at your 24.0% rate — not tax advice; consult a CPA.
Schools (NCES district)
- District
- Wilson County Schools
- NCES district ID
- 3705020
- Math proficiency
- 38% ▲ 2.00%
- Reading proficiency
- 40% ▼ -1.00%
- Median HH income
- $39,342
- Composite
- 32.64/100
- National rank
- #5665
- State rank
- #119 of 178 in NC
Livability — Wilson
- Score
- 64/100
- State rank
- #374
- US rank
- #14674
Category grades
Schools grade is shown separately in the Schools card above.
Census & demographics
- Census place
- Wilson, NC
- County
- Wilson County · 57,967 people
- City population
- 57,967
- Metro
- Wilson, NC
- Population (ZIP)
- 38,512
- Household income
- $42,810
- Rent vs Own
- Severe rent burden
- 2175.0
Population outlook (Wilson County) Hauer SSP2
- Today (2025)
- 82,765 people
- By 2030
- 82,492 · -0.3%
- By 2040
- 81,054 · -2.1%
- By 2050
- 78,610 · -5.0%
- By 2075
- 71,865 · -13.2%
- By 2100
- 62,792 · -24.1%
Race, ethnicity, and origin ACS 2023
- Neighborhood character
- Diverse neighborhood (Simpson 0.61)
- Race & ethnicity
- Black 55% White 27% Hispanic / Latino 16% Two or more races 5%
- Hispanic origin (detail)
- Mexican 13%
- Common ancestry
- Serbian 1% Slovak 1% Lithuanian 1%
- Foreign-born
- 6% · Canada, Jamaica
- Languages at home
- 86% English-only · Spanish 13%
Political lean MEDSL · Wilson
- 2024 margin
- Toss-up / Even · D 49.8% · R 49.4%
- 2008→2024 swing
- -5.7pp toward R · 2008: 6.1pp · 2024: 0.4pp
- All cycles
- 2024: D+0.4 2020: D+2.9 2016: D+5.6 2012: D+7.3 2008: D+6.1
Not yet ingested
- Civics
- —
Market trends
- HPI YoY
- ▼ -149.54%
- Current HPI
- 211.4136
- Rent YoY
- ▲ 7.01%
- Metro
- Wilson, NC
- State GDP YoY
- ▲ 3.28%
- F500 in state
- 26
Industry mix (Fortune 500 HQ in NC)
| Industry | F500 HQs | Revenue |
|---|---|---|
| Financial Services | 2 | $213B |
|
||
| Retail | 2 | $95B |
|
||
| Industrial Conglomerate | 1 | $38B |
|
||
| Metals / Steel | 1 | $35B |
|
||
| Utilities | 1 | $30B |
|
||
| Industrial Machinery | 1 | $19B |
|
||
Price history
+183.0% since first listed9 events — show timeline
- 2026-03-26 Relisted — Hive MLS
- 2026-03-26 Listing Removed — Hive MLS
- 2026-03-01 Relisted — Hive MLS
- 2026-02-28 Listing Removed — Hive MLS
- 2025-03-13 Relisted — Hive MLS
- 2025-03-01 Listing Removed — Hive MLS
- 2024-02-29 Listed $84,900 Hive MLS
- 2021-04-09 Sold (MLS) $21,500 Hive MLS
- 2021-03-23 Listed $30,000 Hive MLS
Property tax history
+1.9%/yrLatest (2025): $493 · +0.0% YoY. Source: county tax records.
Cash-flow waterfall
monthlySold comps — $/sqft
last 12 mo · ≤1 miLoading sold comps…