1107 Summer City Rd Rd · Pikeville, TN
Flood risk 1/10 · Minimal
- FEMA flood zone
- X (unshaded)
- Chance of flooding over 30 yrs
- 0.0%
- Est. flood insurance / yr
- $507 – $1,088
Fire risk 7/10 · Major
- Est. fire insurance / yr
- $949 – $1,763
Heat risk 4/10 · Minor
- Hot days now (above 100°F)
- 7 days/yr
- Hot days in 30 yrs
- 19 days/yr
Wind risk 4/10 · Minor
- Chance of severe wind over 30 yrs
- 10.0%
Air-quality risk 3/10 · Minor
- Unhealthy air days now
- 3 days/yr
- Unhealthy air days in 30 yrs
- 3 days/yr
Risk factors via First Street. Map © Google.
Why this score? — see what drove the C+ grade
The composite is a weighted blend of 9 inputs, each scored 0–100. Each bar is that input's sub-score; the figure is the points it added to the 100-point composite (weight × sub-score).
- Cash flow +22.0/30.0
- Appreciation +10.0/10.0
- DSCR +7.0/10.0
- 1% rule +5.8/10.0
- ARV discount +5.6/15.0
- Livability +3.0/5.0
- Rent growth +2.5/5.0
- Condition / age +2.2/5.0
- Schools +1.9/10.0
$238,000
🖨 Deal sheet 📄 Offer letter ✓ Due diligence
Listing remarks MLS
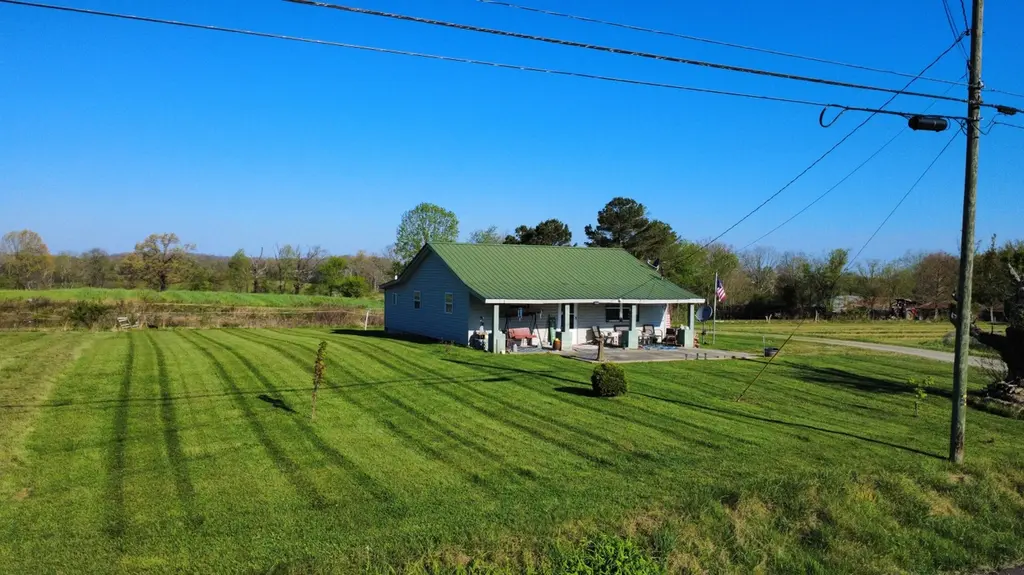
Escape to your own slice of East Tennessee paradise with this charming 3 bedroom, 1 bath home nestled on 3.4 acres. If you've been dreaming of quite country living with room to roam - this is it! Enjoy the outdoors with two private ponds, perfect for a relaxing evening, fishing, or simply soaking in the peaceful scenery. The property offers plenty of space for gardening, animals, or future expansion - all with no restrictions giving you the freedom to make it truly your own. A convenient carport adds everyday functionality, while the location offer the best of both worlds - peaceful mountain surroundings with an easy drive to Dayton and Pikeville. Whether you're looking for a full time residence, weekend getaway, or investment opportunity, this property is full of potential and charm. Come experience the quite life and schedule your showing today!
Key facts
- Space for gardening
- Private ponds
- Room to roam
Tags
Neighborhood map
What this means for you Summary
Snapshot
- This is a 3-bed/1.0-bath single-family listed at $238k. Condition is rated fair.
Deal economics
- At list price, monthly cash flow is $380 ($5k/yr) — positive.
- The deal already cash-flows at list — no discount required.
- Meets the 1% rule at list price ($3k rent vs $238k).
- Recommended offer: $224k (6.0% below list) — sets the bar for market timing.
- Cap rate 8.2% vs local median 4.8% in Pikeville — top-decile yield for the area; either an underpriced asset or a hidden risk that comps aren't pricing in. Stress-test before assuming the spread holds.
Location & tenants
- Location reads 59/100 on livability (#296 in TN) — a working-class tenant base; expect higher turnover. Strengths: cost of living A+, crime A, housing B+; Watch: health & safety C-, schools F, amenities F.
- Bledsoe County (rural): math 19% / reading 27% proficiency, ranked #104 of 139 in TN (top 75%) — low school quality limits family demand, transient renter base, plan for 1-2y turnover; 69% free/reduced lunch — lower-income household profile, screen leases tightly.
- Market conditions: 155 active listings in the ZIP.
- At $2,562/mo this rent would consume 56% of the median local household income ($55k/yr) — very limited rent-growth headroom before tenants either downsize or default.
Forward outlook
- In year one you build about $25k of equity ($2k loan paydown + $24k appreciation (10.0% local appreciation)).
- Bledsoe County population projected at +36% by 2050 — long-run rental-demand tailwind backs the buy-and-hold thesis.
- At projected returns (10.0% appreciation + 3.0% rent growth), your $67k cash investment doubles in ~3 years — after that, you're playing with house money.
- By year 2, paydown + projected appreciation supports a ~$41k cash-out refi (75% LTV) — recoverable capital for the next deal without selling this one.
Negotiation context
- It's been on market 66 days — a 6% lower offer ($224k) is reasonable based on typical stale-listing flexibility.
Risks & watch-outs
- Climate carrying-cost: major wildfire risk — expect insurance premiums to compound above CPI over the hold.
Questions for the listing agent
- It's been on market 66 days. Have you received any prior offers? Is the seller open to a 6% concession, seller financing, or rate buy-down credit?
- Have any recent inspections been done? Can we get a copy of the seller's disclosures and any deferred-maintenance estimates?
- Built in 1969 — when were the roof, HVAC, electrical panel, plumbing, and water heater last replaced?
- Why hasn't it sold? Are there any deal-killer items the seller is aware of (foundation, flood, title, zoning, code violations)?
- Is there a deadline driving the sale (1031 exchange, divorce, estate, relocation)? That informs how much negotiation room exists.
- Schools are F-rated, which usually means shorter tenancies and higher turnover. Who's the typical renter profile here, and what's been the actual vacancy rate?
- What's the average days-on-market for RENTAL listings here right now (not sales)? A rising rental-DOM trend means longer vacancies and softer asking-rent achievability than the comps imply.
- What's the recent tenant-quality profile in this submarket — average credit score on applications, eviction rate, late-payment / NSF rate, and stable-employment percentage? A property-management company in the area should have these aggregated.
- How much new for-sale + rental construction is in the pipeline within 1–3 miles? Heavy new supply typically softens prices + rents 12–24 months out; constrained supply supports both.
Investment metrics
- 1% rule
- 1.08% ✓
- Cap rate
- 8.21%
- Cash-on-cash
- 6.83%
- DSCR
- 1.30
- GRM
- 7.7
CMA / ARV
- ARV (median comp)
- $228,445
- List price
- $238,000
- Delta
- 4.18%
- Verdict
- FAIR
- Comps
- 9 within 2.0 mi
Projected returns pro-forma
10.0% appreciation · 3.0% rent growth · sell at horizon
- IRR
- 29.3%
- Equity multiple
- 3.31×
- Total profit
- $153,834
- Equity at exit
- $214,409
- IRR
- 25.4%
- Equity multiple
- 7.51×
- Total profit
- $434,083
- Equity at exit
- $462,382
Cash invested: $66,640 (down + closing). Projections, not guarantees.
Landlord ↔ Tenant lean methodology
- Overall (STATE)
- 87 Strongly Landlord-Friendly
- State Tennessee
- 87 Strongly Landlord-Friendly · R+13
- County
- — inherits STATE
- City
- — inherits STATE
ZIP-level market 37367
- Home prices YoY
- 34.5%
- Active inventory
- 155
- Price-to-rent
- 7.7×
Monthly cashflow live
- Estimated rent
- $2,562 medium interval (Pro) →
- Mortgage (P&I)
- −$1,248
- Tax est. 1.5%
- −$298 /mo · $3,570/yr
- Insurance
- −$99
- HOA
- −$0
- Vacancy / Maint / Mgmt
- −$538
- Net cashflow
- $380
Break-even live
UW: 25.0% down · 7.5% · 30yr · 1.5% tax · 5.0% vac · 8.0% maint · 8.0% mgmt
Financing live
Cash to close
- Down payment
- $59,500
- Closing costs
- $7,140
- Reserves months
- —
- Total cash needed
- —
Loan-product check · same deal, 3 products live
Conventional
25% down · 7.5% · 30yr
- Down + closing
- —
- Monthly P&I
- —
- Monthly cashflow
- —
- DSCR
- —
- Eligible?
- —
Personal DTI + credit; lowest rate.
DSCR
20% down · 8.5% · 30yr
- Down + closing
- —
- Monthly P&I
- —
- Monthly cashflow
- —
- DSCR
- —
- Eligible?
- —
No personal income docs; deal must DSCR.
Hard money
10% down · 12.0% · 12mo
- Down + closing
- —
- Monthly P&I
- —
- Monthly cashflow
- —
- DSCR
- —
- Eligible?
- —
Short-term bridge; refi at stabilization.
Listing history 15 events
-
2026-06-18days on market $238,000 Active 66 DOM
-
2026-06-17days on market $238,000 Active 65 DOM
-
2026-06-16days on market $238,000 Active 64 DOM
-
2026-06-15days on market $238,000 Active 63 DOM
-
2026-06-14days on market $238,000 Active 61 DOM
-
2026-06-10days on market $238,000 Active 58 DOM
-
2026-06-09days on market $238,000 Active 57 DOM
-
2026-06-08days on market $238,000 Active 56 DOM
-
2026-06-07pricedays on market $238,000 Active 55 DOM
-
2026-06-03days on market $250,000 Active 51 DOM
-
2026-06-02days on market $250,000 Active 50 DOM
-
2026-06-01days on market $250,000 Active 49 DOM
-
2026-05-31days on market $250,000 Active 48 DOM
-
2026-05-30days on market $250,000 Active 47 DOM
-
2026-04-11$250,000 Active 860-char remark
Show marketing remark (860 chars)
Escape to your own slice of East Tennessee paradise with this charming 3 bedroom, 1 bath home nestled on 3.4 acres. If you've been dreaming of quite country living with room to roam - this is it! Enjoy the outdoors with two private ponds, perfect for a relaxing evening, fishing, or simply soaking in the peaceful scenery. The property offers plenty of space for gardening, animals, or future expansion - all with no restrictions giving you the freedom to make it truly your own. A convenient carport adds everyday functionality, while the location offer the best of both worlds - peaceful mountain surroundings with an easy drive to Dayton and Pikeville. Whether you're looking for a full time residence, weekend getaway, or investment opportunity, this property is full of potential and charm. Come experience the quite life and schedule your showing today!
ⓘ Source: listings_history table (triggers on properties + properties_extension) + one-shot
backfill from property_details.listing_events for pre-trigger history.
Climate risk First Street
- Flood 1/10 Low FEMA zone X (unshaded) · 0% chance over 30 yrs
- Wildfire 7/10 Severe
- Heat 4/10 Moderate 7 d/yr ≥100°F today · 19 d/yr by 30 yrs out
- Wind 4/10 Moderate 10% chance of damaging wind over 30 yrs
- Air quality 3/10 Moderate 3 unhealthy d/yr today · 3 by 30 yrs out
Nearby sold comps map
Loading sold comps map…
Walkable amenities ~0.75 mi
Loading nearby amenities…
Taxation est. · year 1
- Rental income
- $30,749
- − Mortgage interest
- −$13,332
- − Property taxes
- −$3,570
- − Insurance
- −$1,190
- − Repairs & maintenance
- −$2,460
- − Management
- −$2,460
- − Depreciation
- −$6,924
- Taxable income
- $814
- Est. tax owed @ 24.0%
- −$195
- After-tax cash flow
- $4,359/yr
For passive investors: Depreciation is non-cash, so a rental often shows a tax loss while cash-flowing — sheltering income. Rental losses are passive: they offset passive income freely, and up to $25,000/yr can offset ordinary (W-2) income if you actively participate and your MAGI is under $100k (phasing out to $0 by $150k); unused losses carry forward. On sale, claimed depreciation is recaptured at up to 25%, and gains may owe capital-gains tax (a 1031 exchange can defer both). Figures are a year-1 estimate at your 24.0% rate — not tax advice; consult a CPA.
Condition & rehab AI · 13 photos
The home is in fair condition with moderate repairs and maintenance needed. Painting the interior and repairing the exterior siding can significantly increase its value.
Repairs flagged
- Moderate Exterior siding — The exterior siding shows signs of wear and discoloration.
- Moderate Interior walls/paint — The interior walls and paint show signs of wear and discoloration.
- Moderate Landscaping — The landscaping appears overgrown and in need of maintenance.
Value-add opportunities
- Resale Paint interior walls — Fresh paint can make the interior look more inviting and modern, increasing the home's appeal to potential buyers.
- Resale Repair exterior siding — A well-maintained exterior can significantly increase the home's curb appeal and perceived value.
- Both Maintain landscaping — Well-maintained landscaping can enhance the home's curb appeal and increase both resale and rental value.
Renovation cost estimate screening
| Repair item | Severity | Est. cost |
|---|---|---|
| Exterior siding · The exterior siding shows signs of wear and discoloration. | Moderate | $3,000–15,000 |
| Interior walls/paint · The interior walls and paint show signs of wear and discoloration. | Moderate | $3,000–15,000 |
| Landscaping · The landscaping appears overgrown and in need of maintenance. | Moderate | $3,000–15,000 |
| Total estimated repair cost · 3 items | $9,000–45,000 |
Value-add ROI direction
- Resale Paint interior walls — Fresh paint can make the interior look more inviting and modern, increasing the home's appeal to potential buyers. ↑
- Resale Repair exterior siding — A well-maintained exterior can significantly increase the home's curb appeal and perceived value. ↑
- Both Maintain landscaping — Well-maintained landscaping can enhance the home's curb appeal and increase both resale and rental value. ↑
ⓘ Cost ranges are severity-bucket heuristics (US national rule-of-thumb). Get contractor quotes + a written scope before underwriting a rehab budget.
Schools (NCES district)
- District
- Bledsoe County
- NCES district ID
- 4700270
- Math proficiency
- 19% ▼ -13.00%
- Reading proficiency
- 27% ▼ -1.00%
- Median HH income
- $35,901
- Composite
- 19.02/100
- National rank
- #8845
- State rank
- #104 of 139 in TN
Livability — Pikeville
- Score
- 59/100
- State rank
- #296
- US rank
- #20539
Category grades
Schools grade is shown separately in the Schools card above.
Census & demographics
- County
- Bledsoe · 11,736 people
- Population (ZIP)
- 11,736
- Household income
- $54,696
- Rent vs Own
- Severe rent burden
- 2.1
Population outlook (Bledsoe County) Hauer SSP2
- Today (2025)
- 18,085 people
- By 2030
- 19,649 · +8.6%
- By 2040
- 22,438 · +24.1%
- By 2050
- 24,582 · +35.9%
- By 2075
- 26,769 · +48.0%
- By 2100
- 25,033 · +38.4%
Race, ethnicity, and origin ACS 2023
- Neighborhood character
- Predominantly White (86%)
- Race & ethnicity
- White 86% Black 7% Two or more races 6% Hispanic / Latino 2%
- Common ancestry
- Italian 1% Slovak 1% Lithuanian 1%
- Foreign-born
- 2% · Canada
- Languages at home
- 97% English-only · German/W. Germanic 1% Spanish 1%
Political lean MEDSL · Bledsoe
- 2024 margin
- Solid R (+70.5) · D 14.4% · R 84.9%
- 2008→2024 swing
- -36.0pp toward R · 2008: -34.5pp · 2024: -70.5pp
- All cycles
- 2024: R+70.5 2020: R+65.2 2016: R+58.6 2012: R+40.3 2008: R+34.5
Not yet ingested
- Civics
- —
Market trends
- HPI YoY
- ▲ 106.44%
- Current HPI
- 415.344
- Rent YoY
- —
- Metro
- —
- State GDP YoY
- ▲ 2.78%
- F500 in state
- 22
Industry mix (Fortune 500 HQ in TN)
| Industry | F500 HQs | Revenue |
|---|---|---|
| Healthcare | 3 | $91B |
|
||
| Retail | 3 | $72B |
|
||
| Transportation / Logistics | 1 | $88B |
|
||
| Paper / Packaging | 1 | $19B |
|
||
| Insurance | 1 | $13B |
|
||
| Energy | 1 | $12B |
|
||
Price history
1 event — show timeline
- 2026-04-11 Listed $250,000 GCAR
Cash-flow waterfall
monthlySold comps — $/sqft
last 12 mo · ≤1 miLoading sold comps…