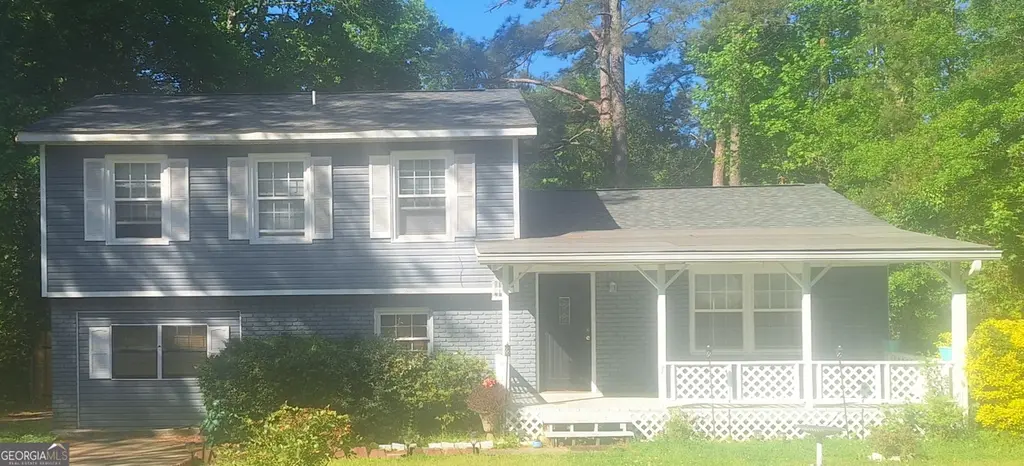
10895 Thrasher Rd · Bonanza, GA
Flood risk 1/10 · Minimal
- FEMA flood zone
- X (unshaded)
- Chance of flooding over 30 yrs
- 0.0%
- Est. flood insurance / yr
- $507 – $1,088
Fire risk 2/10 · Minimal
- Est. fire insurance / yr
- $963 – $1,789
Heat risk 6/10 · Moderate
- Hot days now (above 105°F)
- 7 days/yr
- Hot days in 30 yrs
- 19 days/yr
Wind risk 6/10 · Moderate
- Chance of severe wind over 30 yrs
- 27.0%
Air-quality risk 4/10 · Minor
- Unhealthy air days now
- 5 days/yr
- Unhealthy air days in 30 yrs
- 6 days/yr
Risk factors via First Street. Map © Google.
Why this score? — see what drove the D grade
The composite is a weighted blend of 9 inputs, each scored 0–100. Each bar is that input's sub-score; the figure is the points it added to the 100-point composite (weight × sub-score).
- ARV discount +12.4/15.0
- Cash flow +11.8/30.0
- DSCR +3.5/10.0
- Livability +3.1/5.0
- Rent growth +3.0/5.0
- 1% rule +2.9/10.0
- Condition / age +2.5/5.0
- Schools +1.3/10.0
- Appreciation +0.0/10.0
$240,000
🖨 Deal sheet 📄 Offer letter ✓ Due diligence
Listing remarks MLS
Greater starter home for large family looking for extra space. Home has 4 bedrooms and 2.5 baths and nice updated kitchen with beautiful tile flooring. large deck on back of house for family entertainment. Annual flowers that bloom makes this place stand out. Stove top and refrigerator stays. The front porch area is perfect for adding a swing or catching the evening breeze. There is an in-law suite made in a separate structure located in back yard. Nice shed for extra storage is included.
Key facts
- Large deck
- In-law suite
- Extra storage
Tags
Neighborhood map
What this means for you Summary
Snapshot
- This is a 3-bed/2.0-bath single-family listed at $240k.
Deal economics
- At list price, monthly cash flow is $-68 ($-813/yr) — negative.
- To cash-flow at today's rent, offer at most $228k (5.0% below list).
- To meet the 1% rule (rent ≥ 1% of price), the offer needs to be $190k (20.7% below list).
- Recommended offer: $190k (20.7% below list) — sets the bar for 1% rule.
Location & tenants
- Location reads 62/100 on livability (#314 in GA) — a middle-class / working-renter tenant base. Strengths: cost of living A+, housing A+, crime A; Watch: employment C-, schools F, amenities F.
- Clayton County (suburban): math 11% / reading 20% proficiency, ranked #155 of 174 in GA (top 89%) — low school quality limits family demand, transient renter base, plan for 1-2y turnover; 78% free/reduced lunch — lower-income household profile, screen leases tightly.
- Market conditions: Rents rising (+2.1%/yr); 251 active listings in the ZIP; 40 comparable units currently listed for rent nearby; rentals at typical pace (median 24d on market — plan ~3-4 weeks tenant-placement turnaround); 48% of comp listings sitting > 30 days — soft ceiling on asking rent; 865 units permitted in Clayton County in 2024 (448 in 5+ unit buildings).
- This rent runs 37% of the median local income ($62k/yr) — at the standard rent-burdened threshold; future hikes will face affordability resistance.
Forward outlook
- Local home prices are declining (-3.0%/yr); year-one equity from $2k of loan paydown is wiped out by about $7k of value loss. Plan a longer hold.
- Clayton County population projected at +29% by 2050 — long-run rental-demand tailwind backs the buy-and-hold thesis.
Negotiation context
- It's been on market 59 days — a 3% lower offer ($233k) is reasonable based on typical stale-listing flexibility.
- 7 sale attempts since 16y ago; this cycle's ask is 14018% above the opening price — seller raised mid-cycle; expect resistance to lowballs.
- Current owner paid $24k; list at $240k implies a 900% gain — meaningful room to come down on a strong offer.
Risks & watch-outs
- Climate carrying-cost: major wind risk, 27% chance of damaging wind over 30y; extreme-heat days projected 7→19/yr by 2055 (HVAC capex compounding) — expect insurance premiums to compound above CPI over the hold.
Questions for the listing agent
- What do current leases actually rent for vs. the listed asking? Can we see a recent rent roll and the last 12 months of T-12 income?
- It's been on market 59 days. Have you received any prior offers? Is the seller open to a 21% concession, seller financing, or rate buy-down credit?
- Built in 1972 — when were the roof, HVAC, electrical panel, plumbing, and water heater last replaced?
- Is there a deadline driving the sale (1031 exchange, divorce, estate, relocation)? That informs how much negotiation room exists.
- Schools are F-rated, which usually means shorter tenancies and higher turnover. Who's the typical renter profile here, and what's been the actual vacancy rate?
- The area grade is low — what's the realistic commute time and amenity access for the typical tenant pool here? Any planned neighborhood developments (good or bad) we should know about?
- What's the average days-on-market for RENTAL listings here right now (not sales)? A rising rental-DOM trend means longer vacancies and softer asking-rent achievability than the comps imply.
- What's the recent tenant-quality profile in this submarket — average credit score on applications, eviction rate, late-payment / NSF rate, and stable-employment percentage? A property-management company in the area should have these aggregated.
- How much new for-sale + rental construction is in the pipeline within 1–3 miles? Heavy new supply typically softens prices + rents 12–24 months out; constrained supply supports both.
Investment metrics
- 1% rule
- 0.79% ✗
- Cap rate
- 5.95%
- Cash-on-cash
- -1.21%
- DSCR
- 0.95
- GRM
- 10.5
CMA / ARV
- ARV (median comp)
- $269,619
- List price
- $240,000
- Delta
- -10.99%
- Verdict
- UNDERPRICED
- Comps
- 20 within 1.0 mi
Show comp detail 12 sales within ~0.75 mi
| Address | Dist | Beds/Ba | Sqft | Sold | Price | $/sf | Match |
|---|---|---|---|---|---|---|---|
| 1792 Portwest Way | 0.17mi | 3/2.5 | 1,746 (+8%) | 10mo | $263,000 | $151 | 69 |
| 10959 Thrasher Rd | 0.14mi | 3/2.0 | 1,395 (-14%) | 3mo | $205,000 | $147 | 68 |
| 11120 Tara Glynn Dr | 0.53mi | 3/2.0 | 1,459 (-10%) | 3mo | $249,000 | $171 | 56 |
| 1694 Pheasant Dr | 0.27mi | 3/1.5 | 1,398 (-14%) | 8mo | $210,000 | $150 | 56 |
| 11045 Knotty Pine Pl | 0.40mi | 3/2.0 | 1,410 (-13%) | 6mo | $183,000 | $130 | 55 |
| 10846 Sunfield Way | 0.66mi | 3/2.5 | 1,667 (+3%) | 12mo | $280,000 | $168 | 53 |
| 11139 Silver Aspen Ct | 0.55mi | 3/2.0 | 1,464 (-10%) | 8mo | $210,000 | $143 | 52 |
| 11203 Knotty Pine Pl | 0.67mi | 3/2.0 | 1,444 (-11%) | 1mo | $195,000 | $135 | 49 |
| 1579 Leonard St | 0.62mi | 3/2.5 | 1,802 (+11%) | 4mo | $240,000 | $133 | 47 |
| 1623 Elizabeth Ln | 0.60mi | 3/2.0 | 1,392 (-14%) | 3mo | $213,000 | $153 | 46 |
| 1329 Birdsong Ln | 0.75mi | 3/2.0 | 1,407 (-13%) | 2mo | $275,000 | $195 | 42 |
| 11146 Shadow Creek Ter | 0.70mi | 4/2.5 (+1) | 1,814 (+12%) | 1mo | $263,000 | $145 | 40 |
Match score weights: distance 35% · size 25% · config 20% · recency 20%. Top-matched comps best support the ARV.
Projected returns pro-forma
-3.0% appreciation · 2.06% rent growth · sell at horizon
- IRR
- -19.3%
- Equity multiple
- 0.33×
- Total profit
- $-45,015
- Equity at exit
- $35,785
- IRR
- -14.0%
- Equity multiple
- 0.23×
- Total profit
- $-52,038
- Equity at exit
- $20,751
Cash invested: $67,200 (down + closing). Projections, not guarantees.
Landlord ↔ Tenant lean methodology
- Overall (STATE)
- 90 Strongly Landlord-Friendly
- State Georgia
- 90 Strongly Landlord-Friendly · R+3
- County
- — inherits STATE
- City
- — inherits STATE
ZIP-level market 30238
- Home prices YoY
- -33.3%
- Rents YoY
- 2.1%
- Active inventory
- 251
- Price-to-rent
- 10.5×
Monthly cashflow live
- Estimated rent
- $1,904 high interval (Pro) →
- Mortgage (P&I)
- −$1,259
- Tax from tax record
- −$213 /mo · $2,558/yr
- Insurance
- −$100
- HOA
- −$0
- Vacancy / Maint / Mgmt
- −$400
- Net cashflow
- $-68
Break-even live
UW: 25.0% down · 7.5% · 30yr · 1.5% tax · 5.0% vac · 8.0% maint · 8.0% mgmt
Financing live
Cash to close
- Down payment
- $60,000
- Closing costs
- $7,200
- Reserves months
- —
- Total cash needed
- —
Loan-product check · same deal, 3 products live
Conventional
25% down · 7.5% · 30yr
- Down + closing
- —
- Monthly P&I
- —
- Monthly cashflow
- —
- DSCR
- —
- Eligible?
- —
Personal DTI + credit; lowest rate.
DSCR
20% down · 8.5% · 30yr
- Down + closing
- —
- Monthly P&I
- —
- Monthly cashflow
- —
- DSCR
- —
- Eligible?
- —
No personal income docs; deal must DSCR.
Hard money
10% down · 12.0% · 12mo
- Down + closing
- —
- Monthly P&I
- —
- Monthly cashflow
- —
- DSCR
- —
- Eligible?
- —
Short-term bridge; refi at stabilization.
Rent comps 40 comps
| Address | Beds | Baths | Sqft | Rent | $/sqft | DOM | Units | Dist |
|---|---|---|---|---|---|---|---|---|
| 10903 Thrasher Rd Hampton, GA | 3.0 | 2.0 | 1412 | $1,725 | $1.22 | 22d | 1 | 0.02mi |
| 1652 Thorn Ridge Trl Hampton, GA | 3.0 | 2.0 | 1360 | $1,960 | $1.44 | 43d | 1 | 0.21mi |
| 10887 Tara Blvd Hampton, GA | 3.0 | 2.5 | 1756 | $2,032 | $1.16 | 4d | 10 | 0.31mi |
| 10784 Knotty Pine Pl Hampton, GA | 3.0 | 2.0 | 1329 | $1,795 | $1.35 | 43d | 1 | 0.32mi |
| 11035 Shannon Cir Hampton, GA | 3.0 | 2.0 | 1320 | $1,606 | $1.22 | 12d | 1 | 0.36mi |
| 10911 Tara Blvd Lovejoy, GA | 1.0–3.0 | 1.0–2.0 | 1150 | $1,795 | $1.56 | 43d | 1 | 0.40mi |
| 10624 Woodcock St Jonesboro, GA | 4.0 | 2.0 | 1171 | $1,670 | $1.43 | 22d | 1 | 0.46mi |
| 11015 Tara Blvd Lovejoy, GA | 1.0–3.0 | 1.0–2.0 | 1113 | $1,815 | $1.63 | 43d | 1 | 0.47mi |
| 1562 Onalee Dr Hampton, GA | 3.0 | 2.5 | 2125 | $1,775 | $0.84 | 18d | 1 | 0.57mi |
| 1562 Onalee Dr Hampton, GA | 3.0 | 2.0 | 2125 | $1,800 | $0.85 | 43d | 1 | 0.57mi |
| 1578 Onalee Dr Hampton, GA | 3.0 | 2.5 | 1709 | $1,800 | $1.05 | 24d | 1 | 0.57mi |
| 1591 Elizabeth Ln Hampton, GA | 3.0 | 2.0 | 1352 | $1,591 | $1.18 | 43d | 1 | 0.59mi |
| 1496 Paladin Ct Hampton, GA | 4.0 | 2.5 | 1116 | $2,045 | $1.83 | 19d | 1 | 0.59mi |
| 1374 Misty Ridge Ct Hampton, GA | 3.0 | 2.0 | 1250 | $1,775 | $1.42 | 43d | 1 | 0.62mi |
| 11116 Shadow Creek Ter Hampton, GA | 3.0 | 2.5 | 2195 | $2,035 | $0.93 | 12d | 1 | 0.65mi |
| 10527 Thrasher Rd Jonesboro, GA | 4.0 | 2.5 | 2028 | $1,850 | $0.91 | 5d | 1 | 0.66mi |
| 1556 Wren Rd Jonesboro, GA | 3.0 | 2.0 | 1388 | $1,715 | $1.24 | 43d | 1 | 0.67mi |
| 1340 Birdsong Ln Hampton, GA | 3.0 | 2.5 | 1640 | $1,961 | $1.20 | 5d | 1 | 0.70mi |
| 10960 Morning Dove Dr Hampton, GA | 3.0 | 2.0 | 1600 | $4,600 | $2.88 | 43d | 1 | 0.73mi |
| 11236 James Madison Dr Hampton, GA | 3.0 | 2.5 | 1518 | $1,870 | $1.23 | 43d | 1 | 0.76mi |
| 11248 James Madison Dr Hampton, GA | 3.0 | 2.5 | 1986 | $1,980 | $1.00 | 11d | 1 | 0.78mi |
| 1442 Starling Ct Hampton, GA | 3.0 | 2.0 | 1668 | $1,885 | $1.13 | 43d | 1 | 0.80mi |
| 10507 Starling Trl Hampton, GA | 4.0 | 2.5 | 1800 | $2,131 | $1.18 | 43d | 1 | 0.84mi |
| 1371 Pebble Ridge Ln Hampton, GA | 3.0 | 3.0 | 2109 | $2,120 | $1.01 | 24d | 1 | 0.87mi |
| 10473 Starling Trl Hampton, GA | 4.0 | 3.0 | 1835 | $2,367 | $1.29 | 24d | 1 | 0.87mi |
| 1478 Carriage Ln Jonesboro, GA | 3.0 | 2.0 | 1436 | $1,675 | $1.17 | 22d | 1 | 0.93mi |
| 1786 Old Dogwood Jonesboro, GA | 3.0 | 2.5 | 1454 | $1,730 | $1.19 | 43d | 1 | 1.07mi |
| 10950 Southwood Dr Hampton, GA | 4.0 | 2.5 | 2116 | $2,095 | $0.99 | 43d | 1 | 1.07mi |
| 1798 Old Dogwood Jonesboro, GA | 3.0 | 3.0 | 1454 | $1,730 | $1.19 | 24d | 1 | 1.07mi |
| 1814 Old Dogwood Jonesboro, GA | 3.0 | 2.5 | 1454 | $1,730 | $1.19 | 43d | 1 | 1.08mi |
| 1830 Old Dogwood Jonesboro, GA | 3.0 | 2.5 | 1454 | $1,730 | $1.19 | 43d | 1 | 1.08mi |
| 1834 Old Dogwood Jonesboro, GA | 3.0 | 2.5 | 1454 | $1,730 | $1.19 | 43d | 1 | 1.08mi |
| 1135 Misty Meadows Way Hampton, GA | 4.0 | 2.5 | 1942 | $2,245 | $1.16 | 5d | 1 | 1.10mi |
| 1779 Old Dogwood Jonesboro, GA | 3.0 | 2.5 | 1454 | $1,730 | $1.19 | 43d | 1 | 1.10mi |
| 1795 Old Dogwood Jonesboro, GA | 3.0 | 3.0 | 1454 | $1,730 | $1.19 | 43d | 1 | 1.10mi |
| 10357 Briarbay Dr Jonesboro, GA | 3.0 | 2.0 | 1180 | $1,610 | $1.36 | 2d | 1 | 1.11mi |
| 1902 Grove Way Lovejoy, GA | 3.0 | 2.5 | 1592 | $1,555 | $0.98 | 3d | 1 | 1.13mi |
| 10564 Village Lndg Jonesboro, GA | 3.0 | 2.5 | 1617 | $1,800 | $1.11 | 24d | 1 | 1.13mi |
| 10972 Clearwater Dr Hampton, GA | 3.0 | 2.5 | 1628 | $1,890 | $1.16 | 24d | 1 | 1.14mi |
| 1863 Grove Way Lovejoy, GA | 3.0 | 2.5 | 1592 | $1,660 | $1.04 | 24d | 1 | 1.15mi |
Listing history 41 events
-
2026-06-18statusdays on market $240,000 Active 59 DOM
-
2026-06-17days on market $240,000 Price Change 58 DOM
-
2026-06-16days on market $240,000 Price Change 57 DOM
-
2026-06-15remarks 691-char remark
-
2026-06-15pricestatus $240,000 Price Change 56 DOM
-
2026-06-15days on market $249,000 Active 56 DOM
-
2026-06-13days on market $249,000 Active 54 DOM
-
2026-06-09days on market $249,000 Active 50 DOM
-
2026-06-08days on market $249,000 Active 49 DOM
-
2026-06-07days on market $249,000 Active 48 DOM
-
2026-06-04days on market $249,000 Active 45 DOM
-
2026-06-03days on market $249,000 Active 44 DOM
-
2026-06-02days on market $249,000 Active 43 DOM
-
2026-06-01days on market $249,000 Active 42 DOM
-
2026-05-31days on market $249,000 Active 41 DOM
-
2026-05-15price $249,000 499-char remark
Show marketing remark (499 chars)
Greater starter home for large family looking for extra space. Home has 4 bedrooms and 2.5 baths and nice updated kitchen with beautiful tile flooring. large deck on back of house for family entertainment. Annual flowers that bloom makes this place stand out. Stove top and refrigerator stays. The front porch area is perfect for adding a swing or catching the evening breeze. There is an in-law suite made in a separate structure located in back yard. Nice shed for extra storage is included.
-
2026-05-10historical $1,700
-
2026-05-03$1,700
-
2026-04-20$250,000 New 499-char remark
Show marketing remark (499 chars)
Greater starter home for large family looking for extra space. Home has 4 bedrooms and 2.5 baths and nice updated kitchen with beautiful tile flooring. large deck on back of house for family entertainment. Annual flowers that bloom makes this place stand out. Stove top and refrigerator stays. The front porch area is perfect for adding a swing or catching the evening breeze. There is an in-law suite made in a separate structure located in back yard. Nice shed for extra storage is included.
-
2016-10-16historical
-
2016-10-16historical
-
2016-07-15$95,000 New
-
2016-07-15$95,000 Active
-
2010-10-01historical
-
2010-09-30soldstatus $24,000 Sold
-
2010-09-14status Pending
-
2010-09-09historical Contingent - Other
-
2010-08-26status Active
-
2010-07-27status Pending
-
2010-07-22historical Contingent - Other
-
2010-07-07price $24,900
-
2010-07-06price $24,900
-
2010-06-23status Active
-
2010-05-27status Pending
-
2010-05-20historical Contingent - Other
-
2010-04-26$29,900 Active
-
2007-12-05soldstatus $92,000
-
2005-12-07soldstatus $145,000
-
2005-12-07soldstatus $145,000
-
2004-06-01soldstatus $125,000
-
1975-06-02soldstatus $68,000
ⓘ Source: listings_history table (triggers on properties + properties_extension) + one-shot
backfill from property_details.listing_events for pre-trigger history.
Tax reassessment forecast GA · Resets to sale price
- Current annual tax
- $2,558 · $213/mo
- Projected year-2 tax
- $2,558 · $213/mo
- Expected delta
- $0/yr ($0/mo · 0.0%)
ⓘ Screening estimate from a state-policy table — verify with the county assessor before closing.
Climate risk First Street
- Flood 1/10 Low FEMA zone X (unshaded) · 0% chance over 30 yrs
- Wildfire 2/10 Low
- Heat 6/10 Major 7 d/yr ≥105°F today · 19 d/yr by 30 yrs out
- Wind 6/10 Major 27% chance of damaging wind over 30 yrs
- Air quality 4/10 Moderate 5 unhealthy d/yr today · 6 by 30 yrs out
Nearby sold comps map
Loading sold comps map…
Walkable amenities ~0.75 mi
Loading nearby amenities…
Taxation est. · year 1
- Rental income
- $22,846
- − Mortgage interest
- −$13,444
- − Property taxes
- −$2,558
- − Insurance
- −$1,200
- − Repairs & maintenance
- −$1,828
- − Management
- −$1,828
- − Depreciation
- −$6,982
- Taxable loss
- −$4,993
- Est. tax savings @ 24.0%
- +$1,198
- After-tax cash flow
- $385/yr
For passive investors: Depreciation is non-cash, so a rental often shows a tax loss while cash-flowing — sheltering income. Rental losses are passive: they offset passive income freely, and up to $25,000/yr can offset ordinary (W-2) income if you actively participate and your MAGI is under $100k (phasing out to $0 by $150k); unused losses carry forward. On sale, claimed depreciation is recaptured at up to 25%, and gains may owe capital-gains tax (a 1031 exchange can defer both). Figures are a year-1 estimate at your 24.0% rate — not tax advice; consult a CPA.
Schools (NCES district)
- District
- Clayton County
- NCES district ID
- 1301230
- Math proficiency
- 11% ▼ -13.00%
- Reading proficiency
- 20% ▼ -9.00%
- Median HH income
- $42,266
- Composite
- 13.41/100
- National rank
- #9527
- State rank
- #155 of 174 in GA
Livability — Bonanza
- Score
- 62/100
- State rank
- #314
- US rank
- #16994
Category grades
Schools grade is shown separately in the Schools card above.
Census & demographics
- Census place
- Bonanza, GA
- County
- Clayton County · 230,153 people
- Metro
- Atlanta-Sandy Springs-Alpharetta, GA
- Population (ZIP)
- 43,191
- Household income
- $62,185
- Rent vs Own
- Severe rent burden
- 1992.0
Population outlook (Clayton County) Hauer SSP2
- Today (2025)
- 310,777 people
- By 2030
- 329,762 · +6.1%
- By 2040
- 368,052 · +18.4%
- By 2050
- 401,196 · +29.1%
- By 2075
- 472,488 · +52.0%
- By 2100
- 500,446 · +61.0%
Race, ethnicity, and origin ACS 2023
- Neighborhood character
- Predominantly Black (71%)
- Race & ethnicity
- Black 71% Hispanic / Latino 17% White 7% Two or more races 7%
- Hispanic origin (detail)
- Mexican 13% Puerto Rican 2%
- Foreign-born
- 11% · Canada, United Kingdom
- Languages at home
- 83% English-only · Spanish 14% French/Haitian/Cajun 1%
Political lean MEDSL · Clayton
- 2024 margin
- Solid D (+69.2) · D 84.3% · R 15.1%
- 2008→2024 swing
- +2.8pp toward D · 2008: 66.4pp · 2024: 69.2pp
- All cycles
- 2024: D+69.2 2020: D+70.9 2016: D+71.9 2012: D+70.1 2008: D+66.4
Not yet ingested
- Civics
- —
Market trends
- HPI YoY
- ▼ -105.48%
- Current HPI
- 211.6309
- Rent YoY
- ▲ 2.06%
- Metro
- Atlanta-Sandy Springs-Alpharetta, GA
- State GDP YoY
- ▲ 2.66%
- F500 in state
- 28
Industry mix (Fortune 500 HQ in GA)
| Industry | F500 HQs | Revenue |
|---|---|---|
| Paper / Packaging | 2 | $29B |
|
||
| Retail | 1 | $160B |
|
||
| Transportation / Logistics | 1 | $91B |
|
||
| Airlines | 1 | $62B |
|
||
| Consumer Goods | 1 | $47B |
|
||
| Utilities | 1 | $25B |
|
||
Price history
+266.2% since first listed26 events — show timeline
- 2026-05-15 Price Changed $249,000 GAMLS
- 2026-05-10 Rental Removed $1,700 Avail
- 2026-05-03 Listed for Rent $1,700 Avail
- 2026-04-20 Listed $250,000 GAMLS
- 2016-10-16 Listing Removed — GAMLS
- 2016-10-16 Listing Removed — FMLS
- 2016-07-15 Listed $95,000 GAMLS
- 2016-07-15 Listed $95,000 FMLS
- 2010-10-01 Listing Removed — FMLS
- 2010-09-30 Sold (MLS) $24,000 FMLS
- 2010-09-14 Pending — FMLS
- 2010-09-09 Contingent — FMLS
- 2010-08-26 Relisted — FMLS
- 2010-07-27 Pending — FMLS
- 2010-07-22 Contingent — FMLS
- 2010-07-07 Price Changed $24,900 GAMLS
- 2010-07-06 Price Changed $24,900 FMLS
- 2010-06-23 Relisted — FMLS
- 2010-05-27 Pending — FMLS
- 2010-05-20 Contingent — FMLS
- 2010-04-26 Listed $29,900 FMLS
- 2007-12-05 Sold (Public Records) $92,000 Public Records
- 2005-12-07 Sold (Public Records) $145,000 Public Records
- 2005-12-07 Sold (Public Records) $145,000 Public Records
- 2004-06-01 Sold (Public Records) $125,000 Public Records
- 1975-06-02 Sold (Public Records) $68,000 Public Records
Property tax history
+3.2%/yrLatest (2025): $2,558 · -4.6% YoY. Source: county tax records.
Cash-flow waterfall
monthlySold comps — $/sqft
last 12 mo · ≤1 miLoading sold comps…