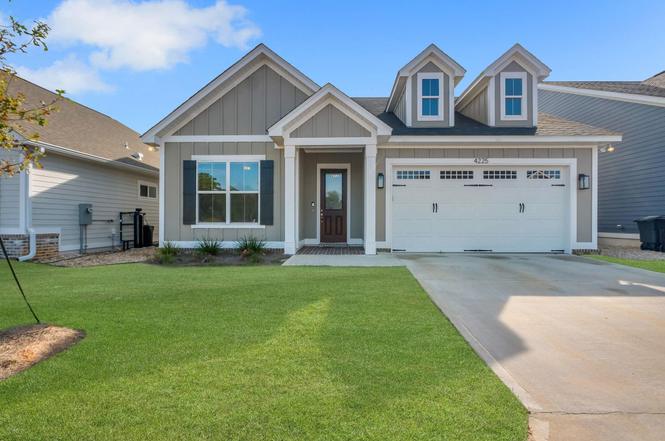
4225 Landry Ln · Tallahassee, FL
Flood risk No data
- FEMA flood zone
- —
- Chance of flooding over 30 yrs
- —
- Est. flood insurance / yr
- —
Fire risk No data
- Est. fire insurance / yr
- —
Heat risk No data
- Hot days now (above threshold)
- —
- Hot days in 30 yrs
- —
Wind risk No data
- Chance of severe wind over 30 yrs
- —
Air-quality risk No data
- Unhealthy air days now
- —
- Unhealthy air days in 30 yrs
- —
Risk factors via First Street. Map © Google.
Why this score? — see what drove the F grade
The composite is a weighted blend of 9 inputs, each scored 0–100. Each bar is that input's sub-score; the figure is the points it added to the 100-point composite (weight × sub-score).
- Cash flow +8.1/30.0
- ARV discount +7.5/15.0
- Schools +4.3/10.0
- Livability +4.3/5.0
- Rent growth +2.5/5.0
- Condition / age +2.5/5.0
- DSCR +2.1/10.0
- 1% rule +1.6/10.0
- Appreciation +0.0/10.0
$459,900
🖨 Deal sheet 📄 Offer letter ✓ Due diligence
Listing remarks MLS
Stunning 4-Bedroom, 2-Bath Oxford Model in Fallschase, Tallahassee’s Most Sought After Affordable NE New Home Community! This 1,730 sq ft home boasts an open floor plan, 10’ ceilings, hardwood floors throughout, granite countertops, a farmhouse sink, and numerous custom features you’ll love! With our preferred lenders, you may qualify for closing cost assistance or an interest rate buy-down. Note: Photos shown are of a previous model and may include features not available in this unit. For details, refer to the Standard Features Sheet. Visit Our Furnished Sales Model Open Hours: • Wednesday & Friday: 1-5 PM • Saturday & Sunday: 12-5 PM Location: 204 Tulane Way
Key facts
- Custom cabinetry
- Open floor plan
- Farmhouse sink
Tags
Property features AI
Finance
- Financial info: Property is for sale
- HOA & community: HOA fee of $330 (includes common areas); Street lights and sidewalks in the community
Exterior
- Parking: Attached garage with 2 spaces
- Security: Security details not provided
- Utilities: Public sewer
- Home design: Single-story home
- Construction: Brick and fiber cement exterior
- Exterior features: Covered porch
Interior
- Kitchen: Dishwasher; Disposal; Icemaker; Microwave; Oven; Range; Refrigerator; Pantry (kitchen storage)
- Bedrooms: Bedroom 2 (12x11); Bedroom 3 (12x11); Bedroom 4 (12x11)
- Flooring: Carpet; Engineered hardwood; Tile
- Bathrooms: 2 full bathrooms
- Heating & cooling: Central heating and cooling; Electric heating; Heat pump (heating and cooling); Fireplace(s) contribute to heating; Ceiling fan(s)
- Interior features: Tray ceilings and vaulted ceilings; High ceilings; Entrance foyer; Pantry; Split bedroom floorplan; Walk-in closet(s); Stall shower
- Laundry & utility: Laundry/utility details not provided
Neighborhood map
What this means for you Summary
Snapshot
- This is a 4-bed/2.0-bath land listed at $460k.
Deal economics
- At list price, monthly cash flow is $-451 ($-5k/yr) — negative.
- To cash-flow at today's rent, offer at most $380k (17.3% below list).
- To meet the 1% rule (rent ≥ 1% of price), the offer needs to be $302k (34.3% below list).
- Recommended offer: $302k (34.3% below list) — sets the bar for 1% rule.
- Cap rate 5.1% vs local median 4.2% in Tallahassee — meaningfully above typical; check what's discounted (condition, days-on-market, listing class) to confirm the premium yield is real.
Location & tenants
- Location reads 86/100 on livability (#19 in FL, #429 nationally) — a professional / high-income tenant draw. Strengths: amenities A+, commute A+, health & safety A+; Watch: employment D.
- Leon (urban): math 48% / reading 53% proficiency, ranked #33 of 73 in FL (top 45%) — acceptable for families but not a draw, mixed tenant base, ~2y average lease.
- Market conditions: 91 active listings in the ZIP; 1 comparable units currently listed for rent nearby; high-income renter base; 1,765 units permitted in Leon County in 2024 (975 in 5+ unit buildings).
Forward outlook
- Local home prices are declining (-3.0%/yr); year-one equity from $3k of loan paydown is wiped out by about $14k of value loss. Plan a longer hold.
- Leon County population projected at +23% by 2050 — long-run rental-demand tailwind backs the buy-and-hold thesis.
Negotiation context
- It's been on market 129 days — a 12% lower offer ($405k) is reasonable based on typical stale-listing flexibility.
- 3 sale attempts with the ask held roughly flat each time — persistent listings suggest the price (not the market) is what's stuck; bring a comps-based counter.
Questions for the listing agent
- What do current leases actually rent for vs. the listed asking? Can we see a recent rent roll and the last 12 months of T-12 income?
- It's been on market 129 days. Have you received any prior offers? Is the seller open to a 34% concession, seller financing, or rate buy-down credit?
- What does the HOA fee cover, when was the last increase, and are there any pending special assessments or reserve-fund shortfalls?
- Why hasn't it sold? Are there any deal-killer items the seller is aware of (foundation, flood, title, zoning, code violations)?
- Is there a deadline driving the sale (1031 exchange, divorce, estate, relocation)? That informs how much negotiation room exists.
- Schools are B-rated — typically a magnet for longer-tenancy family renters. What's the average tenant stay here, and is there a school-zone premium baked into asking?
- The area grade is low — what's the realistic commute time and amenity access for the typical tenant pool here? Any planned neighborhood developments (good or bad) we should know about?
- What's the average days-on-market for RENTAL listings here right now (not sales)? A rising rental-DOM trend means longer vacancies and softer asking-rent achievability than the comps imply.
- What's the recent tenant-quality profile in this submarket — average credit score on applications, eviction rate, late-payment / NSF rate, and stable-employment percentage? A property-management company in the area should have these aggregated.
- How much new for-sale + rental construction is in the pipeline within 1–3 miles? Heavy new supply typically softens prices + rents 12–24 months out; constrained supply supports both.
Investment metrics
- 1% rule
- 0.66% ✗
- Cap rate
- 5.12%
- Cash-on-cash
- -4.20%
- DSCR
- 0.81
- GRM
- 12.7
CMA / ARV
No comps found within radius.
Projected returns pro-forma
-3.0% appreciation · 3.0% rent growth · sell at horizon
- IRR
- -23.4%
- Equity multiple
- 0.20×
- Total profit
- $-103,397
- Equity at exit
- $68,573
- IRR
- -18.4%
- Equity multiple
- 0.01×
- Total profit
- $-127,669
- Equity at exit
- $39,764
Cash invested: $128,772 (down + closing). Projections, not guarantees.
Landlord ↔ Tenant lean methodology
- Overall (STATE)
- 87 Strongly Landlord-Friendly
- State Florida
- 87 Strongly Landlord-Friendly · R+3
- County
- — inherits STATE
- City
- — inherits STATE
ZIP-level market 32317
- Home prices YoY
- -26.5%
- Active inventory
- 91
- Price-to-rent
- 12.7×
Monthly cashflow live
- Estimated rent
- $3,022 medium interval (Pro) →
- Mortgage (P&I)
- −$2,412
- Tax from tax record
- −$206 /mo · $2,477/yr
- Insurance
- −$192
- HOA
- −$28
- Vacancy / Maint / Mgmt
- −$635
- Net cashflow
- $-451
Break-even live
UW: 25.0% down · 7.5% · 30yr · 1.5% tax · 5.0% vac · 8.0% maint · 8.0% mgmt
Financing live
Cash to close
- Down payment
- $114,975
- Closing costs
- $13,797
- Reserves months
- —
- Total cash needed
- —
Loan-product check · same deal, 3 products live
Conventional
25% down · 7.5% · 30yr
- Down + closing
- —
- Monthly P&I
- —
- Monthly cashflow
- —
- DSCR
- —
- Eligible?
- —
Personal DTI + credit; lowest rate.
DSCR
20% down · 8.5% · 30yr
- Down + closing
- —
- Monthly P&I
- —
- Monthly cashflow
- —
- DSCR
- —
- Eligible?
- —
No personal income docs; deal must DSCR.
Hard money
10% down · 12.0% · 12mo
- Down + closing
- —
- Monthly P&I
- —
- Monthly cashflow
- —
- DSCR
- —
- Eligible?
- —
Short-term bridge; refi at stabilization.
Rent comps 1 comps
| Address | Beds | Baths | Sqft | Rent | $/sqft | DOM | Units | Dist |
|---|---|---|---|---|---|---|---|---|
| 308 Dahlonega Dr Tallahassee, FL | 4.0 | 3.0 | 1881 | $3,600 | $1.91 | 21d | 1 | 0.81mi |
HOA detail
- Monthly dues
- $28 · $336/yr
Listing history 21 events
-
2026-06-18pricedays on market $459,900 Active 129 DOM
-
2026-06-17days on market $464,000 Active 128 DOM
-
2026-06-16days on market $464,000 Active 127 DOM
-
2026-06-15days on market $464,000 Active 126 DOM
-
2026-06-14days on market $464,000 Active 124 DOM
-
2026-06-10days on market $464,000 Active 121 DOM
-
2026-06-09days on market $464,000 Active 120 DOM
-
2026-06-08days on market $464,000 Active 119 DOM
-
2026-06-07days on market $464,000 Active 118 DOM
-
2026-06-05days on market $464,000 Active 115 DOM
-
2026-06-03days on market $464,000 Active 114 DOM
-
2026-06-02days on market $464,000 Active 113 DOM
-
2026-06-01days on market $464,000 Active 112 DOM
-
2026-05-31days on market $464,000 Active 111 DOM
-
2026-05-30days on market $464,000 Active 110 DOM
-
2026-02-23price $464,000
-
2026-02-09$465,000 Active
-
2026-02-09historical
-
2025-11-10$465,000 Active
-
2025-05-22soldstatus $458,070 Closed 712-char remark
Show marketing remark (712 chars)
Stunning 4-Bedroom, 2-Bath Oxford Model in Fallschase, Tallahassee’s Most Sought After Affordable NE New Home Community! This 1,730 sq ft home boasts an open floor plan, 10’ ceilings, hardwood floors throughout, granite countertops, a farmhouse sink, and numerous custom features you’ll love! With our preferred lenders, you may qualify for closing cost assistance or an interest rate buy-down. Note: Photos shown are of a previous model and may include features not available in this unit. For details, refer to the Standard Features Sheet. Visit Our Furnished Sales Model Open Hours: • Wednesday & Friday: 1-5 PM • Saturday & Sunday: 12-5 PM Location: 204 Tulane Way
-
2025-05-22$458,070 Active 712-char remark
Show marketing remark (712 chars)
Stunning 4-Bedroom, 2-Bath Oxford Model in Fallschase, Tallahassee’s Most Sought After Affordable NE New Home Community! This 1,730 sq ft home boasts an open floor plan, 10’ ceilings, hardwood floors throughout, granite countertops, a farmhouse sink, and numerous custom features you’ll love! With our preferred lenders, you may qualify for closing cost assistance or an interest rate buy-down. Note: Photos shown are of a previous model and may include features not available in this unit. For details, refer to the Standard Features Sheet. Visit Our Furnished Sales Model Open Hours: • Wednesday & Friday: 1-5 PM • Saturday & Sunday: 12-5 PM Location: 204 Tulane Way
ⓘ Source: listings_history table (triggers on properties + properties_extension) + one-shot
backfill from property_details.listing_events for pre-trigger history.
Tax reassessment forecast FL · Resets to sale price
- Current annual tax
- $2,477 · $206/mo
- Projected year-2 tax
- $3,817 · $318/mo
- Expected delta
- +$1,340/yr (+$112/mo · 54.1%)
ⓘ Screening estimate from a state-policy table — verify with the county assessor before closing.
Nearby sold comps map
Loading sold comps map…
Walkable amenities ~0.75 mi
Loading nearby amenities…
Taxation est. · year 1
- Rental income
- $36,259
- − Mortgage interest
- −$25,762
- − Property taxes
- −$2,477
- − Insurance
- −$2,300
- − Repairs & maintenance
- −$2,901
- − Management
- −$2,901
- − HOA
- −$336
- − Depreciation
- −$13,379
- Taxable loss
- −$13,796
- Est. tax savings @ 24.0%
- +$3,311
- After-tax cash flow
- $-2,098/yr
For passive investors: Depreciation is non-cash, so a rental often shows a tax loss while cash-flowing — sheltering income. Rental losses are passive: they offset passive income freely, and up to $25,000/yr can offset ordinary (W-2) income if you actively participate and your MAGI is under $100k (phasing out to $0 by $150k); unused losses carry forward. On sale, claimed depreciation is recaptured at up to 25%, and gains may owe capital-gains tax (a 1031 exchange can defer both). Figures are a year-1 estimate at your 24.0% rate — not tax advice; consult a CPA.
Schools (NCES district)
- District
- Leon
- NCES district ID
- 1201110
- Math proficiency
- 48% ▼ -13.00%
- Reading proficiency
- 53% ▼ -5.00%
- Median HH income
- $46,339
- Composite
- 42.84/100
- National rank
- #3131
- State rank
- #33 of 73 in FL
Livability — Tallahassee
- Score
- 86/100
- State rank
- #19
- US rank
- #429
Category grades
Schools grade is shown separately in the Schools card above.
Census & demographics
- County
- Leon County · 294,472 people
- City population
- 294,472
- Metro
- Tallahassee, FL
- Population (ZIP)
- 14,654
- Household income
- $128,690
- Rent vs Own
- Severe rent burden
- 143.0
Population outlook (Leon County) Hauer SSP2
- Today (2025)
- 315,507 people
- By 2030
- 330,677 · +4.8%
- By 2040
- 358,465 · +13.6%
- By 2050
- 386,804 · +22.6%
- By 2075
- 465,480 · +47.5%
- By 2100
- 519,959 · +64.8%
Race, ethnicity, and origin ACS 2023
- Neighborhood character
- Predominantly White (67%)
- Race & ethnicity
- White 67% Black 15% Hispanic / Latino 8% Two or more races 7% Asian 7%
- Hispanic origin (detail)
- Mexican 1% Puerto Rican 3% Cuban 1%
- Common ancestry
- Slovak 4% Lithuanian 2% Italian 2%
- Foreign-born
- 8% · Canada, China, South Korea
- Languages at home
- 89% English-only · Spanish 5% Other Asian/Pacific 3% Other Indo-European 2%
Political lean MEDSL · Leon
- 2024 margin
- Strong D (+21.8) · D 60.3% · R 38.5% · Other 1.2%
- 2008→2024 swing
- -2.5pp toward R · 2008: 24.3pp · 2024: 21.8pp
- All cycles
- 2024: D+21.8 2020: D+28.3 2016: D+25.1 2012: D+23.6 2008: D+24.3
Not yet ingested
- Civics
- —
Market trends
- HPI YoY
- ▼ -88.81%
- Current HPI
- 246.3858
- Rent YoY
- —
- Metro
- Tallahassee, FL
- State GDP YoY
- ▲ 3.28%
- F500 in state
- 36
Industry mix (Fortune 500 HQ in FL)
| Industry | F500 HQs | Revenue |
|---|---|---|
| Industrial Technology | 2 | $29B |
|
||
| Insurance | 2 | $17B |
|
||
| Retail | 1 | $60B |
|
||
| Technology Distribution | 1 | $58B |
|
||
| Homebuilding | 1 | $35B |
|
||
| Technology Manufacturing | 1 | $35B |
|
||
Price history
+1.3% since first listed6 events — show timeline
- 2026-02-23 Price Changed $464,000 CATRS
- 2026-02-09 Listing Removed — CATRS
- 2026-02-09 Listed $465,000 CATRS
- 2025-11-10 Listed $465,000 CATRS
- 2025-05-22 Listed $458,070 CATRS
- 2025-05-22 Sold (MLS) $458,070 CATRS
Property tax history
+107.8%/yrLatest (2025): $2,477 · +107.8% YoY. Source: county tax records.
Cash-flow waterfall
monthlySold comps — $/sqft
last 12 mo · ≤1 miLoading sold comps…