 🏷️ Likely Rental
25 E Delmar Mdws · Wellsboro, PA
Flood risk 6/10 · Moderate
- FEMA flood zone
- X (unshaded)
- Chance of flooding over 30 yrs
- 0.71%
- Est. flood insurance / yr
- $507 – $1,088
Fire risk 3/10 · Minor
- Est. fire insurance / yr
- $511 – $949
Heat risk 3/10 · Minor
- Hot days now (above 89°F)
- 8 days/yr
- Hot days in 30 yrs
- 18 days/yr
Wind risk 2/10 · Minimal
- Chance of severe wind over 30 yrs
- —
Air-quality risk 1/10 · Minimal
- Unhealthy air days now
- 0 days/yr
- Unhealthy air days in 30 yrs
- 0 days/yr
Risk factors via First Street. Map © Google.
Why this score? — see what drove the A- grade
The composite is a weighted blend of 9 inputs, each scored 0–100. Each bar is that input's sub-score; the figure is the points it added to the 100-point composite (weight × sub-score).
- Cash flow +30.0/30.0
- 1% rule +10.0/10.0
- DSCR +10.0/10.0
- Appreciation +10.0/10.0
- ARV discount +7.5/15.0
- Schools +4.1/10.0
- Livability +3.8/5.0
- Rent growth +2.5/5.0
- Condition / age +2.5/5.0
$52,900
🖨 Deal sheet (PDF) 📄 Offer letter ✓ Due diligence
Listing remarks MLS
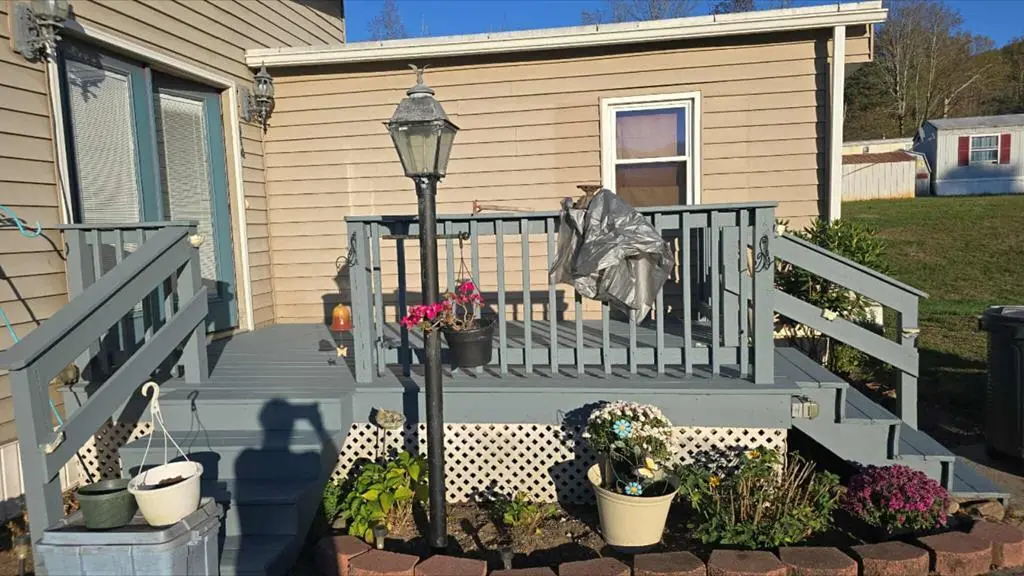
This very well maintained home is in a mobile home park just outside of Wellsboro. This home features 2-3 bedrooms, two bathrooms, and lots of storage! Outside there is a huge deck for entertaining or relaxing. Lot rent is $330 per month
Key facts
- Huge deck
- Built 1973
- Listed 83 days
Tags
Neighborhood map
What this means for you Summary
Snapshot
- This is a 3-bed/2.0-bath manufactured listed at $53k.
Deal economics
- At list price, monthly cash flow is $813 ($10k/yr) — positive.
- The deal already cash-flows at list — no discount required.
- Meets the 1% rule at list price ($1k rent vs $53k).
- Recommended offer: $50k (6.0% below list) — sets the bar for market timing.
Location & tenants
- Location reads 75/100 on livability (#426 in PA, #3,882 nationally) — a middle-class / working-renter tenant base. Strengths: crime A+, cost of living A+, health & safety A+; Watch: amenities F, commute F, employment D-.
- Wellsboro Area SD (rural): math 37% / reading 58% proficiency, ranked #230 of 539 in PA (top 43%) — families likely to look elsewhere, expect single-tenant / working-renter base with shorter leases.
- Zoned schools: Don Gill El Sch (math 33% / reading 51%, grade F, #883 of 1,518 statewide, top 61%, 318 students, 55% FRL); Rock L Butler Ms (math 32% / reading 61%, grade D+, #172 of 512 statewide, top 35%, 480 students, 50% FRL); Wellsboro Area Hs (math 77%, 439 students, 45% FRL) — zoned schools average 50% FRL vs 31% district-wide (20 pts higher); higher-poverty schools than district average — tighter screening recommended.
- Market conditions: 35 active listings in the ZIP; 32 units permitted in Tioga County in 2024 (0 in 5+ unit buildings).
Forward outlook
- In year one you build about $6k of equity ($366 loan paydown + $5k appreciation (10.0% local appreciation)).
- Tioga County population projected at -20% by 2050 — secular population decline; favor cash flow + early exit over multi-decade hold.
- At projected returns (10.0% appreciation + 3.0% rent growth), your $15k cash investment doubles in ~1 year — after that, you're playing with house money.
- By year 6, paydown + projected appreciation supports a ~$33k cash-out refi (75% LTV) — recoverable capital for the next deal without selling this one.
Negotiation context
- It's been on market 83 days — a 6% lower offer ($50k) is reasonable based on typical stale-listing flexibility.
- 3 sale attempts since 7y ago with the ask held roughly flat each time — persistent listings suggest the price (not the market) is what's stuck; bring a comps-based counter.
- Current owner paid $27k; list at $53k implies a 96% gain — meaningful room to come down on a strong offer.
Risks & watch-outs
- Climate carrying-cost: major flood risk — expect insurance premiums to compound above CPI over the hold.
Questions for the listing agent
- It's been on market 83 days. Have you received any prior offers? Is the seller open to a 6% concession, seller financing, or rate buy-down credit?
- Built in 1973 — when were the roof, HVAC, electrical panel, plumbing, and water heater last replaced?
- Why hasn't it sold? Are there any deal-killer items the seller is aware of (foundation, flood, title, zoning, code violations)?
- Is there a deadline driving the sale (1031 exchange, divorce, estate, relocation)? That informs how much negotiation room exists.
- Schools are A-rated — typically a magnet for longer-tenancy family renters. What's the average tenant stay here, and is there a school-zone premium baked into asking?
- What's the average days-on-market for RENTAL listings here right now (not sales)? A rising rental-DOM trend means longer vacancies and softer asking-rent achievability than the comps imply.
- What's the recent tenant-quality profile in this submarket — average credit score on applications, eviction rate, late-payment / NSF rate, and stable-employment percentage? A property-management company in the area should have these aggregated.
- How much new for-sale + rental construction is in the pipeline within 1–3 miles? Heavy new supply typically softens prices + rents 12–24 months out; constrained supply supports both.
Investment metrics
- 1% rule
- 2.73% ✓
- Cap rate
- 24.73%
- Cash-on-cash
- 65.83%
- DSCR
- 3.93
- GRM
- 3.1
CMA / ARV
- ARV (median comp)
- $225,566
- List price
- $52,900
- Delta
- -76.55%
- Verdict
- UNDERPRICED
- Comps
- 1 within 2.0 mi
Show comp detail 1 sale within ~0.75 mi
| Address | Dist | Beds/Ba | Sqft | Sold | Price | $/sf | Match |
|---|---|---|---|---|---|---|---|
| 3 E Delmar Mdws | 0.12mi | 2/2.0 (-1) | 1,104 (-8%) | 20mo | $19,500 | $18 | 59 |
Match score weights: distance 35% · size 25% · config 20% · recency 20%. Top-matched comps best support the ARV.
Projected returns pro-forma
10.0% appreciation · 3.0% rent growth · sell at horizon
- IRR
- 77.3%
- Equity multiple
- 6.44×
- Total profit
- $80,563
- Equity at exit
- $47,657
- IRR
- 71.4%
- Equity multiple
- 14.27×
- Total profit
- $196,540
- Equity at exit
- $102,773
Cash invested: $14,812 (down + closing). Projections, not guarantees.
Landlord ↔ Tenant lean methodology
- Overall (STATE)
- 62 Landlord-Friendly
- State Pennsylvania
- 62 Landlord-Friendly · EVEN
- County
- — inherits STATE
- City
- — inherits STATE
ZIP-level market 16901
- Home prices YoY
- 4.6%
- Active inventory
- 35
- Price-to-rent
- 3.1×
Monthly cashflow live
- Estimated rent
- $1,442 medium interval (Pro) →
- Mortgage (P&I)
- −$277
- Tax from tax record
- −$27 /mo · $321/yr
- Insurance
- −$22
- HOA
- −$0
- Vacancy / Maint / Mgmt
- −$303
- Net cashflow
- $813
Break-even live
Sensitivity live
| Price | -10% $843 | -5% $828 | +0% $813 | +5% $798 | +10% $783 |
|---|---|---|---|---|---|
| Rent | -10% $699 | -5% $756 | +0% $813 | +5% $870 | +10% $926 |
| Rate | -1.0pp $839 | -0.5pp $826 | base $813 | +0.5pp $799 | +1.0pp $785 |
UW: 25.0% down · 7.5% · 30yr · 1.5% tax · 5.0% vac · 8.0% maint · 8.0% mgmt
Financing live
Cash to close
- Down payment
- $13,225
- Closing costs
- $1,587
- Reserves months
- —
- Total cash needed
- —
Loan-product check · same deal, 3 products live
Conventional
25% down · 7.5% · 30yr
- Down + closing
- —
- Monthly P&I
- —
- Monthly cashflow
- —
- DSCR
- —
- Eligible?
- —
Personal DTI + credit; lowest rate.
DSCR
20% down · 8.5% · 30yr
- Down + closing
- —
- Monthly P&I
- —
- Monthly cashflow
- —
- DSCR
- —
- Eligible?
- —
No personal income docs; deal must DSCR.
Hard money
10% down · 12.0% · 12mo
- Down + closing
- —
- Monthly P&I
- —
- Monthly cashflow
- —
- DSCR
- —
- Eligible?
- —
Short-term bridge; refi at stabilization.
Listing history 13 events
-
2026-06-09statusdays on market $52,900 Pending 83 DOM
-
2026-06-08days on market $52,900 Active Under Contract 82 DOM
-
2026-06-08days on market $52,900 Active Under Contract 81 DOM
-
2026-06-07days on market $52,900 Active Under Contract 80 DOM
-
2026-06-04days on market $52,900 Active Under Contract 77 DOM
-
2026-06-02days on market $52,900 Active Under Contract 76 DOM
-
2026-06-01days on market $52,900 Active Under Contract 75 DOM
-
2026-05-31days on market $52,900 Active Under Contract 74 DOM
-
2026-03-18$52,900 Active 237-char remark
Show marketing remark (237 chars)
This very well maintained home is in a mobile home park just outside of Wellsboro. This home features 2-3 bedrooms, two bathrooms, and lots of storage! Outside there is a huge deck for entertaining or relaxing. Lot rent is $330 per month
-
2021-01-18soldstatus $27,000 649-char remark
Show marketing remark (649 chars)
EXTREMELY WELL-MAINTAINED AND REMODELED single wide located on a rented lot in a quiet mobile home park approximately 15 minutes outside of Wellsboro. This 3-bedroom, 2-bath home has TONS of storage space, drywall throughout, a walk-in closet, and a great kitchen with a HUGE island. This would certainly make a fantastic starter home or appeal to someone looking for all first-floor living. Beautiful deck on the front of the home lends itself for relaxing and entertaining. Lot rent is $280 a month and application must be submitted to park owners. Pictures do not do it justice! This is a MUST SEE property! Call today to make your appointment!
-
2020-10-25$35,000 649-char remark
Show marketing remark (649 chars)
EXTREMELY WELL-MAINTAINED AND REMODELED single wide located on a rented lot in a quiet mobile home park approximately 15 minutes outside of Wellsboro. This 3-bedroom, 2-bath home has TONS of storage space, drywall throughout, a walk-in closet, and a great kitchen with a HUGE island. This would certainly make a fantastic starter home or appeal to someone looking for all first-floor living. Beautiful deck on the front of the home lends itself for relaxing and entertaining. Lot rent is $280 a month and application must be submitted to park owners. Pictures do not do it justice! This is a MUST SEE property! Call today to make your appointment!
-
2019-11-08soldstatus $32,000
-
2019-09-06$35,000
ⓘ Source: listings_history table (triggers on properties + properties_extension) + one-shot
backfill from property_details.listing_events for pre-trigger history.
Tax reassessment forecast PA · Partial reset (capped growth)
- Current annual tax
- $321 · $27/mo
- Projected year-2 tax
- $579 · $48/mo
- Expected delta
- +$257/yr (+$21/mo · 80.1%)
ⓘ Screening estimate from a state-policy table — verify with the county assessor before closing.
Climate risk First Street
- Flood 6/10 Major FEMA zone X (unshaded) · 71% chance over 30 yrs
- Wildfire 3/10 Moderate
- Heat 3/10 Moderate 8 d/yr ≥89°F today · 18 d/yr by 30 yrs out
- Wind 2/10 Low
- Air quality 1/10 Low 0 unhealthy d/yr today · 0 by 30 yrs out
Nearby sold comps map
Loading sold comps map…
Walkable amenities ~0.75 mi
Loading nearby amenities…
Taxation est. · year 1
- Rental income
- $17,298
- − Mortgage interest
- −$2,963
- − Property taxes
- −$321
- − Insurance
- −$264
- − Repairs & maintenance
- −$1,384
- − Management
- −$1,384
- − Depreciation
- −$1,539
- Taxable income
- $9,443
- Est. tax owed @ 24.0%
- −$2,266
- After-tax cash flow
- $7,485/yr
For passive investors: Depreciation is non-cash, so a rental often shows a tax loss while cash-flowing — sheltering income. Rental losses are passive: they offset passive income freely, and up to $25,000/yr can offset ordinary (W-2) income if you actively participate and your MAGI is under $100k (phasing out to $0 by $150k); unused losses carry forward. On sale, claimed depreciation is recaptured at up to 25%, and gains may owe capital-gains tax (a 1031 exchange can defer both). Figures are a year-1 estimate at your 24.0% rate — not tax advice; consult a CPA.
Schools (NCES district)
- District
- Wellsboro Area SD
- NCES district ID
- 4225170
- Math proficiency
- 37% ▼ -12.00%
- Reading proficiency
- 58% ▼ -15.00%
- Median HH income
- $48,861
- Composite
- 40.52/100
- National rank
- #3710
- State rank
- #230 of 539 in PA
Livability — Wellsboro
- Score
- 75/100
- State rank
- #426
- US rank
- #3882
Category grades
Schools grade is shown separately in the Schools card above.
Census & demographics
- City population
- 10,416
- Population (ZIP)
- 10,416
Population outlook (Tioga County) Hauer SSP2
- Today (2025)
- 40,253 people
- By 2030
- 38,795 · -3.6%
- By 2040
- 35,376 · -12.1%
- By 2050
- 32,081 · -20.3%
- By 2075
- 24,341 · -39.5%
- By 2100
- 17,180 · -57.3%
Race, ethnicity, and origin ACS 2023
- Neighborhood character
- Predominantly White (95%)
- Race & ethnicity
- White 95% Hispanic / Latino 2% Two or more races 2%
- Common ancestry
- Romanian 6% Slovak 2% Iranian 2%
- Foreign-born
- 3% · Canada
- Languages at home
- 96% English-only · Spanish 1% Chinese 1% German/W. Germanic 1%
Political lean MEDSL · Tioga
- 2024 margin
- Solid R (+51.8) · D 23.6% · R 75.4% · Other 1.0%
- 2008→2024 swing
- -24.3pp toward R · 2008: -27.4pp · 2024: -51.8pp
- All cycles
- 2024: R+51.8 2020: R+51.2 2016: R+53.6 2012: R+34.8 2008: R+27.4
Not yet ingested
- Civics
- —
Market trends
- HPI YoY
- ▲ 11.05%
- Current HPI
- 252.4252
- Rent YoY
- —
- Metro
- —
- State GDP YoY
- ▲ 1.68%
- F500 in state
- 34
Industry mix (Fortune 500 HQ in PA)
| Industry | F500 HQs | Revenue |
|---|---|---|
| Healthcare | 2 | $309B |
|
||
| Insurance | 2 | $27B |
|
||
| Telecommunications / Media | 1 | $124B |
|
||
| Industrial Distribution | 1 | $22B |
|
||
| Financial Services | 1 | $20B |
|
||
| Chemicals / Materials | 1 | $18B |
|
||
Price history
+51.1% since first listed5 events — show timeline
- 2026-03-18 Listed $52,900 NMPA
- 2021-01-18 Sold (MLS) $27,000 NMPA
- 2020-10-25 Listed $35,000 NMPA
- 2019-11-08 Sold (MLS) $32,000 NMPA
- 2019-09-06 Listed $35,000 NMPA
Property tax history
+11.1%/yrLatest (2026): $321 · +0.2% YoY. Source: county tax records.
Cash-flow waterfall
monthlySold comps — $/sqft
last 12 mo · ≤1 miLoading sold comps…