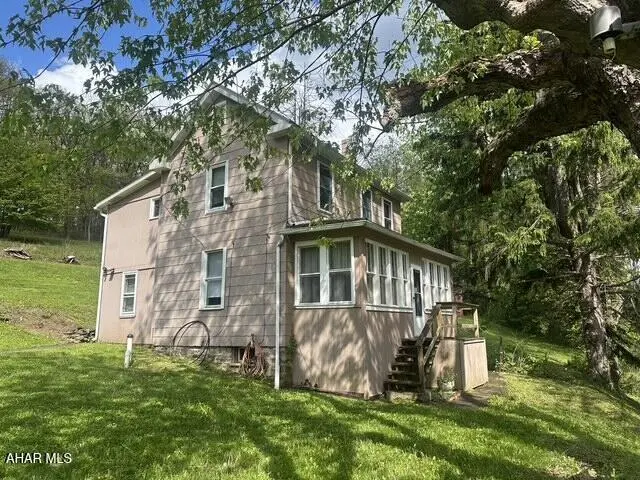
1788 Carson Valley Rd · Allegheny, PA
Flood risk 8/10 · Major
- FEMA flood zone
- X (unshaded)
- Chance of flooding over 30 yrs
- 0.79%
- Est. flood insurance / yr
- $507 – $1,088
Fire risk 1/10 · Minimal
- Est. fire insurance / yr
- $511 – $949
Heat risk 3/10 · Minor
- Hot days now (above 96°F)
- 7 days/yr
- Hot days in 30 yrs
- 18 days/yr
Wind risk 2/10 · Minimal
- Chance of severe wind over 30 yrs
- —
Air-quality risk 3/10 · Minor
- Unhealthy air days now
- 2 days/yr
- Unhealthy air days in 30 yrs
- 4 days/yr
Risk factors via First Street. Map © Google.
Why this score? — see what drove the D+ grade
The composite is a weighted blend of 9 inputs, each scored 0–100. Each bar is that input's sub-score; the figure is the points it added to the 100-point composite (weight × sub-score).
- ARV discount +15.0/15.0
- Cash flow +13.0/30.0
- Schools +4.6/10.0
- DSCR +3.9/10.0
- 1% rule +3.3/10.0
- Rent growth +2.5/5.0
- Livability +2.5/5.0
- Condition / age +2.5/5.0
- Appreciation +0.0/10.0
$169,900
🖨 Deal sheet (PDF) 📄 Offer letter ✓ Due diligence
Listing remarks
If you have always wanted to live in the country with some land to spread out, this Handy Man's Special is the property for you. Sturdy two car detached garage with electricity. Beautiful ground with so many possibilities.
Key facts
- Sturdy garage
- 7.3 acre lot
- 2 garage spots
Tags
Property features AI
Exterior
- Parking: 2-car garage
- Utilities: Private well water
- Home design: Single-family residence; Two levels; Fixer condition; Residential property in Carson Valley subdivision
- Construction: Shingle roof
- Exterior features: Shingle roof; Sloped lot; 7.3-acre lot
Interior
- Kitchen: Microwave; Range
- Flooring: Vinyl; Carpet
- Bathrooms: 1 full bathroom
- Heating & cooling: Forced air heating; Oil fuel
- Interior features: Microwave; Range; Vinyl and carpet flooring; Basement
Neighborhood map
What this means for you Summary
Snapshot
- This is a 3-bed/1.0-bath single-family listed at $170k.
Deal economics
- At list price, monthly cash flow is $-75 ($-897/yr) — negative.
- To cash-flow at today's rent, offer at most $157k (7.8% below list).
- To meet the 1% rule (rent ≥ 1% of price), the offer needs to be $141k (17.2% below list).
- Recommended offer: $141k (17.2% below list) — sets the bar for 1% rule.
Location & tenants
- Location reads: area grade D — affects rentability + tenant quality, not the cash-flow math above.
- Hollidaysburg Area SD (suburban): math 45% / reading 63% proficiency, ranked #129 of 539 in PA (top 24%) — acceptable for families but not a draw, mixed tenant base, ~2y average lease.
- Zoned schools: Charles W Longer El Sch (math 41% / reading 59%, grade D+, #645 of 1,518 statewide, top 43%, 395 students, 54% FRL); Hollidaysburg Area Jhs (math 36% / reading 61%, grade C-, #146 of 512 statewide, top 30%, 807 students, 41% FRL); Hollidaysburg Area Shs (math 67%, 793 students, 26% FRL).
- Market conditions: 92 active listings in the ZIP; 99 units permitted in Blair County in 2024 (0 in 5+ unit buildings).
Forward outlook
- Local home prices are declining (-3.0%/yr); year-one equity from $1k of loan paydown is wiped out by about $5k of value loss. Plan a longer hold.
- Blair County population projected at -18% by 2050 — secular population decline; favor cash flow + early exit over multi-decade hold.
Negotiation context
- It's been on market 37 days — a 3% lower offer ($165k) is reasonable based on typical stale-listing flexibility.
Risks & watch-outs
- Watch-outs: flood insurance adds $66/mo; built in 1916 — expect roof / HVAC / electrical / plumbing capex.
- Climate carrying-cost: severe flood risk — expect insurance premiums to compound above CPI over the hold.
Questions for the listing agent
- What do current leases actually rent for vs. the listed asking? Can we see a recent rent roll and the last 12 months of T-12 income?
- It's been on market 37 days. Have you received any prior offers? Is the seller open to a 17% concession, seller financing, or rate buy-down credit?
- Built in 1916 — when were the roof, HVAC, electrical panel, plumbing, and water heater last replaced?
- What's the actual annual flood-insurance premium (NFIP or private), and is the property in a SFHA with mandatory coverage?
- Is there a deadline driving the sale (1031 exchange, divorce, estate, relocation)? That informs how much negotiation room exists.
- The area grade is low — what's the realistic commute time and amenity access for the typical tenant pool here? Any planned neighborhood developments (good or bad) we should know about?
- What's the average days-on-market for RENTAL listings here right now (not sales)? A rising rental-DOM trend means longer vacancies and softer asking-rent achievability than the comps imply.
- What's the recent tenant-quality profile in this submarket — average credit score on applications, eviction rate, late-payment / NSF rate, and stable-employment percentage? A property-management company in the area should have these aggregated.
- How much new for-sale + rental construction is in the pipeline within 1–3 miles? Heavy new supply typically softens prices + rents 12–24 months out; constrained supply supports both.
Investment metrics
- 1% rule
- 0.83% ✗
- Cap rate
- 6.23%
- Cash-on-cash
- -0.21%
- DSCR
- 0.99
- GRM
- 10.1
CMA / ARV
- ARV (median comp)
- $255,176
- List price
- $169,900
- Delta
- -33.42%
- Verdict
- UNDERPRICED
- Comps
- 5 within 1.0 mi
Projected returns pro-forma
-3.0% appreciation · 3.0% rent growth · sell at horizon
- IRR
- -19.4%
- Equity multiple
- 0.32×
- Total profit
- $-32,266
- Equity at exit
- $25,333
- IRR
- -12.1%
- Equity multiple
- 0.28×
- Total profit
- $-34,113
- Equity at exit
- $14,690
Cash invested: $47,572 (down + closing). Projections, not guarantees.
Landlord ↔ Tenant lean methodology
- Overall (STATE)
- 62 Landlord-Friendly
- State Pennsylvania
- 62 Landlord-Friendly · EVEN
- County
- — inherits STATE
- City
- — inherits STATE
ZIP-level market 16635
- Home prices YoY
- -4.0%
- Active inventory
- 92
- Price-to-rent
- 10.1×
Monthly cashflow live
- Estimated rent
- $1,407 medium interval (Pro) →
- Mortgage (P&I)
- −$891
- Tax from tax record
- −$158 /mo · $1,899/yr
- Insurance
- −$71
- Flood insurance flood zone
- −$66 /mo · $798/yr
- HOA
- −$0
- Vacancy / Maint / Mgmt
- −$296
- Net cashflow
- $-75
Break-even live
Sensitivity live
| Price | -10% $21 | -5% $-27 | +0% $-75 | +5% $-123 | +10% $-171 |
|---|---|---|---|---|---|
| Rent | -10% $-186 | -5% $-130 | +0% $-75 | +5% $-19 | +10% $36 |
| Rate | -1.0pp $11 | -0.5pp $-32 | base $-75 | +0.5pp $-119 | +1.0pp $-164 |
UW: 25.0% down · 7.5% · 30yr · 1.5% tax · 5.0% vac · 8.0% maint · 8.0% mgmt
Financing live
Cash to close
- Down payment
- $42,475
- Closing costs
- $5,097
- Reserves months
- —
- Total cash needed
- —
Loan-product check · same deal, 3 products live
Conventional
25% down · 7.5% · 30yr
- Down + closing
- —
- Monthly P&I
- —
- Monthly cashflow
- —
- DSCR
- —
- Eligible?
- —
Personal DTI + credit; lowest rate.
DSCR
20% down · 8.5% · 30yr
- Down + closing
- —
- Monthly P&I
- —
- Monthly cashflow
- —
- DSCR
- —
- Eligible?
- —
No personal income docs; deal must DSCR.
Hard money
10% down · 12.0% · 12mo
- Down + closing
- —
- Monthly P&I
- —
- Monthly cashflow
- —
- DSCR
- —
- Eligible?
- —
Short-term bridge; refi at stabilization.
Listing history 19 events
-
2026-06-21days on market $169,900 Active 37 DOM
-
2026-06-19days on market $169,900 Active 35 DOM
-
2026-06-18days on market $169,900 Active 34 DOM
-
2026-06-17days on market $169,900 Active 33 DOM
-
2026-06-16days on market $169,900 Active 32 DOM
-
2026-06-15days on market $169,900 Active 31 DOM
-
2026-06-14days on market $169,900 Active 29 DOM
-
2026-06-13days on market $169,900 Active 28 DOM
-
2026-06-10days on market $169,900 Active 26 DOM
-
2026-06-09days on market $169,900 Active 25 DOM
-
2026-06-08days on market $169,900 Active 24 DOM
-
2026-06-07days on market $169,900 Active 23 DOM
-
2026-06-05days on market $169,900 Active 20 DOM
-
2026-06-03days on market $169,900 Active 19 DOM
-
2026-06-02pricedays on market $169,900 Active 18 DOM
-
2026-06-01days on market $180,000 Active 17 DOM
-
2026-05-31days on market $180,000 Active 16 DOM
-
2026-05-30days on market $180,000 Active 15 DOM
-
2026-05-15$180,000 Active 222-char remark
ⓘ Source: listings_history table (triggers on properties + properties_extension) + one-shot
backfill from property_details.listing_events for pre-trigger history.
Tax reassessment forecast PA · Partial reset (capped growth)
- Current annual tax
- $1,899 · $158/mo
- Projected year-2 tax
- $2,292 · $191/mo
- Expected delta
- +$393/yr (+$33/mo · 20.7%)
ⓘ Screening estimate from a state-policy table — verify with the county assessor before closing.
Climate risk First Street
- Flood 8/10 Severe FEMA zone X (unshaded) · 79% chance over 30 yrs
- Wildfire 1/10 Low
- Heat 3/10 Moderate 7 d/yr ≥96°F today · 18 d/yr by 30 yrs out
- Wind 2/10 Low
- Air quality 3/10 Moderate 2 unhealthy d/yr today · 4 by 30 yrs out
Nearby sold comps map
Loading sold comps map…
Walkable amenities ~0.75 mi
Loading nearby amenities…
Taxation est. · year 1
- Rental income
- $16,886
- − Mortgage interest
- −$9,517
- − Property taxes
- −$1,899
- − Insurance
- −$1,647
- − Repairs & maintenance
- −$1,351
- − Management
- −$1,351
- − Depreciation
- −$4,943
- Taxable loss
- −$3,821
- Est. tax savings @ 24.0%
- +$917
- After-tax cash flow
- $20/yr
For passive investors: Depreciation is non-cash, so a rental often shows a tax loss while cash-flowing — sheltering income. Rental losses are passive: they offset passive income freely, and up to $25,000/yr can offset ordinary (W-2) income if you actively participate and your MAGI is under $100k (phasing out to $0 by $150k); unused losses carry forward. On sale, claimed depreciation is recaptured at up to 25%, and gains may owe capital-gains tax (a 1031 exchange can defer both). Figures are a year-1 estimate at your 24.0% rate — not tax advice; consult a CPA.
Schools (NCES district)
- District
- Hollidaysburg Area SD
- NCES district ID
- 4211940
- Math proficiency
- 45% ▼ -9.00%
- Reading proficiency
- 63% ▼ -8.00%
- Median HH income
- $50,676
- Composite
- 46.1/100
- National rank
- #2511
- State rank
- #129 of 539 in PA
Livability — Allegheny
No livability data for this city. (Only ~50 U.S. cities are tracked.)
Census & demographics
- Population (ZIP)
- 12,115
Population outlook (Blair County) Hauer SSP2
- Today (2025)
- 121,571 people
- By 2030
- 117,966 · -3.0%
- By 2040
- 109,174 · -10.2%
- By 2050
- 99,542 · -18.1%
- By 2075
- 76,775 · -36.8%
- By 2100
- 54,326 · -55.3%
Race, ethnicity, and origin ACS 2023
- Neighborhood character
- Predominantly White (94%)
- Race & ethnicity
- White 94% Two or more races 3% Asian 2% Hispanic / Latino 2%
- Common ancestry
- Romanian 3% Slovak 2% Lithuanian 1%
- Foreign-born
- 2% · China
- Languages at home
- 96% English-only · Other Indo-European 2% Chinese 1% Spanish 1%
Political lean MEDSL · Blair
- 2024 margin
- Solid R (+43.5) · D 27.9% · R 71.4%
- 2008→2024 swing
- -19.2pp toward R · 2008: -24.3pp · 2024: -43.5pp
- All cycles
- 2024: R+43.5 2020: R+43.5 2016: R+46.4 2012: R+33.5 2008: R+24.3
Not yet ingested
- Civics
- —
Market trends
- HPI YoY
- ▼ -10.69%
- Current HPI
- 258.7396
- Rent YoY
- —
- Metro
- —
- State GDP YoY
- ▲ 1.68%
- F500 in state
- 34
Industry mix (Fortune 500 HQ in PA)
| Industry | F500 HQs | Revenue |
|---|---|---|
| Healthcare | 2 | $309B |
|
||
| Insurance | 2 | $27B |
|
||
| Telecommunications / Media | 1 | $124B |
|
||
| Industrial Distribution | 1 | $22B |
|
||
| Financial Services | 1 | $20B |
|
||
| Chemicals / Materials | 1 | $18B |
|
||
Price history
-5.6% since first listed2 events — show timeline
- 2026-06-02 Price Changed $169,900 AHARMLS
- 2026-05-15 Listed $180,000 AHARMLS
Property tax history
+7.1%/yrLatest (2025): $1,899 · +2.4% YoY. Source: county tax records.
Cash-flow waterfall
monthlySold comps — $/sqft
last 12 mo · ≤1 miLoading sold comps…