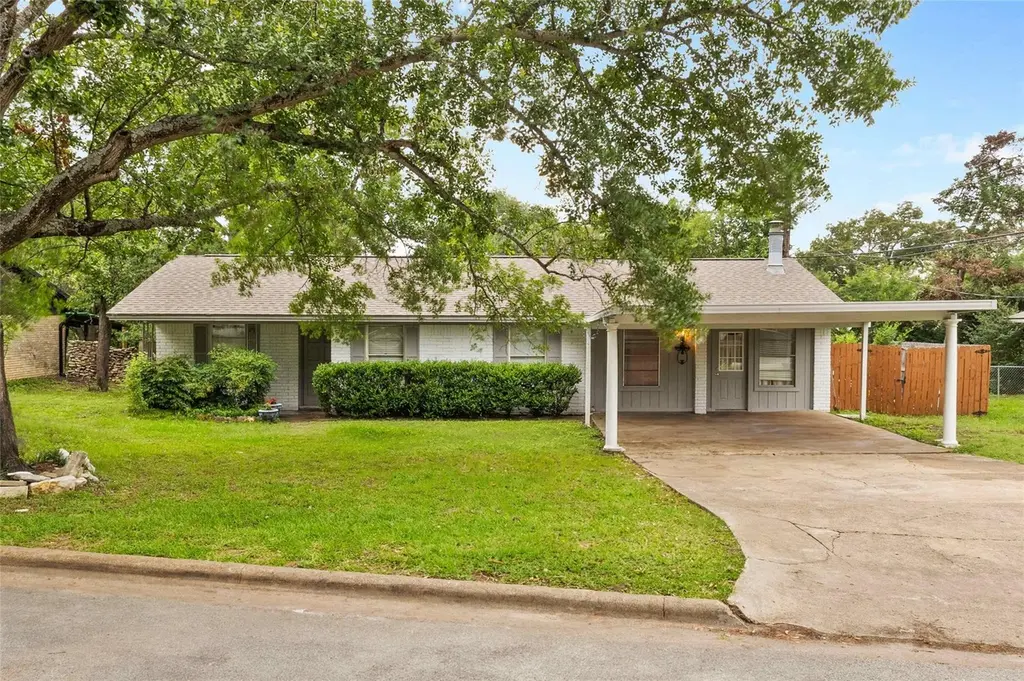
1101 Skrivanek Dr · Bryan, TX
Flood risk 1/10 · Minimal
- FEMA flood zone
- X (unshaded)
- Chance of flooding over 30 yrs
- 0.0%
- Est. flood insurance / yr
- $507 – $1,088
Fire risk 1/10 · Minimal
- Est. fire insurance / yr
- $1,222 – $2,270
Heat risk 8/10 · Major
- Hot days now (above 110°F)
- 7 days/yr
- Hot days in 30 yrs
- 24 days/yr
Wind risk 8/10 · Major
- Chance of severe wind over 30 yrs
- 80.0%
Air-quality risk 1/10 · Minimal
- Unhealthy air days now
- 0 days/yr
- Unhealthy air days in 30 yrs
- 0 days/yr
Risk factors via First Street. Map © Google.
Why this score? — see what drove the D grade
The composite is a weighted blend of 9 inputs, each scored 0–100. Each bar is that input's sub-score; the figure is the points it added to the 100-point composite (weight × sub-score).
- ARV discount +15.0/15.0
- Cash flow +8.1/30.0
- Livability +3.8/5.0
- 1% rule +3.1/10.0
- Rent growth +3.0/5.0
- Schools +2.6/10.0
- Condition / age +2.5/5.0
- DSCR +2.1/10.0
- Appreciation +0.0/10.0
$218,999
🖨 Deal sheet (PDF) 📄 Offer letter ✓ Due diligence
Listing remarks MLS
Great starter Home for a and/or potential of Renting out a few Rooms Spacious Backyard for family gatherings, close to Schools and Shopping Center New Roof 2020 Solar Panels Will be Included Schedule your appointment today!
Key facts
- Spacious backyard
- Solar panels
- New roof
Tags
Neighborhood map
What this means for you Summary
Snapshot
- This is a 3-bed/2.0-bath single-family listed at $219k.
Deal economics
- At list price, monthly cash flow is $-216 ($-3k/yr) — negative.
- To cash-flow at today's rent, offer at most $181k (17.4% below list).
- To meet the 1% rule (rent ≥ 1% of price), the offer needs to be $178k (18.8% below list).
- Recommended offer: $178k (18.8% below list) — sets the bar for 1% rule.
- Cap rate 5.1% vs local median 4.0% in Bryan — meaningfully above typical; check what's discounted (condition, days-on-market, listing class) to confirm the premium yield is real.
Location & tenants
- Location reads 76/100 on livability (#99 in TX, #3,341 nationally) — a middle-class / working-renter tenant base. Strengths: cost of living A+, housing A+, health & safety A+; Watch: schools C-, crime C-, amenities C-.
- Bryan ISD (urban): math 30% / reading 32% proficiency, ranked #608 of 826 in TX (top 74%) — families likely to look elsewhere, expect single-tenant / working-renter base with shorter leases; 68% free/reduced lunch — lower-income household profile, screen leases tightly.
- Market conditions: Rents rising (+1.8%/yr); 278 active listings in the ZIP; 24 comparable units currently listed for rent nearby; rentals at typical pace (median 22d on market — plan ~3-4 weeks tenant-placement turnaround); 42% of comp listings sitting > 30 days — soft ceiling on asking rent; 2,211 units permitted in Brazos County in 2024 (768 in 5+ unit buildings).
- This rent runs 30% of the median local income ($71k/yr) — at the standard rent-burdened threshold; future hikes will face affordability resistance.
Forward outlook
- Local home prices are declining (-3.0%/yr); year-one equity from $2k of loan paydown is wiped out by about $7k of value loss. Plan a longer hold.
- Brazos County population projected at +55% by 2050 — long-run rental-demand tailwind backs the buy-and-hold thesis.
Negotiation context
- It's been on market 303 days — a 12% lower offer ($193k) is reasonable based on typical stale-listing flexibility.
- 5 sale attempts since 12y ago; this cycle's ask has dropped $41k (16%) from the opening price — seller is motivated, your offer sets the floor, not the list.
Risks & watch-outs
- Climate carrying-cost: severe wind risk, 80% chance of damaging wind over 30y; extreme-heat days projected 7→24/yr by 2055 (HVAC capex compounding) — expect insurance premiums to compound above CPI over the hold.
Questions for the listing agent
- What do current leases actually rent for vs. the listed asking? Can we see a recent rent roll and the last 12 months of T-12 income?
- It's been on market 303 days. Have you received any prior offers? Is the seller open to a 19% concession, seller financing, or rate buy-down credit?
- Built in 1962 — when were the roof, HVAC, electrical panel, plumbing, and water heater last replaced?
- Why hasn't it sold? Are there any deal-killer items the seller is aware of (foundation, flood, title, zoning, code violations)?
- Is there a deadline driving the sale (1031 exchange, divorce, estate, relocation)? That informs how much negotiation room exists.
- The area grade is low — what's the realistic commute time and amenity access for the typical tenant pool here? Any planned neighborhood developments (good or bad) we should know about?
- What's the average days-on-market for RENTAL listings here right now (not sales)? A rising rental-DOM trend means longer vacancies and softer asking-rent achievability than the comps imply.
- What's the recent tenant-quality profile in this submarket — average credit score on applications, eviction rate, late-payment / NSF rate, and stable-employment percentage? A property-management company in the area should have these aggregated.
- How much new for-sale + rental construction is in the pipeline within 1–3 miles? Heavy new supply typically softens prices + rents 12–24 months out; constrained supply supports both.
Investment metrics
- 1% rule
- 0.81% ✗
- Cap rate
- 5.11%
- Cash-on-cash
- -4.23%
- DSCR
- 0.81
- GRM
- 10.3
CMA / ARV
- ARV (median comp)
- $267,522
- List price
- $218,999
- Delta
- -18.14%
- Verdict
- UNDERPRICED
- Comps
- 8 within 1.0 mi
Show comp detail 10 sales within ~0.75 mi
| Address | Dist | Beds/Ba | Sqft | Sold | Price | $/sf | Match |
|---|---|---|---|---|---|---|---|
| 1317 Garden Ln | 0.26mi | 3/2.0 | 1,716 (+2%) | 2mo | $299,900 | $175 | 83 |
| 905 Jane Ln | 0.27mi | 3/2.0 | 1,604 (-4%) | 12mo | $288,000 | $180 | 70 |
| 2210 Sharon Dr | 0.21mi | 3/2.0 | 1,809 (+8%) | 16mo | $239,900 | $133 | 64 |
| 2603 Carter Creek Pkwy | 0.52mi | 3/1.0 | 1,594 (-5%) | 6mo | $235,000 | $147 | 59 |
| 1904 Sharon Dr | 0.26mi | 3/2.0 | 1,472 (-12%) | 10mo | $260,000 | $177 | 59 |
| 2501 Wayside Dr | 0.49mi | 3/2.0 | 1,466 (-13%) | 4mo | $199,000 | $136 | 53 |
| 1102 Lamar Dr | 0.75mi | 3/2.0 | 1,612 (-4%) | 8mo | $275,000 | $171 | 52 |
| 709 S Coulter Dr | 0.74mi | 3/2.0 | 1,600 (-5%) | 8mo | $250,000 | $156 | 52 |
| 1506 E 28th St | 0.64mi | 4/2.0 (+1) | 1,850 (+10%) | 0mo | $84,410 | $46 | 48 |
| 902 Mitchell St | 0.48mi | 3/2.0 | 1,928 (+15%) | 10mo | $295,000 | $153 | 44 |
Match score weights: distance 35% · size 25% · config 20% · recency 20%. Top-matched comps best support the ARV.
Projected returns pro-forma
-3.0% appreciation · 1.82% rent growth · sell at horizon
- IRR
- -24.8%
- Equity multiple
- 0.16×
- Total profit
- $-51,233
- Equity at exit
- $32,653
- IRR
- -24.6%
- Equity multiple
- -0.15×
- Total profit
- $-70,306
- Equity at exit
- $18,935
Cash invested: $61,320 (down + closing). Projections, not guarantees.
Landlord ↔ Tenant lean methodology
- Overall (STATE)
- 87 Strongly Landlord-Friendly
- State Texas
- 87 Strongly Landlord-Friendly · R+5
- County
- — inherits STATE
- City
- — inherits STATE
ZIP-level market 77802
- Rents YoY
- 1.8%
- Active inventory
- 278
- Price-to-rent
- 10.3×
Monthly cashflow live
- Estimated rent
- $1,778 high interval (Pro) →
- Mortgage (P&I)
- −$1,148
- Tax from tax record
- −$381 /mo · $4,574/yr
- Insurance
- −$91
- HOA
- −$0
- Vacancy / Maint / Mgmt
- −$373
- Net cashflow
- $-216
Break-even live
Sensitivity live
| Price | -10% $-92 | -5% $-154 | +0% $-216 | +5% $-278 | +10% $-340 |
|---|---|---|---|---|---|
| Rent | -10% $-356 | -5% $-286 | +0% $-216 | +5% $-146 | +10% $-75 |
| Rate | -1.0pp $-106 | -0.5pp $-160 | base $-216 | +0.5pp $-273 | +1.0pp $-330 |
UW: 25.0% down · 7.5% · 30yr · 1.5% tax · 5.0% vac · 8.0% maint · 8.0% mgmt
Financing live
Cash to close
- Down payment
- $54,750
- Closing costs
- $6,570
- Reserves months
- —
- Total cash needed
- —
Loan-product check · same deal, 3 products live
Conventional
25% down · 7.5% · 30yr
- Down + closing
- —
- Monthly P&I
- —
- Monthly cashflow
- —
- DSCR
- —
- Eligible?
- —
Personal DTI + credit; lowest rate.
DSCR
20% down · 8.5% · 30yr
- Down + closing
- —
- Monthly P&I
- —
- Monthly cashflow
- —
- DSCR
- —
- Eligible?
- —
No personal income docs; deal must DSCR.
Hard money
10% down · 12.0% · 12mo
- Down + closing
- —
- Monthly P&I
- —
- Monthly cashflow
- —
- DSCR
- —
- Eligible?
- —
Short-term bridge; refi at stabilization.
Rent comps 24 comps
| Address | Beds | Baths | Sqft | Rent | $/sqft | DOM | Units | Dist |
|---|---|---|---|---|---|---|---|---|
| 1503 Hollow Hill Dr Unit A Bryan, TX | 3.0 | 3.0 | 1364 | $1,550 | $1.14 | 14d | 1 | 0.46mi |
| 1503 Hollow Hill Dr Unit A Bryan, TX | 3.0 | 3.0 | 1364 | $1,550 | $1.14 | 44d | 1 | 0.46mi |
| 1512 Hollowhill Dr Bryan, TX | 1.0–4.0 | 1.0–2.0 | 905 | $1,322 | $1.46 | 14d | 10 | 0.47mi |
| 2812 Village Dr Bryan, TX | 2.0 | 2.0 | 1244 | $1,400 | $1.13 | 44d | 1 | 0.68mi |
| 1815 Gettysburg Ln Unit 1328085P Bryan, TX | 3.0 | 2.0 | 1603 | $3,721 | $2.32 | 21d | 1 | 0.70mi |
| 1803 S College Ave Bryan, TX | 3.0 | 3.0 | 1760 | $1,800 | $1.02 | 14d | 1 | 0.72mi |
| 807 S Coulter Dr Bryan, TX | 4.0 | 3.0 | 2154 | $2,250 | $1.04 | 44d | 1 | 0.73mi |
| 1409 Broadmoor Dr Bryan, TX | 4.0 | 2.0 | 1141 | $2,000 | $1.75 | 14d | 1 | 0.84mi |
| 200 Rebecca St Bryan, TX | 2.0 | 1.0–2.0 | 950 | $830 | $0.87 | 14d | 8 | 0.90mi |
| 611 S Ennis St Apt 37 Bryan, TX | 2.0 | 1.5 | 1052 | $995 | $0.95 | 44d | 1 | 0.90mi |
| 728 Meadow Ln Unit 1093291P Bryan, TX | 3.0 | 2.0 | 1517 | $4,919 | $3.24 | 44d | 1 | 0.95mi |
| 1318 Antone St Bryan, TX | 2.0 | 1.0 | 1132 | $900 | $0.80 | 44d | 1 | 1.05mi |
| 1316 Antone St Unit B Bryan, TX | 2.0 | 1.0 | 1132 | $850 | $0.75 | 44d | 1 | 1.05mi |
| 814 E 28th St Bryan, TX | 2.0 | 2.0 | 1777 | $1,550 | $0.87 | 44d | 1 | 1.16mi |
| 501 Helena St Bryan, TX | 3.0 | 2.0 | 1424 | $2,200 | $1.54 | 21d | 1 | 1.29mi |
| 214 Helena St Unit 1071607P Bryan, TX | 4.0 | 3.0 | 2034 | $6,503 | $3.20 | 14d | 1 | 1.33mi |
| 104 W 33rd St Bryan, TX | 2.0 | 2.5 | 1204 | $1,850 | $1.54 | 44d | 1 | 1.36mi |
| 106 W 33rd St Bryan, TX | 2.0 | 2.5 | 1204 | $1,850 | $1.54 | 21d | 1 | 1.36mi |
| 3213 Link St Unit 112 Bryan, TX | 3.0 | 3.5 | 1854 | $2,400 | $1.29 | 44d | 1 | 1.38mi |
| 138 Watson St Bryan, TX | 3.0 | 1.0 | 1104 | $1,200 | $1.09 | 21d | 1 | 1.41mi |
| 2902 Chaparral Cir Bryan, TX | 4.0 | 3.0 | 2181 | $3,000 | $1.38 | 21d | 1 | 1.42mi |
| 3130 E Villa Maria Rd Bryan, TX | 1.0–3.0 | 1.0 | 810 | $1,169 | $1.44 | 14d | 10 | 1.45mi |
| 407 Fairway Dr Bryan, TX | 4.0 | 2.0 | 1720 | $2,375 | $1.38 | 14d | 1 | 1.46mi |
| 2702 Apple Creek Cir Bryan, TX | 4.0 | 3.0 | 2198 | $2,800 | $1.27 | 14d | 1 | 1.49mi |
Listing history 30 events
-
2026-05-06price $218,999 230-char remark
Show marketing remark (230 chars)
Great starter Home for a and/or potential of Renting out a few Rooms Spacious Backyard for family gatherings, close to Schools and Shopping Center New Roof 2020 Solar Panels Will be Included Schedule your appointment today!
-
2026-04-17price $219,999 230-char remark
Show marketing remark (230 chars)
Great starter Home for a and/or potential of Renting out a few Rooms Spacious Backyard for family gatherings, close to Schools and Shopping Center New Roof 2020 Solar Panels Will be Included Schedule your appointment today!
-
2025-07-29$259,900 Active 230-char remark
Show marketing remark (230 chars)
Great starter Home for a and/or potential of Renting out a few Rooms Spacious Backyard for family gatherings, close to Schools and Shopping Center New Roof 2020 Solar Panels Will be Included Schedule your appointment today!
-
2024-11-11price $230,000
-
2024-11-10historical
-
2024-10-07price $230,000
-
2024-10-02price $245,000
-
2024-10-01price $245,000
-
2024-09-16price $247,500
-
2024-09-16price $247,500
-
2024-09-09price $250,000
-
2024-09-09price $250,000
-
2024-08-17price $255,000
-
2024-08-17price $255,000
-
2024-08-08price $260,000
-
2024-08-08price $260,000
-
2024-07-11price $270,000
-
2024-07-11price $270,000
-
2024-07-04price $285,000
-
2024-07-04price $285,000
-
2024-06-03price $290,000
-
2024-06-03price $290,000
-
2024-05-25$300,000 Active
-
2024-05-25$300,000 Active
-
2016-07-25soldstatus
-
2016-07-22soldstatus
-
2016-06-05$150,800
-
2014-06-03soldstatus
-
2014-05-30soldstatus
-
2014-03-21$134,900
ⓘ Source: listings_history table (triggers on properties + properties_extension) + one-shot
backfill from property_details.listing_events for pre-trigger history.
Tax reassessment forecast TX · Resets to sale price
- Current annual tax
- $4,574 · $381/mo
- Projected year-2 tax
- $4,574 · $381/mo
- Expected delta
- $0/yr ($0/mo · 0.0%)
ⓘ Screening estimate from a state-policy table — verify with the county assessor before closing.
Climate risk First Street
- Flood 1/10 Low FEMA zone X (unshaded) · 0% chance over 30 yrs
- Wildfire 1/10 Low
- Heat 8/10 Severe 7 d/yr ≥110°F today · 24 d/yr by 30 yrs out
- Wind 8/10 Severe 80% chance of damaging wind over 30 yrs
- Air quality 1/10 Low 0 unhealthy d/yr today · 0 by 30 yrs out
Nearby sold comps map
Loading sold comps map…
Walkable amenities ~0.75 mi
Loading nearby amenities…
Taxation est. · year 1
- Rental income
- $21,341
- − Mortgage interest
- −$12,267
- − Property taxes
- −$4,574
- − Insurance
- −$1,095
- − Repairs & maintenance
- −$1,707
- − Management
- −$1,707
- − Depreciation
- −$6,371
- Taxable loss
- −$6,381
- Est. tax savings @ 24.0%
- +$1,531
- After-tax cash flow
- $-1,060/yr
For passive investors: Depreciation is non-cash, so a rental often shows a tax loss while cash-flowing — sheltering income. Rental losses are passive: they offset passive income freely, and up to $25,000/yr can offset ordinary (W-2) income if you actively participate and your MAGI is under $100k (phasing out to $0 by $150k); unused losses carry forward. On sale, claimed depreciation is recaptured at up to 25%, and gains may owe capital-gains tax (a 1031 exchange can defer both). Figures are a year-1 estimate at your 24.0% rate — not tax advice; consult a CPA.
Schools (NCES district)
- District
- Bryan ISD
- NCES district ID
- 4811790
- Math proficiency
- 30% ▼ -8.00%
- Reading proficiency
- 32% ▼ -3.00%
- Median HH income
- $41,895
- Composite
- 26.26/100
- National rank
- #7253
- State rank
- #608 of 826 in TX
Livability — Bryan
- Score
- 76/100
- State rank
- #99
- US rank
- #3341
Category grades
Schools grade is shown separately in the Schools card above.
Census & demographics
- Census place
- Bryan, TX
- County
- Brazos County · 233,400 people
- City population
- 101,772
- Metro
- College Station-Bryan, TX
- Population (ZIP)
- 25,762
- Household income
- $70,666
- Rent vs Own
- Severe rent burden
- 1559.0
Population outlook (Brazos County) Hauer SSP2
- Today (2025)
- 267,942 people
- By 2030
- 296,630 · +10.7%
- By 2040
- 354,560 · +32.3%
- By 2050
- 414,616 · +54.7%
- By 2075
- 562,158 · +109.8%
- By 2100
- 678,828 · +153.3%
Race, ethnicity, and origin ACS 2023
- Neighborhood character
- Diverse neighborhood (Simpson 0.58)
- Race & ethnicity
- White 59% Hispanic / Latino 26% Two or more races 12% Black 11% Asian 2%
- Hispanic origin (detail)
- Mexican 23%
- Common ancestry
- Lithuanian 3% Slovak 2% Italian 2%
- Foreign-born
- 7% · Canada, South Korea
- Languages at home
- 82% English-only · Spanish 15% Korean 1% Russian/Polish/Slavic 1%
Political lean MEDSL · Brazos
- 2024 margin
- Strong R (+24.9) · D 36.9% · R 61.7% · Other 1.4%
- 2008→2024 swing
- +4.1pp toward D · 2008: -28.9pp · 2024: -24.9pp
- All cycles
- 2024: R+24.9 2020: R+14.3 2016: R+23.7 2012: R+35.3 2008: R+28.9
Not yet ingested
- Civics
- —
Market trends
- HPI YoY
- ▼ -148.67%
- Current HPI
- 202.0858
- Rent YoY
- ▲ 1.82%
- Metro
- College Station-Bryan, TX
- State GDP YoY
- ▲ 3.95%
- F500 in state
- 110
Industry mix (Fortune 500 HQ in TX)
| Industry | F500 HQs | Revenue |
|---|---|---|
| Energy | 16 | $1,198B |
|
||
| Technology | 5 | $198B |
|
||
| Engineering / Construction | 4 | $72B |
|
||
| Energy Services | 3 | $60B |
|
||
| Utilities | 3 | $41B |
|
||
| Healthcare | 2 | $330B |
|
||
Price history
+62.3% since first listed30 events — show timeline
- 2026-05-06 Price Changed $218,999 HARMLS
- 2026-04-17 Price Changed $219,999 HARMLS
- 2025-07-29 Listed $259,900 HARMLS
- 2024-11-11 Price Changed $230,000 BCSRMLS
- 2024-11-10 Listing Removed — HARMLS
- 2024-10-07 Price Changed $230,000 HARMLS
- 2024-10-02 Price Changed $245,000 HARMLS
- 2024-10-01 Price Changed $245,000 BCSRMLS
- 2024-09-16 Price Changed $247,500 HARMLS
- 2024-09-16 Price Changed $247,500 BCSRMLS
- 2024-09-09 Price Changed $250,000 HARMLS
- 2024-09-09 Price Changed $250,000 BCSRMLS
- 2024-08-17 Price Changed $255,000 HARMLS
- 2024-08-17 Price Changed $255,000 BCSRMLS
- 2024-08-08 Price Changed $260,000 BCSRMLS
- 2024-08-08 Price Changed $260,000 HARMLS
- 2024-07-11 Price Changed $270,000 HARMLS
- 2024-07-11 Price Changed $270,000 BCSRMLS
- 2024-07-04 Price Changed $285,000 HARMLS
- 2024-07-04 Price Changed $285,000 BCSRMLS
- 2024-06-03 Price Changed $290,000 HARMLS
- 2024-06-03 Price Changed $290,000 BCSRMLS
- 2024-05-25 Listed $300,000 BCSRMLS
- 2024-05-25 Listed $300,000 HARMLS
- 2016-07-25 Sold (Public Records) — Public Records
- 2016-07-22 Sold (MLS) — BCSRMLS
- 2016-06-05 Listed $150,800 BCSRMLS
- 2014-06-03 Sold (Public Records) — Public Records
- 2014-05-30 Sold (MLS) — BCSRMLS
- 2014-03-21 Listed $134,900 BCSRMLS
Property tax history
+5.6%/yrLatest (2025): $4,574 · +10.0% YoY. Source: county tax records.
Cash-flow waterfall
monthlySold comps — $/sqft
last 12 mo · ≤1 miLoading sold comps…