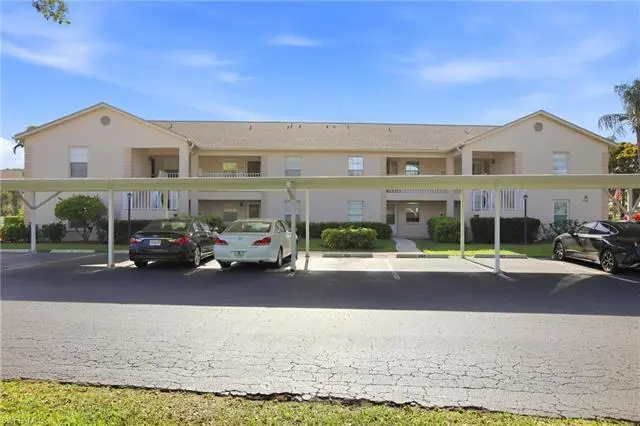
338 Bradstrom Cir Unit A-104 · Lely, FL
Flood risk 8/10 · Major
- FEMA flood zone
- AE
- Chance of flooding over 30 yrs
- 0.98%
- Est. flood insurance / yr
- $1,737 – $8,500
Fire risk 4/10 · Minor
- Est. fire insurance / yr
- $947 – $1,759
Heat risk 9/10 · Severe
- Hot days now (above 107°F)
- 4 days/yr
- Hot days in 30 yrs
- 14 days/yr
Wind risk 10/10 · Severe
- Chance of severe wind over 30 yrs
- 99.0%
Air-quality risk 2/10 · Minimal
- Unhealthy air days now
- 2 days/yr
- Unhealthy air days in 30 yrs
- 2 days/yr
Risk factors via First Street. Map © Google.
Why this score? — see what drove the B grade
The composite is a weighted blend of 9 inputs, each scored 0–100. Each bar is that input's sub-score; the figure is the points it added to the 100-point composite (weight × sub-score).
- Cash flow +30.0/30.0
- 1% rule +10.0/10.0
- DSCR +10.0/10.0
- ARV discount +7.5/15.0
- Schools +5.0/10.0
- Rent growth +3.9/5.0
- Livability +3.3/5.0
- Condition / age +2.5/5.0
- Appreciation +0.0/10.0
$247,500
🖨 Deal sheet (PDF) 📄 Offer letter ✓ Due diligence
Listing remarks MLS
C. 11676 - Owner occupied through 4/15/2016 call for appointment. Rarely available! Nicely updated end unit with upgraded cabinets and granite counters, newer windows, laminate and tile floors, great closet space and single carport. Short walk to pool. Great location near shopping and banks and a short drive to downtown.
Key facts
- $589 HOA
- Parking
- Built 1990
Property features AI
Finance
- Financial info: Pets allowed with restrictions or possible restrictions (conditional)
- HOA & community: Quarterly association fee; Association dues cover insurance, legal/accounting, and grounds maintenance
Exterior
- Parking: Detached carport (1 covered carport space)
- Utilities: Electric heating and cooling
- Home design: Block construction; 2 stories; Entry at level 1; Attached property
- Construction: Block construction; Resale property
- Exterior features: Covered parking; Guest parking
Interior
- Kitchen: Dishwasher; Disposal; Refrigerator; Gas/Range or Electric range not specified
- Bedrooms: Primary bedroom on main level
- Flooring: Carpet; Laminate; Tile
- Bathrooms: 2 full bathrooms
- Heating & cooling: Central heating (electric); Central air conditioning (electric); Ceiling fan(s)
- Interior features: Breakfast area; First-floor entry; Living/dining room; Main-level primary bedroom; Walk-in closet(s)
- Laundry & utility: Washer; Dryer
Neighborhood map
What this means for you Summary
Snapshot
- This is a 3-bed/2.0-bath condo listed at $248k.
Deal economics
- At list price, monthly cash flow is $1k ($16k/yr) — positive.
- The deal already cash-flows at list — no discount required.
- Meets the 1% rule at list price ($5k rent vs $248k).
- Recommended offer: $233k (6.0% below list) — sets the bar for market timing.
Location & tenants
- Location reads 66/100 on livability (#586 in FL) — a middle-class / working-renter tenant base. Strengths: crime A+, housing A+; Watch: schools D+, health & safety D, amenities F.
- Collier (suburban): math 60% / reading 56% proficiency, ranked #16 of 73 in FL (top 22%) — acceptable for families but not a draw, mixed tenant base, ~2y average lease.
- Market conditions: Rents rising fast (+5.6%/yr); 598 active listings in the ZIP; 40 comparable units currently listed for rent nearby; rentals at typical pace (median 25d on market — plan ~3-4 weeks tenant-placement turnaround); solid renter incomes; 3,520 units permitted in Collier County in 2024 (959 in 5+ unit buildings).
- At $4,941/mo this rent would consume 73% of the median local household income ($82k/yr) (locally 954% of renters already pay >50% of income on rent) — very limited rent-growth headroom before tenants either downsize or default.
Forward outlook
- Local home prices are declining (-3.0%/yr); year-one equity from $2k of loan paydown is wiped out by about $7k of value loss. Plan a longer hold.
- Collier County population projected at +30% by 2050 — long-run rental-demand tailwind backs the buy-and-hold thesis.
- At projected returns (-3.0% appreciation + 5.6% rent growth), your $69k cash investment doubles in ~5 years — after that, you're playing with house money.
Negotiation context
- It's been on market 62 days — a 6% lower offer ($233k) is reasonable based on typical stale-listing flexibility.
- 3 sale attempts since 15y ago; this cycle's ask has dropped $32k (12%) from the opening price — seller is motivated, your offer sets the floor, not the list.
- Current owner paid $170k; 46% above their basis — modest negotiation headroom, anchor on the comps not their cost.
Risks & watch-outs
- Watch-outs: flood insurance adds $427/mo.
- Climate carrying-cost: in FEMA flood zone AE (mandatory federal flood insurance); severe wind risk, 99% chance of damaging wind over 30y; extreme-heat days projected 4→14/yr by 2055 (HVAC capex compounding) — expect insurance premiums to compound above CPI over the hold.
Questions for the listing agent
- It's been on market 62 days. Have you received any prior offers? Is the seller open to a 6% concession, seller financing, or rate buy-down credit?
- What's the actual annual flood-insurance premium (NFIP or private), and is the property in a SFHA with mandatory coverage?
- What does the HOA fee cover, when was the last increase, and are there any pending special assessments or reserve-fund shortfalls?
- Any open or pending special assessments — roof, HVAC, plumbing, elevator, façade? What's the per-unit balance and payoff schedule, and is the seller paying it off at close or rolling it to the buyer?
- Why hasn't it sold? Are there any deal-killer items the seller is aware of (foundation, flood, title, zoning, code violations)?
- Is there a deadline driving the sale (1031 exchange, divorce, estate, relocation)? That informs how much negotiation room exists.
- Schools are D-rated, which usually means shorter tenancies and higher turnover. Who's the typical renter profile here, and what's been the actual vacancy rate?
- What's the average days-on-market for RENTAL listings here right now (not sales)? A rising rental-DOM trend means longer vacancies and softer asking-rent achievability than the comps imply.
- What's the recent tenant-quality profile in this submarket — average credit score on applications, eviction rate, late-payment / NSF rate, and stable-employment percentage? A property-management company in the area should have these aggregated.
- How much new apartment / multifamily construction is in the pipeline within 1–3 miles? Heavy new supply (>2% of stock underway) typically softens rents 12–24 months out; light construction supports rent growth.
Investment metrics
- 1% rule
- 2.00% ✓
- Cap rate
- 15.00%
- Cash-on-cash
- 31.09%
- DSCR
- 2.38
- GRM
- 4.2
CMA / ARV
No comps found within radius.
Projected returns pro-forma
-3.0% appreciation · 5.59% rent growth · sell at horizon
- IRR
- 20.6%
- Equity multiple
- 1.88×
- Total profit
- $60,864
- Equity at exit
- $36,903
- IRR
- 31.0%
- Equity multiple
- 4.24×
- Total profit
- $224,775
- Equity at exit
- $21,399
Cash invested: $69,300 (down + closing). Projections, not guarantees.
Landlord ↔ Tenant lean methodology
- Overall (STATE)
- 87 Strongly Landlord-Friendly
- State Florida
- 87 Strongly Landlord-Friendly · R+3
- County
- — inherits STATE
- City
- — inherits STATE
ZIP-level market 34113
- Rents YoY
- 5.6%
- Active inventory
- 598
- Price-to-rent
- 4.2×
Monthly cashflow live
- Estimated rent
- $4,941 high interval (Pro) →
- Mortgage (P&I)
- −$1,298
- Tax from tax record
- −$118 /mo · $1,414/yr
- Insurance
- −$103
- Flood insurance flood zone
- −$427 /mo · $5,118/yr
- HOA
- −$589
- Vacancy / Maint / Mgmt
- −$1,038
- Net cashflow
- $1,369
Break-even live
Sensitivity live
| Price | -10% $1,509 | -5% $1,439 | +0% $1,369 | +5% $1,299 | +10% $1,229 |
|---|---|---|---|---|---|
| Rent | -10% $978 | -5% $1,174 | +0% $1,369 | +5% $1,564 | +10% $1,759 |
| Rate | -1.0pp $1,493 | -0.5pp $1,432 | base $1,369 | +0.5pp $1,305 | +1.0pp $1,239 |
UW: 25.0% down · 7.5% · 30yr · 1.5% tax · 5.0% vac · 8.0% maint · 8.0% mgmt
Financing live
Cash to close
- Down payment
- $61,875
- Closing costs
- $7,425
- Reserves months
- —
- Total cash needed
- —
Loan-product check · same deal, 3 products live
Conventional
25% down · 7.5% · 30yr
- Down + closing
- —
- Monthly P&I
- —
- Monthly cashflow
- —
- DSCR
- —
- Eligible?
- —
Personal DTI + credit; lowest rate.
DSCR
20% down · 8.5% · 30yr
- Down + closing
- —
- Monthly P&I
- —
- Monthly cashflow
- —
- DSCR
- —
- Eligible?
- —
No personal income docs; deal must DSCR.
Hard money
10% down · 12.0% · 12mo
- Down + closing
- —
- Monthly P&I
- —
- Monthly cashflow
- —
- DSCR
- —
- Eligible?
- —
Short-term bridge; refi at stabilization.
Rent comps 40 comps
| Address | Beds | Baths | Sqft | Rent | $/sqft | DOM | Units | Dist |
|---|---|---|---|---|---|---|---|---|
| 326 Bradstrom Cir Unit 204F Naples, FL | 3.0 | 2.0 | 1200 | $3,500 | $2.92 | 24d | 1 | 0.01mi |
| 326 Bradstrom Cir Unit 103F Naples, FL | 2.0 | 2.0 | 1113 | $1,800 | $1.62 | 24d | 1 | 0.01mi |
| 332 Bradstrom Cir #201 Naples, FL | 2.0 | 2.0 | 1257 | $2,200 | $1.75 | 24d | 1 | 0.05mi |
| 5293 Dixie Dr Unit 1546039P Naples, FL | 2.0 | 2.0 | 1130 | $1,561 | $1.38 | 15d | 1 | 0.09mi |
| 315 Saint Andrews Blvd Unit A25 Naples, FL | 2.0 | 2.0 | 1126 | $1,530 | $1.36 | 24d | 1 | 0.12mi |
| 248 Pebble Beach Cir Unit G201 Naples, FL | 2.0 | 2.0 | 1163 | $2,300 | $1.98 | 24d | 1 | 0.21mi |
| 452 Bristle Cone Ln #27 Naples, FL | 2.0 | 2.0 | 1129 | $2,000 | $1.77 | 24d | 1 | 0.24mi |
| 520 Augusta Blvd Unit B204 Naples, FL | 3.0 | 2.0 | 1294 | $2,200 | $1.70 | 24d | 1 | 0.54mi |
| 7124 Saona Ct Naples, FL | 2.0 | 2.0 | 1387 | $8,000 | $5.77 | 24d | 1 | 0.54mi |
| 6984 Saona Ct Naples, FL | 2.0 | 2.0 | 1472 | $7,500 | $5.10 | 24d | 1 | 0.56mi |
| 7162 Saona Ct Naples, FL | 2.0 | 2.0 | 1482 | $9,000 | $6.07 | 24d | 1 | 0.57mi |
| 265 Deerwood Cir Naples, FL | 2.0 | 2.0 | 1179 | $5,000 | $4.24 | 24d | 1 | 0.57mi |
| 7110 Cayo Coco Ln Naples, FL | 2.0 | 2.0 | 1387 | $9,250 | $6.67 | 24d | 1 | 0.59mi |
| 7197 Saona Ct Unit 1545994P Naples, FL | 2.0 | 2.0 | 1291 | $4,152 | $3.22 | 15d | 1 | 0.59mi |
| 7213 Saona Ct Naples, FL | 2.0 | 2.0 | 1308 | $7,500 | $5.73 | 24d | 1 | 0.61mi |
| 7138 Cayo Coco Ln Naples, FL | 2.0 | 2.0 | 1205 | $6,500 | $5.39 | 24d | 1 | 0.61mi |
| 7142 Cayo Coco Ln Naples, FL | 2.0 | 2.0 | 1490 | $10,000 | $6.71 | 24d | 1 | 0.62mi |
| 413 Augusta Blvd #302 Naples, FL | 2.0 | 2.0 | 1390 | $5,500 | $3.96 | 22d | 1 | 0.64mi |
| 7242 Saona Ct Naples, FL | 2.0 | 2.0 | 1204 | $7,750 | $6.44 | 24d | 1 | 0.65mi |
| 240 Pebble Beach Blvd #702 Naples, FL | 2.0 | 2.0 | 1090 | $4,000 | $3.67 | 24d | 1 | 0.66mi |
| 7289 Saona Ct Naples, FL | 2.0 | 2.0 | 1411 | $10,000 | $7.09 | 24d | 1 | 0.67mi |
| 7204 Cayo Coco Ln Naples, FL | 2.0 | 2.0 | 1308 | $7,500 | $5.73 | 24d | 1 | 0.67mi |
| 190 Pebble Beach Blvd #301 Naples, FL | 2.0 | 2.0 | 954 | $1,700 | $1.78 | 24d | 1 | 0.67mi |
| 7286 Saona Ct Naples, FL | 2.0 | 2.0 | 1205 | $10,000 | $8.30 | 24d | 1 | 0.68mi |
| 555 Augusta Blvd Unit 3-1 Naples, FL | 2.0 | 2.0 | 1249 | $4,200 | $3.36 | 24d | 1 | 0.71mi |
| 7263 Cayo Coco Ln Naples, FL | 2.0 | 2.0 | 1321 | $6,500 | $4.92 | 24d | 1 | 0.73mi |
| 232 Pebble Beach Blvd #104 Naples, FL | 3.0 | 2.0 | 1298 | $1,975 | $1.52 | 24d | 1 | 0.74mi |
| 7299 Cayo Coco Ln Naples, FL | 2.0 | 2.0 | 1476 | $6,500 | $4.40 | 24d | 1 | 0.74mi |
| 7259 Cayo Coco Ln Naples, FL | 2.0 | 2.0 | 1411 | $6,500 | $4.61 | 24d | 1 | 0.74mi |
| 575 Augusta Blvd Naples, FL | 3.0 | 2.0 | 1500 | $2,100 | $1.40 | 24d | 1 | 0.75mi |
| 605 Augusta Blvd #4 Naples, FL | 2.0 | 2.0 | 1125 | $3,950 | $3.51 | 15d | 1 | 0.81mi |
| 605 Augusta Blvd #14 Naples, FL | 2.0 | 2.0 | 1125 | $4,000 | $3.56 | 24d | 1 | 0.81mi |
| 701 Augusta Blvd Unit 701-8 Naples, FL | 2.0 | 2.0 | 1250 | $4,800 | $3.84 | 15d | 1 | 0.84mi |
| 705 Augusta Blvd Unit 705-5 Naples, FL | 2.0 | 2.0 | 1125 | $2,000 | $1.78 | 15d | 1 | 0.87mi |
| 5651 Rattlesnake Hammock Rd Unit C-108 Naples, FL | 2.0 | 2.0 | 1054 | $1,800 | $1.71 | 24d | 1 | 0.87mi |
| 5535 Rattlesnake Hammock Rd #302 Naples, FL | 2.0 | 2.0 | 1205 | $2,800 | $2.32 | 24d | 1 | 0.87mi |
| 5635 Rattlesnake Hammock Rd Apt 203D Naples, FL | 2.0 | 2.0 | 1054 | $1,700 | $1.61 | 22d | 1 | 0.87mi |
| 709 Augusta Blvd Unit 709-5 Naples, FL | 3.0 | 2.0 | 1480 | $4,000 | $2.70 | 15d | 1 | 0.89mi |
| 5499 Rattlesnake Hammock Rd Naples, FL | 2.0 | 2.0 | 1071 | $1,775 | $1.66 | 15d | 2 | 0.90mi |
| 760 Augusta Blvd Unit D204 Naples, FL | 3.0 | 2.0 | 1294 | $2,300 | $1.78 | 24d | 1 | 0.92mi |
HOA detail condo
- Monthly dues
- $589 · $7,068/yr
- Likely covers
- pool
- Assessments
- None detected in remarks — confirm with the listing agent.
Listing history 29 events
-
2026-06-21days on market $247,500 Active 62 DOM
-
2026-06-18days on market $247,500 Active 59 DOM
-
2026-06-17days on market $247,500 Active 58 DOM
-
2026-06-16days on market $247,500 Active 57 DOM
-
2026-06-15days on market $247,500 Active 56 DOM
-
2026-06-14pricedays on market $247,500 Active 54 DOM
-
2026-06-10days on market $255,000 Active 51 DOM
-
2026-06-09days on market $255,000 Active 50 DOM
-
2026-06-08days on market $255,000 Active 49 DOM
-
2026-06-07days on market $255,000 Active 48 DOM
-
2026-06-03days on market $255,000 Active 44 DOM
-
2026-06-02days on market $255,000 Active 43 DOM
-
2026-06-01days on market $255,000 Active 42 DOM
-
2026-05-31days on market $255,000 Active 41 DOM
-
2026-05-30days on market $255,000 Active 40 DOM
-
2026-05-19price $275,000
-
2026-04-20$280,000 Active
-
2016-08-10soldstatus $170,000
-
2016-07-07price $169,900 324-char remark
Show marketing remark (324 chars)
C. 11676 - Owner occupied through 4/15/2016 call for appointment. Rarely available! Nicely updated end unit with upgraded cabinets and granite counters, newer windows, laminate and tile floors, great closet space and single carport. Short walk to pool. Great location near shopping and banks and a short drive to downtown.
-
2016-06-29soldstatus $170,000 Sold 324-char remark
Show marketing remark (324 chars)
C. 11676 - Owner occupied through 4/15/2016 call for appointment. Rarely available! Nicely updated end unit with upgraded cabinets and granite counters, newer windows, laminate and tile floors, great closet space and single carport. Short walk to pool. Great location near shopping and banks and a short drive to downtown.
-
2016-06-29price $170,000 324-char remark
Show marketing remark (324 chars)
C. 11676 - Owner occupied through 4/15/2016 call for appointment. Rarely available! Nicely updated end unit with upgraded cabinets and granite counters, newer windows, laminate and tile floors, great closet space and single carport. Short walk to pool. Great location near shopping and banks and a short drive to downtown.
-
2016-05-07status Pending With Contingencies 324-char remark
Show marketing remark (324 chars)
C. 11676 - Owner occupied through 4/15/2016 call for appointment. Rarely available! Nicely updated end unit with upgraded cabinets and granite counters, newer windows, laminate and tile floors, great closet space and single carport. Short walk to pool. Great location near shopping and banks and a short drive to downtown.
-
2016-01-18price $169,900 324-char remark
Show marketing remark (324 chars)
C. 11676 - Owner occupied through 4/15/2016 call for appointment. Rarely available! Nicely updated end unit with upgraded cabinets and granite counters, newer windows, laminate and tile floors, great closet space and single carport. Short walk to pool. Great location near shopping and banks and a short drive to downtown.
-
2015-11-05$180,000 Active 324-char remark
Show marketing remark (324 chars)
C. 11676 - Owner occupied through 4/15/2016 call for appointment. Rarely available! Nicely updated end unit with upgraded cabinets and granite counters, newer windows, laminate and tile floors, great closet space and single carport. Short walk to pool. Great location near shopping and banks and a short drive to downtown.
-
2011-05-23soldstatus $79,000
-
2011-05-16soldstatus $79,000 399-char remark
Show marketing remark (399 chars)
Well cared for apartment with New Windows and electric shutters at the lanai screen. Newer A/C with UV light for extra filter protection. Landscape view with plenty of privacy due to the large tree in front. Short walk to the pool. Great location in Lely off of St. Andrews with easy access to US 41 and downtown and the beaches or North on St. Andrews to Santa Barbara Blvd. Washer/dryer excluded.
-
2011-01-02$84,900 399-char remark
Show marketing remark (399 chars)
Well cared for apartment with New Windows and electric shutters at the lanai screen. Newer A/C with UV light for extra filter protection. Landscape view with plenty of privacy due to the large tree in front. Short walk to the pool. Great location in Lely off of St. Andrews with easy access to US 41 and downtown and the beaches or North on St. Andrews to Santa Barbara Blvd. Washer/dryer excluded.
-
1997-05-23soldstatus $62,000
-
1989-03-01soldstatus $59,900
ⓘ Source: listings_history table (triggers on properties + properties_extension) + one-shot
backfill from property_details.listing_events for pre-trigger history.
Tax reassessment forecast FL · Resets to sale price
- Current annual tax
- $1,414 · $118/mo
- Projected year-2 tax
- $2,054 · $171/mo
- Expected delta
- +$640/yr (+$53/mo · 45.3%)
ⓘ Screening estimate from a state-policy table — verify with the county assessor before closing.
Climate risk First Street
- Flood 8/10 Severe FEMA zone AE · 98% chance over 30 yrs
- Wildfire 4/10 Moderate
- Heat 9/10 Extreme 4 d/yr ≥107°F today · 14 d/yr by 30 yrs out
- Wind 10/10 Extreme 99% chance of damaging wind over 30 yrs
- Air quality 2/10 Low 2 unhealthy d/yr today · 2 by 30 yrs out
Nearby sold comps map
Loading sold comps map…
Walkable amenities ~0.75 mi
Loading nearby amenities…
Taxation est. · year 1
- Rental income
- $59,290
- − Mortgage interest
- −$13,864
- − Property taxes
- −$1,414
- − Insurance
- −$6,356
- − Repairs & maintenance
- −$4,743
- − Management
- −$4,743
- − HOA
- −$7,068
- − Depreciation
- −$7,200
- Taxable income
- $13,901
- Est. tax owed @ 24.0%
- −$3,336
- After-tax cash flow
- $13,089/yr
For passive investors: Depreciation is non-cash, so a rental often shows a tax loss while cash-flowing — sheltering income. Rental losses are passive: they offset passive income freely, and up to $25,000/yr can offset ordinary (W-2) income if you actively participate and your MAGI is under $100k (phasing out to $0 by $150k); unused losses carry forward. On sale, claimed depreciation is recaptured at up to 25%, and gains may owe capital-gains tax (a 1031 exchange can defer both). Figures are a year-1 estimate at your 24.0% rate — not tax advice; consult a CPA.
Schools (NCES district)
- District
- Collier
- NCES district ID
- 1200330
- Math proficiency
- 60% ▼ -4.00%
- Reading proficiency
- 56% ▼ -2.00%
- Median HH income
- $58,275
- Composite
- 50.23/100
- National rank
- #1892
- State rank
- #16 of 73 in FL
Livability — Lely
- Score
- 66/100
- State rank
- #586
- US rank
- #11224
Category grades
Schools grade is shown separately in the Schools card above.
Census & demographics
- Census place
- Lely, FL
- County
- Collier County · 396,295 people
- Metro
- Naples-Marco Island, FL
- Population (ZIP)
- 26,056
- Household income
- $81,674
- Rent vs Own
- Severe rent burden
- 954.0
Population outlook (Collier County) Hauer SSP2
- Today (2025)
- 420,858 people
- By 2030
- 450,054 · +6.9%
- By 2040
- 502,232 · +19.3%
- By 2050
- 544,932 · +29.5%
- By 2075
- 627,203 · +49.0%
- By 2100
- 659,015 · +56.6%
Race, ethnicity, and origin ACS 2023
- Neighborhood character
- Diverse neighborhood (Simpson 0.59)
- Race & ethnicity
- White 56% Hispanic / Latino 28% Black 12% Two or more races 11% Asian 2%
- Hispanic origin (detail)
- Mexican 17% Puerto Rican 3% Cuban 2%
- Common ancestry
- Hispanic 10% Romanian 3% Lithuanian 2%
- Foreign-born
- 26% · Canada, Jamaica, Vietnam
- Languages at home
- 63% English-only · Spanish 24% French/Haitian/Cajun 9% Other Indo-European 2%
Political lean MEDSL · Collier
- 2024 margin
- Solid R (+33.1) · D 33.1% · R 66.2%
- 2008→2024 swing
- -10.6pp toward R · 2008: -22.5pp · 2024: -33.1pp
- All cycles
- 2024: R+33.1 2020: R+24.7 2016: R+26.0 2012: R+30.1 2008: R+22.5
Not yet ingested
- Civics
- —
Market trends
- HPI YoY
- ▼ -194.86%
- Current HPI
- 279.4232
- Rent YoY
- ▲ 5.59%
- Metro
- Naples-Marco Island, FL
- State GDP YoY
- ▲ 3.28%
- F500 in state
- 36
Industry mix (Fortune 500 HQ in FL)
| Industry | F500 HQs | Revenue |
|---|---|---|
| Industrial Technology | 2 | $29B |
|
||
| Insurance | 2 | $17B |
|
||
| Retail | 1 | $60B |
|
||
| Technology Distribution | 1 | $58B |
|
||
| Homebuilding | 1 | $35B |
|
||
| Technology Manufacturing | 1 | $35B |
|
||
Price history
+359.1% since first listed14 events — show timeline
- 2026-05-19 Price Changed $275,000 MARMLS
- 2026-04-20 Listed $280,000 MARMLS
- 2016-08-10 Sold (Public Records) $170,000 Public Records
- 2016-07-07 Price Changed $169,900 NAPLESMLS
- 2016-06-29 Price Changed $170,000 NAPLESMLS
- 2016-06-29 Sold (MLS) $170,000 NAPLESMLS
- 2016-05-07 Pending — NAPLESMLS
- 2016-01-18 Price Changed $169,900 NAPLESMLS
- 2015-11-05 Listed $180,000 NAPLESMLS
- 2011-05-23 Sold (Public Records) $79,000 Public Records
- 2011-05-16 Sold (MLS) $79,000 NAPLESMLS
- 2011-01-02 Listed $84,900 NAPLESMLS
- 1997-05-23 Sold (Public Records) $62,000 Public Records
- 1989-03-01 Sold (Public Records) $59,900 Public Records
Property tax history
+2.9%/yrLatest (2025): $1,414 · +6.8% YoY. Source: county tax records.
Cash-flow waterfall
monthlySold comps — $/sqft
last 12 mo · ≤1 miLoading sold comps…