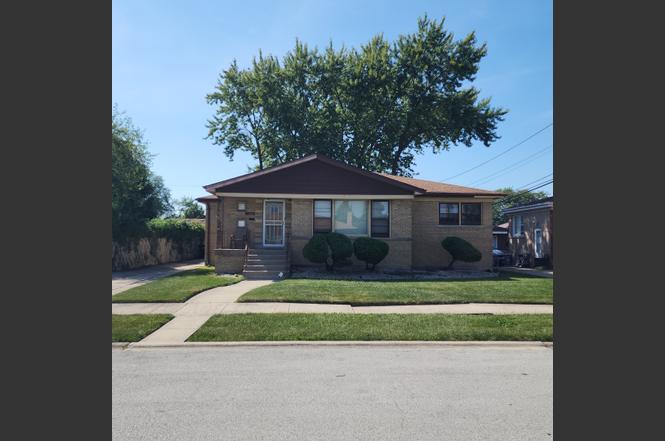
16646 Maryland Ave · South Holland, IL
Flood risk 1/10 · Minimal
- FEMA flood zone
- X (unshaded)
- Chance of flooding over 30 yrs
- 0.0%
- Est. flood insurance / yr
- $473 – $860
Fire risk 1/10 · Minimal
- Est. fire insurance / yr
- $804 – $1,492
Heat risk 3/10 · Minor
- Hot days now (above 103°F)
- 7 days/yr
- Hot days in 30 yrs
- 15 days/yr
Wind risk 2/10 · Minimal
- Chance of severe wind over 30 yrs
- —
Air-quality risk 4/10 · Minor
- Unhealthy air days now
- 4 days/yr
- Unhealthy air days in 30 yrs
- 5 days/yr
Risk factors via First Street. Map © Google.
Why this score? — see what drove the B grade
The composite is a weighted blend of 9 inputs, each scored 0–100. Each bar is that input's sub-score; the figure is the points it added to the 100-point composite (weight × sub-score).
- Cash flow +30.0/30.0
- ARV discount +15.0/15.0
- 1% rule +10.0/10.0
- DSCR +10.0/10.0
- Livability +3.9/5.0
- Rent growth +2.5/5.0
- Condition / age +2.5/5.0
- Schools +0.7/10.0
- Appreciation +0.0/10.0
$197,900
🖨 Deal sheet (PDF) 📄 Offer letter ✓ Due diligence
Listing remarks MLS
Fabulous location! Only blocks to both elementary, middle school, and parks. Meticulously maintained South Holland brick ranch, features include hardwood floors, large eat in kitchen, finished basement rec room, and tons of storage. Freshly painted, spotless clean, and move in ready. This home shows pride of ownership through out, don't miss this one!
Key facts
- Roof
- Storage
- Eat in kitchen
Tags
Property features AI
Finance
- Other: Ownership is fee simple; Property not currently leased; Possession available at closing or immediate; lease-back may be required
- Financial info: Special service area: No
- HOA & community: No master association fee required
Exterior
- Parking: Detached garage (garage owned) with 2 garage spaces; Concrete driveway with side driveway and garage door opener; Total parking for 2 vehicles
- Security: Carbon monoxide detectors
- Utilities: Water service from Lake Michigan; Public sewer; Electric service with circuit breakers and 100 amp service
- Home design: Detached single-family home; One-story; Built approximately 61–70 years ago; Brick exterior; Facing information not provided
- Construction: Asphalt roof; Concrete perimeter foundation; Built before 1978
- Exterior features: Lot dimensions approximately 59 x 120; Lot less than 0.25 acre; Sidewalks; Street lights; Paved street
Interior
- Kitchen: Eating area/table space; Range
- Bedrooms: 3 bedrooms (all on the main level); Master bedroom on main level
- Flooring: Hardwood flooring in living areas and bedrooms; Laminate flooring; Vinyl flooring in kitchen
- Bathrooms: 1 full bathroom; 1 half bathroom
- Heating & cooling: Natural gas forced air heating; Central air conditioning
- Interior features: 6 total rooms; Unfinished attic; Basement is full and partially finished; Ceiling fan(s); Carbon monoxide detectors; Sump pump; Gas water heater
- Laundry & utility: Laundry room in basement (8 x 16); Washer; Dryer; Gas dryer hookup
Neighborhood map
What this means for you Summary
Snapshot
- This is a 4-bed/1.5-bath single-family listed at $198k.
Deal economics
- At list price, monthly cash flow is $1k ($13k/yr) — positive.
- The deal already cash-flows at list — no discount required.
- Meets the 1% rule at list price ($3k rent vs $198k).
- Recommended offer: $180k (9.0% below list) — sets the bar for market timing.
- Cap rate 13.0% vs local median 8.4% in South Holland — top-decile yield for the area; either an underpriced asset or a hidden risk that comps aren't pricing in. Stress-test before assuming the spread holds.
Location & tenants
- Location reads 77/100 on livability (#167 in IL, #3,071 nationally) — a middle-class / working-renter tenant base. Strengths: commute A+, housing A+, cost of living A; Watch: crime C-, amenities C-.
- Thornton Twp Hsd 205 (suburban): math 7% / reading 8% proficiency, ranked #594 of 620 in IL (top 96%) — low school quality limits family demand, transient renter base, plan for 1-2y turnover.
- Zoned schools: Greenwood Elem School (math 10% / reading 10%, grade F, #1,477 of 2,056 statewide, top 74%, 326 students, 0% FRL); Mckinley Jr High School (math 8% / reading 17%, grade F, #550 of 665 statewide, top 84%, 297 students, 0% FRL); Thornwood High School (math 8% / reading 9%, grade F, #584 of 693 statewide, top 85%, 1,996 students, 0% FRL).
- Market conditions: 135 active listings in the ZIP; 3 comparable units currently listed for rent nearby; rentals leasing fast (median 1d on market — plan ~1-2 weeks tenant-placement turnaround); 6,272 units permitted in Cook County in 2024 (4,658 in 5+ unit buildings).
Forward outlook
- Local home prices are declining (-3.0%/yr); year-one equity from $1k of loan paydown is wiped out by about $6k of value loss. Plan a longer hold.
- At projected returns (-3.0% appreciation + 3.0% rent growth), your $55k cash investment doubles in ~6 years — after that, you're playing with house money.
Negotiation context
- It's been on market 106 days — a 9% lower offer ($180k) is reasonable based on typical stale-listing flexibility.
- 4 sale attempts since 14y ago; this cycle's ask has dropped $15k (7%) from the opening price — seller is motivated, your offer sets the floor, not the list.
- Current owner paid $105k; list at $198k implies a 88% gain — meaningful room to come down on a strong offer.
Questions for the listing agent
- It's been on market 106 days. Have you received any prior offers? Is the seller open to a 9% concession, seller financing, or rate buy-down credit?
- Built in 1961 — when were the roof, HVAC, electrical panel, plumbing, and water heater last replaced?
- Why hasn't it sold? Are there any deal-killer items the seller is aware of (foundation, flood, title, zoning, code violations)?
- Is there a deadline driving the sale (1031 exchange, divorce, estate, relocation)? That informs how much negotiation room exists.
- Schools are D-rated, which usually means shorter tenancies and higher turnover. Who's the typical renter profile here, and what's been the actual vacancy rate?
- What's the average days-on-market for RENTAL listings here right now (not sales)? A rising rental-DOM trend means longer vacancies and softer asking-rent achievability than the comps imply.
- What's the recent tenant-quality profile in this submarket — average credit score on applications, eviction rate, late-payment / NSF rate, and stable-employment percentage? A property-management company in the area should have these aggregated.
- How much new for-sale + rental construction is in the pipeline within 1–3 miles? Heavy new supply typically softens prices + rents 12–24 months out; constrained supply supports both.
Investment metrics
- 1% rule
- 1.60% ✓
- Cap rate
- 13.03%
- Cash-on-cash
- 24.06%
- DSCR
- 2.07
- GRM
- 5.2
CMA / ARV
- ARV (on-the-fly)
- $243,757
- Comps found
- 12
Show comp detail 12 sales within ~0.75 mi
| Address | Dist | Beds/Ba | Sqft | Sold | Price | $/sf | Match |
|---|---|---|---|---|---|---|---|
| 16549 Cottage Grove Ave | 0.12mi | 3/2.0 (-1) | 1,426 (+1%) | 2mo | $219,500 | $154 | 84 |
| 16916 Kimbark Ave | 0.62mi | 4/2.0 | 1,397 (-1%) | 1mo | $283,000 | $203 | 67 |
| 702 E 162nd Pl | 0.57mi | 3/2.0 (-1) | 1,400 (-1%) | 1mo | $230,000 | $164 | 64 |
| 459 E 166th St | 0.44mi | 4/2.0 | 1,300 (-8%) | 1mo | $235,000 | $181 | 64 |
| 16712 Elm St | 0.51mi | 3/2.0 (-1) | 1,446 (+3%) | 2mo | $191,000 | $132 | 63 |
| 16927 Langley Ave | 0.37mi | 3/1.5 (-1) | 1,288 (-9%) | 1mo | $179,900 | $140 | 62 |
| 16535 S Elm Ct | 0.49mi | 4/2.0 | 1,540 (+9%) | 2mo | $235,000 | $153 | 58 |
| 1241 E 168th St | 0.57mi | 3/3.0 (-1) | 1,331 (-6%) | 2mo | $230,000 | $173 | 52 |
| 1006 E 163rd St | 0.52mi | 3/2.0 (-1) | 1,263 (-10%) | 1mo | $262,500 | $208 | 51 |
| 16827 Parkside Ave | 0.36mi | 3/2.5 (-1) | 1,613 (+14%) | 1mo | $220,000 | $136 | 50 |
| 16417 Claire Ln | 0.46mi | 3/2.5 (-1) | 1,209 (-14%) | 2mo | $254,995 | $211 | 45 |
| 17121 Ingleside Ave | 0.58mi | 3/2.0 (-1) | 1,215 (-14%) | 0mo | $225,000 | $185 | 43 |
Match score weights: distance 35% · size 25% · config 20% · recency 20%. Top-matched comps best support the ARV.
Projected returns pro-forma
-3.0% appreciation · 3.0% rent growth · sell at horizon
- IRR
- 17.3%
- Equity multiple
- 1.70×
- Total profit
- $38,744
- Equity at exit
- $29,508
- IRR
- 25.8%
- Equity multiple
- 3.26×
- Total profit
- $125,101
- Equity at exit
- $17,111
Cash invested: $55,412 (down + closing). Projections, not guarantees.
Landlord ↔ Tenant lean methodology
- Overall (STATE)
- 43 Moderately Tenant-Leaning
- State Illinois
- 43 Moderately Tenant-Leaning · D+7
- County
- — inherits STATE
- City
- — inherits STATE
ZIP-level market 60473
- Active inventory
- 135
- Price-to-rent
- 5.2×
Monthly cashflow live
- Estimated rent
- $3,174 medium interval (Pro) →
- Mortgage (P&I)
- −$1,038
- Tax from tax record
- −$276 /mo · $3,314/yr
- Insurance
- −$82
- HOA
- −$0
- Vacancy / Maint / Mgmt
- −$666
- Net cashflow
- $1,111
Break-even live
Sensitivity live
| Price | -10% $1,223 | -5% $1,167 | +0% $1,111 | +5% $1,055 | +10% $999 |
|---|---|---|---|---|---|
| Rent | -10% $860 | -5% $985 | +0% $1,111 | +5% $1,236 | +10% $1,362 |
| Rate | -1.0pp $1,210 | -0.5pp $1,161 | base $1,111 | +0.5pp $1,060 | +1.0pp $1,007 |
UW: 25.0% down · 7.5% · 30yr · 1.5% tax · 5.0% vac · 8.0% maint · 8.0% mgmt
Financing live
Cash to close
- Down payment
- $49,475
- Closing costs
- $5,937
- Reserves months
- —
- Total cash needed
- —
Loan-product check · same deal, 3 products live
Conventional
25% down · 7.5% · 30yr
- Down + closing
- —
- Monthly P&I
- —
- Monthly cashflow
- —
- DSCR
- —
- Eligible?
- —
Personal DTI + credit; lowest rate.
DSCR
20% down · 8.5% · 30yr
- Down + closing
- —
- Monthly P&I
- —
- Monthly cashflow
- —
- DSCR
- —
- Eligible?
- —
No personal income docs; deal must DSCR.
Hard money
10% down · 12.0% · 12mo
- Down + closing
- —
- Monthly P&I
- —
- Monthly cashflow
- —
- DSCR
- —
- Eligible?
- —
Short-term bridge; refi at stabilization.
Rent comps 3 comps
| Address | Beds | Baths | Sqft | Rent | $/sqft | DOM | Units | Dist |
|---|---|---|---|---|---|---|---|---|
| 16246 Dobson Ave South Holland, IL | 3.0 | 2.0 | 1250 | $3,170 | $2.54 | 0d | 1 | 0.57mi |
| 16001 Avalon Ave South Holland, IL | 3.0 | 2.0 | 1136 | $3,330 | $2.93 | 8d | 1 | 1.01mi |
| 15707 Dante Dr South Holland, IL | 3.0 | 2.0 | 1800 | $2,950 | $1.64 | 0d | 1 | 1.47mi |
Listing history 13 events
-
2026-04-27price $197,900
-
2026-04-08price $199,900
-
2026-03-21price $204,900
-
2026-02-12$212,900 Active
-
2026-02-12historical
-
2026-02-03status Active
-
2025-12-30status Pending
-
2025-12-08historical Contingent - Continue to Show
-
2025-10-31price
-
2025-09-17Active
-
2013-04-22soldstatus $105,000 Closed Sale 353-char remark
Show marketing remark (353 chars)
Fabulous location! Only blocks to both elementary, middle school, and parks. Meticulously maintained South Holland brick ranch, features include hardwood floors, large eat in kitchen, finished basement rec room, and tons of storage. Freshly painted, spotless clean, and move in ready. This home shows pride of ownership through out, don't miss this one!
-
2013-01-31historical Contingent 353-char remark
Show marketing remark (353 chars)
Fabulous location! Only blocks to both elementary, middle school, and parks. Meticulously maintained South Holland brick ranch, features include hardwood floors, large eat in kitchen, finished basement rec room, and tons of storage. Freshly painted, spotless clean, and move in ready. This home shows pride of ownership through out, don't miss this one!
-
2012-12-07$119,900 New 353-char remark
Show marketing remark (353 chars)
Fabulous location! Only blocks to both elementary, middle school, and parks. Meticulously maintained South Holland brick ranch, features include hardwood floors, large eat in kitchen, finished basement rec room, and tons of storage. Freshly painted, spotless clean, and move in ready. This home shows pride of ownership through out, don't miss this one!
ⓘ Source: listings_history table (triggers on properties + properties_extension) + one-shot
backfill from property_details.listing_events for pre-trigger history.
Tax reassessment forecast IL · Partial reset (capped growth)
- Current annual tax
- $3,314 · $276/mo
- Projected year-2 tax
- $3,903 · $325/mo
- Expected delta
- +$589/yr (+$49/mo · 17.8%)
ⓘ Screening estimate from a state-policy table — verify with the county assessor before closing.
Climate risk First Street
- Flood 1/10 Low FEMA zone X (unshaded) · 0% chance over 30 yrs
- Wildfire 1/10 Low
- Heat 3/10 Moderate 7 d/yr ≥103°F today · 15 d/yr by 30 yrs out
- Wind 2/10 Low
- Air quality 4/10 Moderate 4 unhealthy d/yr today · 5 by 30 yrs out
Nearby sold comps map
Loading sold comps map…
Walkable amenities ~0.75 mi
Loading nearby amenities…
Taxation est. · year 1
- Rental income
- $38,084
- − Mortgage interest
- −$11,085
- − Property taxes
- −$3,314
- − Insurance
- −$990
- − Repairs & maintenance
- −$3,047
- − Management
- −$3,047
- − Depreciation
- −$5,757
- Taxable income
- $10,845
- Est. tax owed @ 24.0%
- −$2,603
- After-tax cash flow
- $10,727/yr
For passive investors: Depreciation is non-cash, so a rental often shows a tax loss while cash-flowing — sheltering income. Rental losses are passive: they offset passive income freely, and up to $25,000/yr can offset ordinary (W-2) income if you actively participate and your MAGI is under $100k (phasing out to $0 by $150k); unused losses carry forward. On sale, claimed depreciation is recaptured at up to 25%, and gains may owe capital-gains tax (a 1031 exchange can defer both). Figures are a year-1 estimate at your 24.0% rate — not tax advice; consult a CPA.
Schools (NCES district)
- District
- Thornton Twp Hsd 205
- NCES district ID
- 1738970
- Math proficiency
- 7% ▬ 0.00%
- Reading proficiency
- 8% ▼ -2.00%
- Median HH income
- $43,392
- Composite
- 6.92/100
- National rank
- #9976
- State rank
- #594 of 620 in IL
Livability — South Holland
- Score
- 77/100
- State rank
- #167
- US rank
- #3071
Category grades
Schools grade is shown separately in the Schools card above.
Census & demographics
- Census place
- South Holland, IL
- City population
- 21,407
- Population (ZIP)
- 21,407
Population outlook (Cook County) Hauer SSP2
- Today (2025)
- 5,347,519 people
- By 2030
- 5,357,703 · +0.2%
- By 2040
- 5,324,924 · -0.4%
- By 2050
- 5,230,762 · -2.2%
- By 2075
- 4,785,735 · -10.5%
- By 2100
- 4,188,836 · -21.7%
Race, ethnicity, and origin ACS 2023
- Neighborhood character
- Predominantly Black (75%)
- Race & ethnicity
- Black 75% White 10% Hispanic / Latino 10% Two or more races 3% Asian 1%
- Hispanic origin (detail)
- Mexican 9% Puerto Rican 1%
- Common ancestry
- Iranian 3% Romanian 2%
- Foreign-born
- 6% · Canada, China
- Languages at home
- 87% English-only · Spanish 8% Other Asian/Pacific 1% Russian/Polish/Slavic 1%
Political lean MEDSL · Cook
- 2024 margin
- Solid D (+42.0) · D 70.4% · R 28.4% · Other 1.2%
- 2008→2024 swing
- -11.4pp toward R · 2008: 53.4pp · 2024: 42.0pp
- All cycles
- 2024: D+42.0 2020: D+50.3 2016: D+53.0 2012: D+49.4 2008: D+53.4
Not yet ingested
- Civics
- —
Market trends
- HPI YoY
- ▼ -114.36%
- Current HPI
- 201.2479
- Rent YoY
- —
- Metro
- —
- State GDP YoY
- ▲ 1.59%
- F500 in state
- 60
Industry mix (Fortune 500 HQ in IL)
| Industry | F500 HQs | Revenue |
|---|---|---|
| Insurance | 4 | $201B |
|
||
| Consumer Goods | 4 | $87B |
|
||
| Industrial Machinery | 3 | $64B |
|
||
| Healthcare | 2 | $55B |
|
||
| Retail / Pharmacy | 1 | $148B |
|
||
| Agriculture / Food | 1 | $86B |
|
||
Price history
+65.1% since first listed13 events — show timeline
- 2026-04-27 Price Changed $197,900 MRED as Distributed by MLS Grid
- 2026-04-08 Price Changed $199,900 MRED as Distributed by MLS Grid
- 2026-03-21 Price Changed $204,900 MRED as Distributed by MLS Grid
- 2026-02-12 Listing Removed — MRED as Distributed by MLS Grid
- 2026-02-12 Listed $212,900 MRED as Distributed by MLS Grid
- 2026-02-03 Relisted — MRED as Distributed by MLS Grid
- 2025-12-30 Pending — MRED as Distributed by MLS Grid
- 2025-12-08 Contingent — MRED as Distributed by MLS Grid
- 2025-10-31 Price Changed — MRED as Distributed by MLS Grid
- 2025-09-17 Listed — MRED as Distributed by MLS Grid
- 2013-04-22 Sold (MLS) $105,000 MRED as Distributed by MLS Grid
- 2013-01-31 Contingent — MRED as Distributed by MLS Grid
- 2012-12-07 Listed $119,900 MRED as Distributed by MLS Grid
Property tax history
-0.2%/yrLatest (2023): $3,314 · -24.5% YoY. Source: county tax records.
Cash-flow waterfall
monthlySold comps — $/sqft
last 12 mo · ≤1 miLoading sold comps…