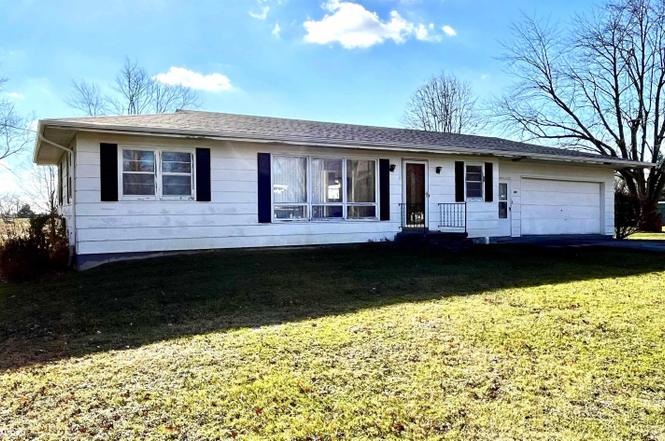
308 Guy Porter St · Humeston, IA
Flood risk 1/10 · Minimal
- FEMA flood zone
- X (unshaded)
- Chance of flooding over 30 yrs
- 0.0%
- Est. flood insurance / yr
- $473 – $860
Fire risk 3/10 · Minor
- Est. fire insurance / yr
- $902 – $1,676
Heat risk 3/10 · Minor
- Hot days now (above 104°F)
- 7 days/yr
- Hot days in 30 yrs
- 15 days/yr
Wind risk 2/10 · Minimal
- Chance of severe wind over 30 yrs
- —
Air-quality risk 2/10 · Minimal
- Unhealthy air days now
- 0 days/yr
- Unhealthy air days in 30 yrs
- 2 days/yr
Risk factors via First Street. Map © Google.
Why this score? — see what drove the F grade
The composite is a weighted blend of 9 inputs, each scored 0–100. Each bar is that input's sub-score; the figure is the points it added to the 100-point composite (weight × sub-score).
- Cash flow +10.1/30.0
- Schools +5.2/10.0
- Appreciation +5.0/10.0
- Livability +3.2/5.0
- DSCR +2.9/10.0
- 1% rule +2.5/10.0
- Rent growth +2.5/5.0
- Condition / age +2.5/5.0
- ARV discount +0.0/15.0
$135,000
🖨 Deal sheet 📄 Offer letter ✓ Due diligence
Listing remarks
Nice in town acreage! This ranch style home sits on almost 2 1/2 acres located on the south side of Humeston. This two bedroom (plus one small room that could be a bedroom or office) has one full bath and an attached garage. There is an additional parcel also included that has a detached 2 car garage. Sit out on the back deck and enjoy the country views, while being in town. This home does need some TLC and is a bit of a fixer upper, but has the potential to be a very nice home.
Key facts
- Ranch style home
- Back deck
- Country views
Tags
Property features AI
Exterior
- Parking: Attached garage; Detached garage; Gravel parking; 1 garage space
- Utilities: Public water; Public sewer
- Home design: Residential property; Unimproved land
- Construction: Wood siding
- Exterior features: Public water; Public sewer; Lot is approximately 2.26 acres
Interior
- Bathrooms: 1 full bathroom
- Heating & cooling: Baseboard heating; No central cooling
- Interior features: Basement
Neighborhood map
What this means for you Summary
Snapshot
- This is a 2-bed/1.0-bath single-family listed at $135k.
Deal economics
- At list price, monthly cash flow is $-79 ($-944/yr) — negative.
- To cash-flow at today's rent, offer at most $121k (10.3% below list).
- To meet the 1% rule (rent ≥ 1% of price), the offer needs to be $101k (25.3% below list).
- Recommended offer: $101k (25.3% below list) — sets the bar for 1% rule.
Location & tenants
- Location reads 64/100 on livability (#623 in IA) — a middle-class / working-renter tenant base. Strengths: cost of living A+, housing A+; Watch: crime C-, employment D+, amenities F.
- Mormon Trail Community School District (rural): math 55% / reading 65% proficiency, ranked #284 of 330 in IA (top 86%) — acceptable for families but not a draw, mixed tenant base, ~2y average lease.
- Market conditions: 5 active listings in the ZIP; 6 units permitted in Wayne County in 2024 (0 in 5+ unit buildings).
Forward outlook
- In year one you build about $5k of equity ($933 loan paydown + $4k appreciation (3.0% local appreciation)).
- Wayne County population projected to shrink 8% by 2050 — rents likely to lag national; underwrite the cash flow, not the appreciation.
- At projected returns (3.0% appreciation + 3.0% rent growth), your $38k cash investment doubles in ~7 years — after that, you're playing with house money.
- By year 7, paydown + projected appreciation supports a ~$32k cash-out refi (75% LTV) — recoverable capital for the next deal without selling this one.
Negotiation context
- It's been on market 154 days — a 12% lower offer ($119k) is reasonable based on typical stale-listing flexibility.
Questions for the listing agent
- What do current leases actually rent for vs. the listed asking? Can we see a recent rent roll and the last 12 months of T-12 income?
- It's been on market 154 days. Have you received any prior offers? Is the seller open to a 25% concession, seller financing, or rate buy-down credit?
- Built in 1968 — when were the roof, HVAC, electrical panel, plumbing, and water heater last replaced?
- Why hasn't it sold? Are there any deal-killer items the seller is aware of (foundation, flood, title, zoning, code violations)?
- Is there a deadline driving the sale (1031 exchange, divorce, estate, relocation)? That informs how much negotiation room exists.
- The area grade is low — what's the realistic commute time and amenity access for the typical tenant pool here? Any planned neighborhood developments (good or bad) we should know about?
- What's the average days-on-market for RENTAL listings here right now (not sales)? A rising rental-DOM trend means longer vacancies and softer asking-rent achievability than the comps imply.
- What's the recent tenant-quality profile in this submarket — average credit score on applications, eviction rate, late-payment / NSF rate, and stable-employment percentage? A property-management company in the area should have these aggregated.
- How much new for-sale + rental construction is in the pipeline within 1–3 miles? Heavy new supply typically softens prices + rents 12–24 months out; constrained supply supports both.
Investment metrics
- 1% rule
- 0.75% ✗
- Cap rate
- 5.59%
- Cash-on-cash
- -2.50%
- DSCR
- 0.89
- GRM
- 11.2
CMA / ARV
- ARV (on-the-fly)
- $94,608
- Comps found
- 7
Show comp detail 7 sales within ~0.75 mi
| Address | Dist | Beds/Ba | Sqft | Sold | Price | $/sf | Match |
|---|---|---|---|---|---|---|---|
| 314 4th St S | 0.08mi | 2/1.5 | 1,173 (+0%) | 16mo | $95,000 | $81 | 80 |
| 316 S Eaton Ave | 0.12mi | 2/1.5 | 1,176 (+1%) | 13mo | $161,000 | $137 | 80 |
| 314 S Front St | 0.19mi | 2/1.0 | 1,126 (-4%) | 8mo | $15,000 | $13 | 78 |
| 430 S Front St | 0.19mi | 2/1.0 | 1,330 (+14%) | 0mo | $60,000 | $45 | 68 |
| 128 N 4th St N | 0.30mi | 2/1.5 | 1,008 (-14%) | 3mo | $120,000 | $119 | 59 |
| 404 Guy Porter St | 0.06mi | 3/1.0 (+1) | 1,276 (+9%) | 22mo | $117,000 | $92 | 58 |
| 322 Winter St | 0.38mi | 3/1.0 (+1) | 1,046 (-10%) | 9mo | $60,000 | $57 | 52 |
Match score weights: distance 35% · size 25% · config 20% · recency 20%. Top-matched comps best support the ARV.
Projected returns pro-forma
3.0% appreciation · 3.0% rent growth · sell at horizon
- IRR
- 5.2%
- Equity multiple
- 1.30×
- Total profit
- $11,233
- Equity at exit
- $60,702
- IRR
- 8.2%
- Equity multiple
- 2.24×
- Total profit
- $47,003
- Equity at exit
- $93,549
Cash invested: $37,800 (down + closing). Projections, not guarantees.
Landlord ↔ Tenant lean methodology
- Overall (STATE)
- 83 Strongly Landlord-Friendly
- State Iowa
- 83 Strongly Landlord-Friendly · R+6
- County
- — inherits STATE
- City
- — inherits STATE
ZIP-level market 50123
- Active inventory
- 5
- Price-to-rent
- 11.2×
Monthly cashflow live
- Estimated rent
- $1,009 medium interval (Pro) →
- Mortgage (P&I)
- −$708
- Tax from tax record
- −$111 /mo · $1,334/yr
- Insurance
- −$56
- HOA
- −$0
- Vacancy / Maint / Mgmt
- −$212
- Net cashflow
- $-79
Break-even live
UW: 25.0% down · 7.5% · 30yr · 1.5% tax · 5.0% vac · 8.0% maint · 8.0% mgmt
Financing live
Cash to close
- Down payment
- $33,750
- Closing costs
- $4,050
- Reserves months
- —
- Total cash needed
- —
Loan-product check · same deal, 3 products live
Conventional
25% down · 7.5% · 30yr
- Down + closing
- —
- Monthly P&I
- —
- Monthly cashflow
- —
- DSCR
- —
- Eligible?
- —
Personal DTI + credit; lowest rate.
DSCR
20% down · 8.5% · 30yr
- Down + closing
- —
- Monthly P&I
- —
- Monthly cashflow
- —
- DSCR
- —
- Eligible?
- —
No personal income docs; deal must DSCR.
Hard money
10% down · 12.0% · 12mo
- Down + closing
- —
- Monthly P&I
- —
- Monthly cashflow
- —
- DSCR
- —
- Eligible?
- —
Short-term bridge; refi at stabilization.
Listing history 3 events
-
2026-04-29status Pending
-
2026-02-26historical Active Under Contract
-
2025-11-26$135,000 Active
ⓘ Source: listings_history table (triggers on properties + properties_extension) + one-shot
backfill from property_details.listing_events for pre-trigger history.
Tax reassessment forecast IA · Partial reset (capped growth)
- Current annual tax
- $1,334 · $111/mo
- Projected year-2 tax
- $1,727 · $144/mo
- Expected delta
- +$393/yr (+$33/mo · 29.4%)
ⓘ Screening estimate from a state-policy table — verify with the county assessor before closing.
Climate risk First Street
- Flood 1/10 Low FEMA zone X (unshaded) · 0% chance over 30 yrs
- Wildfire 3/10 Moderate
- Heat 3/10 Moderate 7 d/yr ≥104°F today · 15 d/yr by 30 yrs out
- Wind 2/10 Low
- Air quality 2/10 Low 0 unhealthy d/yr today · 2 by 30 yrs out
Nearby sold comps map
Loading sold comps map…
Walkable amenities ~0.75 mi
Loading nearby amenities…
Taxation est. · year 1
- Rental income
- $12,102
- − Mortgage interest
- −$7,562
- − Property taxes
- −$1,334
- − Insurance
- −$675
- − Repairs & maintenance
- −$968
- − Management
- −$968
- − Depreciation
- −$3,927
- Taxable loss
- −$3,333
- Est. tax savings @ 24.0%
- +$800
- After-tax cash flow
- $-144/yr
For passive investors: Depreciation is non-cash, so a rental often shows a tax loss while cash-flowing — sheltering income. Rental losses are passive: they offset passive income freely, and up to $25,000/yr can offset ordinary (W-2) income if you actively participate and your MAGI is under $100k (phasing out to $0 by $150k); unused losses carry forward. On sale, claimed depreciation is recaptured at up to 25%, and gains may owe capital-gains tax (a 1031 exchange can defer both). Figures are a year-1 estimate at your 24.0% rate — not tax advice; consult a CPA.
Schools (NCES district)
- District
- Mormon Trail Community School District
- NCES district ID
- 1919740
- Math proficiency
- 55% ▼ -10.00%
- Reading proficiency
- 65% ▬ 0.00%
- Median HH income
- $46,693
- Composite
- 52.35/100
- National rank
- #3427
- State rank
- #284 of 330 in IA
Livability — Humeston
- Score
- 64/100
- State rank
- #623
- US rank
- #14366
Category grades
Schools grade is shown separately in the Schools card above.
Census & demographics
- Census place
- Humeston, IA
- Population (ZIP)
- 863
Population outlook (Wayne County) Hauer SSP2
- Today (2025)
- 6,213 people
- By 2030
- 6,109 · -1.7%
- By 2040
- 5,926 · -4.6%
- By 2050
- 5,716 · -8.0%
- By 2075
- 5,502 · -11.4%
- By 2100
- 4,890 · -21.3%
Race, ethnicity, and origin ACS 2023
- Neighborhood character
- Predominantly White (92%)
- Race & ethnicity
- White 92% Hispanic / Latino 6% Two or more races 5%
- Hispanic origin (detail)
- Mexican 4% Dominican 2%
- Common ancestry
- Portuguese 3% Slovak 1% Romanian 1%
- Foreign-born
- 3% · Canada
- Languages at home
- 96% English-only · Spanish 4%
Political lean MEDSL · Wayne
- 2024 margin
- Solid R (+57.2) · D 20.6% · R 77.8% · Other 1.6%
- 2008→2024 swing
- -50.2pp toward R · 2008: -7.0pp · 2024: -57.2pp
- All cycles
- 2024: R+57.2 2020: R+51.8 2016: R+46.2 2012: R+11.5 2008: R+7.0
Not yet ingested
- Civics
- —
Market trends
- HPI YoY
- —
- Current HPI
- —
- Rent YoY
- —
- Metro
- —
- State GDP YoY
- ▲ 2.48%
- F500 in state
- 4
Industry mix (Fortune 500 HQ in IA)
| Industry | F500 HQs | Revenue |
|---|---|---|
| Financial Services | 1 | $16B |
|
||
| Retail / Convenience | 1 | $15B |
|
||
Price history
3 events — show timeline
- 2026-04-29 Pending — IAR
- 2026-02-26 Contingent — IAR
- 2025-11-26 Listed $135,000 IAR
Property tax history
-1.0%/yrLatest (2025): $1,334 · -3.2% YoY. Source: county tax records.
Cash-flow waterfall
monthlySold comps — $/sqft
last 12 mo · ≤1 miLoading sold comps…