527-529 34TH St Unit D2 · Union City, NJ
Flood risk No data
- FEMA flood zone
- —
- Chance of flooding over 30 yrs
- —
- Est. flood insurance / yr
- —
Fire risk No data
- Est. fire insurance / yr
- —
Heat risk No data
- Hot days now (above threshold)
- —
- Hot days in 30 yrs
- —
Wind risk No data
- Chance of severe wind over 30 yrs
- —
Air-quality risk No data
- Unhealthy air days now
- —
- Unhealthy air days in 30 yrs
- —
Risk factors via First Street. Map © Google.
Why this score? — see what drove the C grade
The composite is a weighted blend of 9 inputs, each scored 0–100. Each bar is that input's sub-score; the figure is the points it added to the 100-point composite (weight × sub-score).
- ARV discount +15.0/15.0
- Cash flow +12.1/30.0
- Appreciation +10.0/10.0
- 1% rule +6.5/10.0
- Livability +3.9/5.0
- Condition / age +3.8/5.0
- DSCR +3.6/10.0
- Rent growth +2.7/5.0
- Schools +2.2/10.0
$192,600
🖨 Deal sheet 📄 Offer letter ✓ Due diligence
Listing remarks MLS
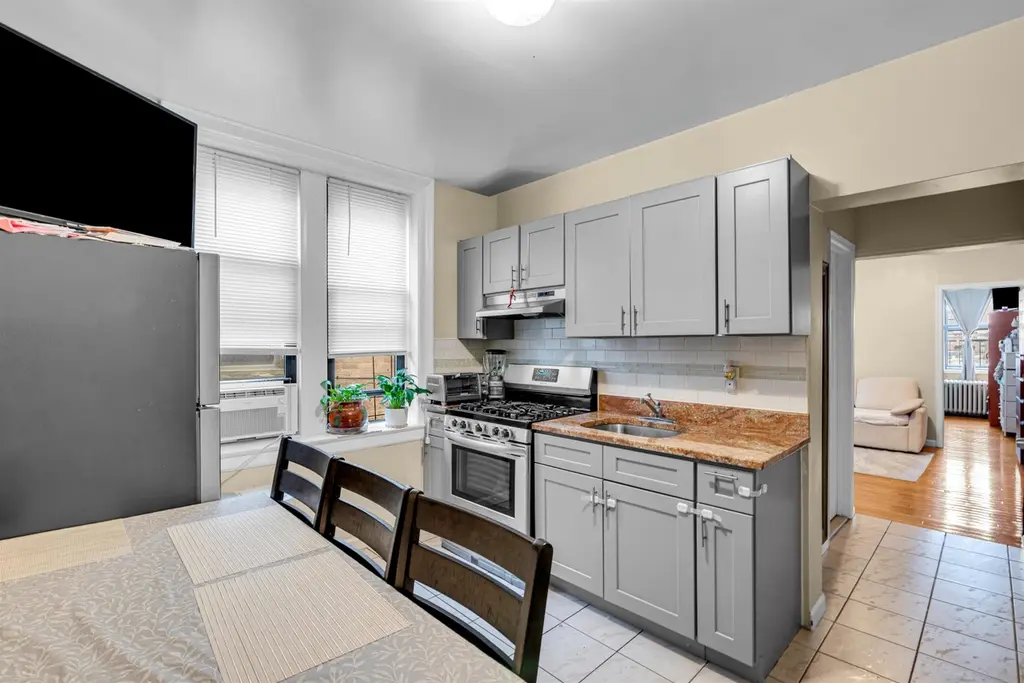
Renovated condo in excellent location! Quiet street but close to everything. Features new kitchen and bathroom, beautiful hardwood floors, and is only 10-15 minutes from Lincoln Tunnel into Manhattan. Close to stores, restaurants, public transportation, schools, and houses of worship.
Key facts
- New kitchen
- New bathroom
- Renovated condo
Tags
Neighborhood map
What this means for you Summary
Snapshot
- This is a 1-bed/1.0-bath condo listed at $193k. Condition is rated good.
Deal economics
- At list price, monthly cash flow is $-43 ($-512/yr) — negative.
- To cash-flow at today's rent, offer at most $186k (3.2% below list).
- Meets the 1% rule at list price ($2k rent vs $193k).
- Recommended offer: $175k (9.0% below list) — sets the bar for market timing.
- Cap rate 6.0% vs local median 2.3% in Union City — top-decile yield for the area; either an underpriced asset or a hidden risk that comps aren't pricing in. Stress-test before assuming the spread holds.
Location & tenants
- Location reads 77/100 on livability (#117 in NJ, #2,998 nationally) — a middle-class / working-renter tenant base. Strengths: amenities A+, commute A+, health & safety A; Watch: cost of living F.
- Union City School District (suburban): math 15% / reading 36% proficiency, ranked #399 of 472 in NJ (top 84%) — low school quality limits family demand, transient renter base, plan for 1-2y turnover; 85% free/reduced lunch — lower-income household profile, screen leases tightly.
- Market conditions: Rents flat; 226 active listings in the ZIP; 4 comparable units currently listed for rent nearby; rentals at typical pace (median 24d on market — plan ~3-4 weeks tenant-placement turnaround); 5,310 units permitted in Hudson County in 2024 (4,154 in 5+ unit buildings).
- This rent runs 41% of the median local income ($64k/yr) — at the standard rent-burdened threshold; future hikes will face affordability resistance.
Forward outlook
- In year one you build about $21k of equity ($1k loan paydown + $19k appreciation (10.0% local appreciation)).
- Hudson County population projected at +29% by 2050 — long-run rental-demand tailwind backs the buy-and-hold thesis.
- At projected returns (10.0% appreciation + 0.9% rent growth), your $54k cash investment doubles in ~3 years — after that, you're playing with house money.
- By year 2, paydown + projected appreciation supports a ~$33k cash-out refi (75% LTV) — recoverable capital for the next deal without selling this one.
Negotiation context
- It's been on market 114 days — a 9% lower offer ($175k) is reasonable based on typical stale-listing flexibility.
- 2 sale attempts with the ask held roughly flat each time — persistent listings suggest the price (not the market) is what's stuck; bring a comps-based counter.
Risks & watch-outs
- Watch-outs: HOA is 21% of rent.
Questions for the listing agent
- What do current leases actually rent for vs. the listed asking? Can we see a recent rent roll and the last 12 months of T-12 income?
- It's been on market 114 days. Have you received any prior offers? Is the seller open to a 9% concession, seller financing, or rate buy-down credit?
- What does the HOA fee cover, when was the last increase, and are there any pending special assessments or reserve-fund shortfalls?
- Any open or pending special assessments — roof, HVAC, plumbing, elevator, façade? What's the per-unit balance and payoff schedule, and is the seller paying it off at close or rolling it to the buyer?
- Why hasn't it sold? Are there any deal-killer items the seller is aware of (foundation, flood, title, zoning, code violations)?
- Is there a deadline driving the sale (1031 exchange, divorce, estate, relocation)? That informs how much negotiation room exists.
- What's the average days-on-market for RENTAL listings here right now (not sales)? A rising rental-DOM trend means longer vacancies and softer asking-rent achievability than the comps imply.
- What's the recent tenant-quality profile in this submarket — average credit score on applications, eviction rate, late-payment / NSF rate, and stable-employment percentage? A property-management company in the area should have these aggregated.
- How much new apartment / multifamily construction is in the pipeline within 1–3 miles? Heavy new supply (>2% of stock underway) typically softens rents 12–24 months out; light construction supports rent growth.
Investment metrics
- 1% rule
- 1.15% ✓
- Cap rate
- 6.03%
- Cash-on-cash
- -0.95%
- DSCR
- 0.96
- GRM
- 7.3
CMA / ARV
- ARV (median comp)
- $261,582
- List price
- $192,600
- Delta
- -26.37%
- Verdict
- UNDERPRICED
- Comps
- 20 within 1.0 mi
Projected returns pro-forma
10.0% appreciation · 0.89% rent growth · sell at horizon
- IRR
- 22.7%
- Equity multiple
- 2.82×
- Total profit
- $97,900
- Equity at exit
- $173,509
- IRR
- 19.7%
- Equity multiple
- 6.24×
- Total profit
- $282,517
- Equity at exit
- $374,179
Cash invested: $53,928 (down + closing). Projections, not guarantees.
Landlord ↔ Tenant lean methodology
- Overall (STATE)
- 21 Tenant-Leaning
- State New Jersey
- 21 Tenant-Leaning · D+6
- County
- — inherits STATE
- City
- — inherits STATE
ZIP-level market 07087
- Home prices YoY
- 9.6%
- Rents YoY
- 0.9%
- Active inventory
- 226
- Price-to-rent
- 7.3×
Monthly cashflow live
- Estimated rent
- $2,209 medium interval (Pro) →
- Mortgage (P&I)
- −$1,010
- Tax est. 1.5%
- −$241 /mo · $2,889/yr
- Insurance
- −$80
- HOA
- −$457
- Vacancy / Maint / Mgmt
- −$464
- Net cashflow
- $-43
Break-even live
UW: 25.0% down · 7.5% · 30yr · 1.5% tax · 5.0% vac · 8.0% maint · 8.0% mgmt
Financing live
Cash to close
- Down payment
- $48,150
- Closing costs
- $5,778
- Reserves months
- —
- Total cash needed
- —
Loan-product check · same deal, 3 products live
Conventional
25% down · 7.5% · 30yr
- Down + closing
- —
- Monthly P&I
- —
- Monthly cashflow
- —
- DSCR
- —
- Eligible?
- —
Personal DTI + credit; lowest rate.
DSCR
20% down · 8.5% · 30yr
- Down + closing
- —
- Monthly P&I
- —
- Monthly cashflow
- —
- DSCR
- —
- Eligible?
- —
No personal income docs; deal must DSCR.
Hard money
10% down · 12.0% · 12mo
- Down + closing
- —
- Monthly P&I
- —
- Monthly cashflow
- —
- DSCR
- —
- Eligible?
- —
Short-term bridge; refi at stabilization.
Rent comps 4 comps
| Address | Beds | Baths | Sqft | Rent | $/sqft | DOM | Units | Dist |
|---|---|---|---|---|---|---|---|---|
| 213 48th St Unit 4A Union City, NJ | 1.0 | 1.0 | 360 | $1,825 | $5.07 | 43d | 1 | 0.76mi |
| 1 Plaza Dr Secaucus, NJ | — | 1.0 | 300 | $3,089 | $10.30 | 24d | 1 | 1.04mi |
| 510 10th St Unit Ground 1 Union City, NJ | — | 1.0 | 360 | $1,700 | $4.72 | 13d | 1 | 1.10mi |
| 1217 Washington St Hoboken, NJ | 3.0 | 1.0 | 547 | $3,033 | $5.55 | 4d | 3 | 1.46mi |
HOA detail condo
- Monthly dues
- $457 · $5,484/yr
- Assessments
- None detected in remarks — confirm with the listing agent.
Listing history 16 events
-
2026-06-18days on market $192,600 Active 114 DOM
-
2026-06-17days on market $192,600 Active 113 DOM
-
2026-06-16days on market $192,600 Active 112 DOM
-
2026-06-15days on market $192,600 Active 111 DOM
-
2026-06-13days on market $192,600 Active 109 DOM
-
2026-06-13days on market $192,600 Active 108 DOM
-
2026-06-09days on market $192,600 Active 105 DOM
-
2026-06-08days on market $192,600 Active 104 DOM
-
2026-06-07days on market $192,600 Active 103 DOM
-
2026-06-04days on market $192,600 Active 100 DOM
-
2026-06-03days on market $192,600 Active 99 DOM
-
2026-06-02days on market $192,600 Active 98 DOM
-
2026-06-01days on market $192,600 Active 97 DOM
-
2026-05-31days on market $192,600 Active 96 DOM
-
2026-02-25$192,600 Active 285-char remark
Show marketing remark (285 chars)
Renovated condo in excellent location! Quiet street but close to everything. Features new kitchen and bathroom, beautiful hardwood floors, and is only 10-15 minutes from Lincoln Tunnel into Manhattan. Close to stores, restaurants, public transportation, schools, and houses of worship.
-
2026-02-23$192,600 Active 253-char remark
Show marketing remark (253 chars)
"Renovated condo in excellent location! Features new kitchen and bathroom, beautiful hardwood floors, and is only 10-15 minutes from Lincoln Tunnel into Manhattan. Close to stores, restaurants, public transportation, schools, and houses of worship.
ⓘ Source: listings_history table (triggers on properties + properties_extension) + one-shot
backfill from property_details.listing_events for pre-trigger history.
Nearby sold comps map
Loading sold comps map…
Walkable amenities ~0.75 mi
Loading nearby amenities…
Taxation est. · year 1
- Rental income
- $26,512
- − Mortgage interest
- −$10,789
- − Property taxes
- −$2,889
- − Insurance
- −$963
- − Repairs & maintenance
- −$2,121
- − Management
- −$2,121
- − HOA
- −$5,484
- − Depreciation
- −$5,603
- Taxable loss
- −$3,457
- Est. tax savings @ 24.0%
- +$830
- After-tax cash flow
- $318/yr
For passive investors: Depreciation is non-cash, so a rental often shows a tax loss while cash-flowing — sheltering income. Rental losses are passive: they offset passive income freely, and up to $25,000/yr can offset ordinary (W-2) income if you actively participate and your MAGI is under $100k (phasing out to $0 by $150k); unused losses carry forward. On sale, claimed depreciation is recaptured at up to 25%, and gains may owe capital-gains tax (a 1031 exchange can defer both). Figures are a year-1 estimate at your 24.0% rate — not tax advice; consult a CPA.
Condition & rehab AI · 12 photos
This renovated condo is in excellent condition with new kitchen and bathroom, hardwood floors, and is conveniently located near Manhattan.
Value-add opportunities
- Both Paint interior walls — Neutral paint can be updated to a more modern color scheme
- Both Replace kitchen faucet — Modern faucet can enhance the kitchen's appearance
- Both Install new light fixtures — Light fixtures can improve the home's ambiance and energy efficiency
Renovation cost estimate screening
Value-add ROI direction
- Both Paint interior walls — Neutral paint can be updated to a more modern color scheme ↑
- Both Replace kitchen faucet — Modern faucet can enhance the kitchen's appearance ↑
- Both Install new light fixtures — Light fixtures can improve the home's ambiance and energy efficiency ↑
ⓘ Cost ranges are severity-bucket heuristics (US national rule-of-thumb). Get contractor quotes + a written scope before underwriting a rehab budget.
Schools (NCES district)
- District
- Union City School District
- NCES district ID
- 3416380
- Math proficiency
- 15% ▼ -19.00%
- Reading proficiency
- 36% ▼ -19.00%
- Median HH income
- $41,210
- Composite
- 21.55/100
- National rank
- #8312
- State rank
- #399 of 472 in NJ
Livability — Union City
- Score
- 77/100
- State rank
- #117
- US rank
- #2998
Category grades
Schools grade is shown separately in the Schools card above.
Census & demographics
- Census place
- Union City, NJ
- County
- Hudson County · 718,323 people
- City population
- 66,463
- Metro
- New York-Newark-Jersey City, NY-NJ-PA
- Population (ZIP)
- 66,463
- Household income
- $64,310
- Rent vs Own
- Severe rent burden
- 6042.0
Population outlook (Hudson County) Hauer SSP2
- Today (2025)
- 771,834 people
- By 2030
- 818,028 · +6.0%
- By 2040
- 907,866 · +17.6%
- By 2050
- 994,480 · +28.8%
- By 2075
- 1,163,301 · +50.7%
- By 2100
- 1,254,703 · +62.6%
Race, ethnicity, and origin ACS 2023
- Neighborhood character
- Predominantly Hispanic (82%)
- Race & ethnicity
- Hispanic / Latino 82% Two or more races 28% White 10% Asian 4% Black 3% Native American 2%
- Hispanic origin (detail)
- Mexican 7% Puerto Rican 8% Cuban 9% Dominican 17%
- Foreign-born
- 55% · Canada, Jamaica, China
- Languages at home
- 18% English-only · Spanish 74% Other Indo-European 2% Arabic 1%
Political lean MEDSL · Hudson
- 2024 margin
- Strong D (+28.1) · D 62.6% · R 34.6% · Other 2.8%
- 2008→2024 swing
- -18.7pp toward R · 2008: 46.7pp · 2024: 28.1pp
- All cycles
- 2024: D+28.1 2020: D+46.2 2016: D+51.8 2012: D+55.7 2008: D+46.7
Not yet ingested
- Civics
- —
Market trends
- HPI YoY
- ▲ 52.10%
- Current HPI
- 597.8126
- Rent YoY
- ▲ 0.89%
- Metro
- New York-Newark-Jersey City, NY-NJ-PA
- State GDP YoY
- ▲ 2.05%
- F500 in state
- 34
Industry mix (Fortune 500 HQ in NJ)
| Industry | F500 HQs | Revenue |
|---|---|---|
| Consumer Goods | 3 | $31B |
|
||
| Pharmaceuticals | 2 | $153B |
|
||
| Technology | 2 | $21B |
|
||
| Insurance | 2 | $20B |
|
||
| Healthcare | 2 | $19B |
|
||
| Financial Services | 1 | $70B |
|
||
Price history
+0.0% since first listed2 events — show timeline
- 2026-02-25 Listed $192,600 NJMLS
- 2026-02-23 Listed $192,600 HCMLS
Cash-flow waterfall
monthlySold comps — $/sqft
last 12 mo · ≤1 miLoading sold comps…