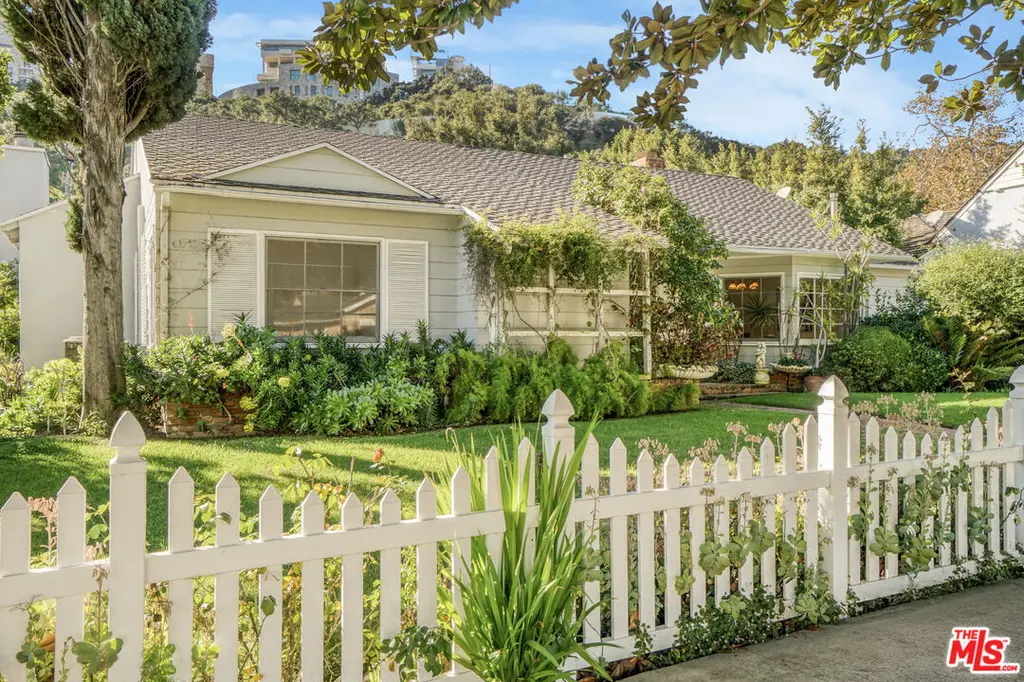
11782 Bellagio Rd · Los Angeles, CA
Flood risk 6/10 · Moderate
- FEMA flood zone
- X (unshaded)
- Chance of flooding over 30 yrs
- 0.68%
- Est. flood insurance / yr
- $507 – $1,088
Fire risk 5/10 · Moderate
- Est. fire insurance / yr
- $659 – $1,223
Heat risk 5/10 · Moderate
- Hot days now (above 86°F)
- 7 days/yr
- Hot days in 30 yrs
- 21 days/yr
Wind risk 1/10 · Minimal
- Chance of severe wind over 30 yrs
- —
Air-quality risk 4/10 · Minor
- Unhealthy air days now
- 5 days/yr
- Unhealthy air days in 30 yrs
- 5 days/yr
Risk factors via First Street. Map © Google.
Why this score? — see what drove the D grade
The composite is a weighted blend of 9 inputs, each scored 0–100. Each bar is that input's sub-score; the figure is the points it added to the 100-point composite (weight × sub-score).
- ARV discount +15.0/15.0
- Appreciation +8.2/10.0
- Cash flow +6.0/30.0
- Schools +3.6/10.0
- Livability +3.4/5.0
- Condition / age +2.5/5.0
- Rent growth +1.7/5.0
- 1% rule +0.5/10.0
- DSCR +0.4/10.0
$1,950,000
🖨 Deal sheet (PDF) 📄 Offer letter ✓ Due diligence
Listing remarks
Welcome to 11782 Bellagio Road, a rare opportunity to own a home in one of Bel Air's most desirable locations, conveniently close to the prestigious Moraga Estates gated community. This 3-bedroom, 2.5-bath residence offers a flexible floor plan, generous proportions, and exceptional potential. The house features a family room that opens to the living room, a separate formal dining room, and a well-appointed kitchen, creating distinct yet connected spaces ideal for both entertaining and everyday living. Large windows and thoughtful orientation enhance the sense of privacy and tranquility throughout the interiors. The primary suite, living room, and family room all provide direct access to th
Key facts
- 0.23 acre lot
- 2 garage spots
- Built 1950
Property features AI
Finance
- Other: Property sold/offered as-is
Exterior
- Parking: Detached 2-car garage; Two additional open parking spaces (total of 4 parking spaces)
- Utilities: Standard municipal utilities
- Home design: Detached single-family home; One level; No shared/common walls
- Construction: Detached construction
- Exterior features: Has a view; No additional detached structures
Interior
- Kitchen: Gas cooktop; Oven; Dishwasher; Refrigerator; Garbage disposal
- Bedrooms: Bedrooms on one level
- Flooring: Hardwood floors; Carpeting; Other flooring
- Bathrooms: Two full bathrooms; One half bathroom; Double vanities; Shower and tub combination; Separate shower stall; Tub
- Heating & cooling: Central heating; Central cooling
- Interior features: Two fireplaces; Built-in shelving
- Laundry & utility: Indoor laundry area; Washer and dryer included
Neighborhood map
What this means for you Summary
Snapshot
- This is a 3-bed/3.0-bath single-family listed at $1.95M.
Deal economics
- At list price, monthly cash flow is $-4k ($-44k/yr) — negative.
- To cash-flow at today's rent, offer at most $1.30M (33.5% below list).
- To meet the 1% rule (rent ≥ 1% of price), the offer needs to be $1.08M (44.8% below list).
- Recommended offer: $1.08M (44.8% below list) — sets the bar for 1% rule.
- Cap rate 4.0% vs local median 2.1% in Los Angeles — top-decile yield for the area; either an underpriced asset or a hidden risk that comps aren't pricing in. Stress-test before assuming the spread holds.
Location & tenants
- Location reads 68/100 on livability (#273 in CA) — a middle-class / working-renter tenant base. Strengths: amenities A+, commute A+, employment B; Watch: health & safety C-, schools D+, crime F.
- Los Angeles Unified (urban): math 29% / reading 54% proficiency, ranked #223 of 517 in CA (top 43%) — families likely to look elsewhere, expect single-tenant / working-renter base with shorter leases; 67% free/reduced lunch — lower-income household profile, screen leases tightly.
- Market conditions: Rents falling (-3.0%/yr); 283 active listings in the ZIP; 33 comparable units currently listed for rent nearby; rentals at typical pace (median 25d on market — plan ~3-4 weeks tenant-placement turnaround); 48% of comp listings sitting > 30 days — soft ceiling on asking rent; high-income renter base; 19,697 units permitted in Los Angeles County in 2024 (9,426 in 5+ unit buildings).
- At $10,755/mo this rent would consume 76% of the median local household income ($171k/yr) (locally 1633% of renters already pay >50% of income on rent) — very limited rent-growth headroom before tenants either downsize or default.
Forward outlook
- In year one you build about $137k of equity ($13k loan paydown + $123k appreciation (6.3% local appreciation)).
- Los Angeles County population projected at +9% by 2050 — modest demand growth; plan on rents tracking national, not racing it.
- By year 2, paydown + projected appreciation supports a ~$219k cash-out refi (75% LTV) — recoverable capital for the next deal without selling this one.
Negotiation context
- It's been on market 52 days — a 3% lower offer ($1.89M) is reasonable based on typical stale-listing flexibility.
- 5 sale attempts since 27y ago with the ask held roughly flat each time — persistent listings suggest the price (not the market) is what's stuck; bring a comps-based counter.
- Current owner paid $849k; list at $1.95M implies a 130% gain — meaningful room to come down on a strong offer.
Risks & watch-outs
- Watch-outs: built in 1950 — expect roof / HVAC / electrical / plumbing capex.
- Climate carrying-cost: major flood risk; moderate wildfire risk; extreme-heat days projected 7→21/yr by 2055 (HVAC capex compounding) — expect insurance premiums to compound above CPI over the hold.
Questions for the listing agent
- What do current leases actually rent for vs. the listed asking? Can we see a recent rent roll and the last 12 months of T-12 income?
- It's been on market 52 days. Have you received any prior offers? Is the seller open to a 45% concession, seller financing, or rate buy-down credit?
- Built in 1950 — when were the roof, HVAC, electrical panel, plumbing, and water heater last replaced?
- Is there a deadline driving the sale (1031 exchange, divorce, estate, relocation)? That informs how much negotiation room exists.
- Schools are D-rated, which usually means shorter tenancies and higher turnover. Who's the typical renter profile here, and what's been the actual vacancy rate?
- Crime grade is F in this area — have there been break-ins, vandalism, or insurance claims at this property in the last 3 years? What carrier currently insures it and at what premium?
- The area grade is low — what's the realistic commute time and amenity access for the typical tenant pool here? Any planned neighborhood developments (good or bad) we should know about?
- What's the average days-on-market for RENTAL listings here right now (not sales)? A rising rental-DOM trend means longer vacancies and softer asking-rent achievability than the comps imply.
- What's the recent tenant-quality profile in this submarket — average credit score on applications, eviction rate, late-payment / NSF rate, and stable-employment percentage? A property-management company in the area should have these aggregated.
- How much new for-sale + rental construction is in the pipeline within 1–3 miles? Heavy new supply typically softens prices + rents 12–24 months out; constrained supply supports both.
Investment metrics
- 1% rule
- 0.55% ✗
- Cap rate
- 4.02%
- Cash-on-cash
- -8.13%
- DSCR
- 0.64
- GRM
- 15.1
CMA / ARV
- ARV (median comp)
- $2,906,074
- List price
- $1,950,000
- Delta
- -32.90%
- Verdict
- UNDERPRICED
- Comps
- 20 within 1.0 mi
Show comp detail 12 sales within ~0.75 mi
| Address | Dist | Beds/Ba | Sqft | Sold | Price | $/sf | Match |
|---|---|---|---|---|---|---|---|
| 1101 Casiano Rd | 0.13mi | 4/4.0 (+1) | 2,646 (+3%) | 16mo | $2,125,000 | $803 | 67 |
| 11356 Thurston Cir | 0.53mi | 3/3.0 | 2,805 (+9%) | 1mo | $1,875,000 | $668 | 59 |
| 251 Ashdale Ave | 0.55mi | 4/4.0 (+1) | 2,595 (+1%) | 8mo | $3,195,000 | $1,231 | 57 |
| 765 Marzella Ave | 0.49mi | 4/3.0 (+1) | 2,608 (+2%) | 16mo | $4,200,000 | $1,610 | 56 |
| 951 Casiano Rd | 0.16mi | 3/3.0 | 2,252 (-12%) | 20mo | $1,800,000 | $799 | 56 |
| 737 Halliday Ave | 0.54mi | 3/3.0 | 2,318 (-10%) | 7mo | $3,400,000 | $1,467 | 53 |
| 11994 Chalon Rd | 0.51mi | 4/3.0 (+1) | 2,828 (+10%) | 5mo | $2,015,000 | $713 | 50 |
| 12010 Chalon Rd | 0.59mi | 4/4.0 (+1) | 2,562 (-0%) | 18mo | $4,000,000 | $1,561 | 49 |
| 1001 Kenfield Ave | 0.75mi | 4/4.0 (+1) | 2,522 (-2%) | 11mo | $3,000,000 | $1,190 | 44 |
| 1250 N Norman Pl | 0.53mi | 4/4.0 (+1) | 2,930 (+14%) | 1mo | $3,550,000 | $1,212 | 42 |
| 200 N Glenroy Ave | 0.73mi | 4/5.0 (+1) | 2,595 (+1%) | 12mo | $3,356,470 | $1,293 | 42 |
| 11450 Ayrshire Rd | 0.65mi | 4/4.0 (+1) | 2,832 (+10%) | 6mo | $3,650,000 | $1,289 | 38 |
Match score weights: distance 35% · size 25% · config 20% · recency 20%. Top-matched comps best support the ARV.
Projected returns pro-forma
6.33% appreciation · 0.0% rent growth · sell at horizon
- IRR
- 8.9%
- Equity multiple
- 1.61×
- Total profit
- $333,445
- Equity at exit
- $1,266,484
- IRR
- 9.7%
- Equity multiple
- 3.01×
- Total profit
- $1,098,127
- Equity at exit
- $2,332,624
Cash invested: $546,000 (down + closing). Projections, not guarantees.
Landlord ↔ Tenant lean methodology
- Overall (CITY)
- 0 Strongly Tenant-Friendly
- State California
- 18 Strongly Tenant-Friendly · D+13
- County
- — inherits STATE
- City Los Angeles
- 0 Strongly Tenant-Friendly · D+22
ZIP-level market 90049
- Home prices YoY
- 1.4%
- Rents YoY
- -3.0%
- Active inventory
- 283
- Price-to-rent
- 15.1×
Monthly cashflow live
- Estimated rent
- $10,755 high interval (Pro) →
- Mortgage (P&I)
- −$10,226
- Tax from tax record
- −$1,158 /mo · $13,892/yr
- Insurance
- −$812
- HOA
- −$0
- Vacancy / Maint / Mgmt
- −$2,259
- Net cashflow
- $-3,699
Break-even live
Sensitivity live
| Price | -10% $-2,596 | -5% $-3,147 | +0% $-3,699 | +5% $-4,251 | +10% $-4,803 |
|---|---|---|---|---|---|
| Rent | -10% $-4,549 | -5% $-4,124 | +0% $-3,699 | +5% $-3,275 | +10% $-2,850 |
| Rate | -1.0pp $-2,717 | -0.5pp $-3,203 | base $-3,699 | +0.5pp $-4,205 | +1.0pp $-4,719 |
UW: 25.0% down · 7.5% · 30yr · 1.5% tax · 5.0% vac · 8.0% maint · 8.0% mgmt
Financing live
Cash to close
- Down payment
- $487,500
- Closing costs
- $58,500
- Reserves months
- —
- Total cash needed
- —
Loan-product check · same deal, 3 products live
Conventional
25% down · 7.5% · 30yr
- Down + closing
- —
- Monthly P&I
- —
- Monthly cashflow
- —
- DSCR
- —
- Eligible?
- —
Personal DTI + credit; lowest rate.
DSCR
20% down · 8.5% · 30yr
- Down + closing
- —
- Monthly P&I
- —
- Monthly cashflow
- —
- DSCR
- —
- Eligible?
- —
No personal income docs; deal must DSCR.
Hard money
10% down · 12.0% · 12mo
- Down + closing
- —
- Monthly P&I
- —
- Monthly cashflow
- —
- DSCR
- —
- Eligible?
- —
Short-term bridge; refi at stabilization.
Rent comps 33 comps
| Address | Beds | Baths | Sqft | Rent | $/sqft | DOM | Units | Dist |
|---|---|---|---|---|---|---|---|---|
| 11769 Bellagio Rd Los Angeles, CA | 3.0 | 4.0 | 2505 | $12,500 | $4.99 | 44d | 1 | 0.03mi |
| 1104 Casiano Rd Los Angeles, CA | 4.0 | 4.0 | 2650 | $10,450 | $3.94 | 44d | 1 | 0.12mi |
| 999 Casiano Rd Los Angeles, CA | 4.0 | 4.5 | 3450 | $16,950 | $4.91 | 25d | 1 | 0.13mi |
| 11688 W Bellagio Pl Los Angeles, CA | 3.0 | 2.0 | 2000 | $5,950 | $2.98 | 3d | 1 | 0.24mi |
| 11807 Bel Ter Los Angeles, CA | 3.0 | 2.5 | 1890 | $7,250 | $3.84 | 22d | 1 | 0.39mi |
| 11508 Thurston Cir Los Angeles, CA | 3.0 | 4.0 | 3565 | $16,000 | $4.49 | 44d | 1 | 0.40mi |
| 935 Linda Flora Dr Los Angeles, CA | 2.0 | 2.0 | 2038 | $7,800 | $3.83 | 44d | 1 | 0.47mi |
| 1135 N Norman Pl Los Angeles, CA | 4.0 | 2.0 | 2113 | $15,000 | $7.10 | 25d | 1 | 0.50mi |
| 11215 W Sunset Blvd Los Angeles, CA | 4.0 | 5.0 | 3496 | $19,995 | $5.72 | 44d | 1 | 0.69mi |
| 123 N Glenroy Ave Los Angeles, CA | 3.0 | 3.5 | 2570 | $8,800 | $3.42 | 44d | 1 | 0.71mi |
| 590 N Tigertail Rd Los Angeles, CA | 2.0 | 3.0 | 2228 | $9,900 | $4.44 | 8d | 1 | 0.76mi |
| 11244 Homedale St Los Angeles, CA | 3.0 | 2.5 | 2285 | $9,595 | $4.20 | 44d | 1 | 0.78mi |
| 390 S Sepulveda Blvd Unit A302 Los Angeles, CA | 2.0 | 3.0 | 2050 | $5,095 | $2.49 | 44d | 1 | 1.01mi |
| 641 Walther Way Los Angeles, CA | 4.0 | 3.5 | 3542 | $20,000 | $5.65 | 44d | 1 | 1.02mi |
| 11740 W Sunset Blvd #22 Los Angeles, CA | 2.0 | 3.0 | 1875 | $6,800 | $3.63 | 18d | 1 | 1.09mi |
| 343 Veteran Ave Los Angeles, CA | 4.0 | 4.0 | 3131 | $22,000 | $7.03 | 11d | 1 | 1.09mi |
| 343 Veteran Ave Los Angeles, CA | 4.0 | 4.0 | 3131 | $24,995 | $7.98 | 44d | 1 | 1.09mi |
| 1133 Somera Rd Los Angeles, CA | 3.0 | 3.0 | 2840 | $15,000 | $5.28 | 12d | 1 | 1.12mi |
| 738 N Kenter Ave Los Angeles, CA | 4.0 | 4.5 | 2987 | $12,900 | $4.32 | 8d | 1 | 1.16mi |
| 11937 W Sunset Blvd #3 Los Angeles, CA | 4.0 | 4.5 | 2921 | $10,950 | $3.75 | 44d | 1 | 1.19mi |
| 527 S Bentley Ave Los Angeles, CA | 4.0 | 3.5 | 2590 | $12,895 | $4.98 | 25d | 1 | 1.19mi |
| 11176 Ophir Dr Los Angeles, CA | 4.0 | 5.0 | 2378 | $9,995 | $4.20 | 25d | 1 | 1.20mi |
| 486 Denslow Ave Los Angeles, CA | 3.0 | 3.0 | 2123 | $9,500 | $4.47 | 13d | 1 | 1.21mi |
| 1005 Stradella Rd Los Angeles, CA | 3.0 | 2.0 | 2000 | $7,300 | $3.65 | 22d | 1 | 1.22mi |
| 1181 Somera Rd Los Angeles, CA | 4.0 | 4.0 | 2994 | $15,500 | $5.18 | 22d | 1 | 1.26mi |
| 221 N Bowling Green Way Los Angeles, CA | 3.0 | 3.0 | 3313 | $13,500 | $4.07 | 44d | 1 | 1.30mi |
| 1212 Roberto Ln Los Angeles, CA | 3.0 | 3.0 | 2447 | $8,600 | $3.51 | 44d | 1 | 1.31mi |
| 125 S Saltair Ave Los Angeles, CA | 3.0 | 2.0 | 1887 | $9,500 | $5.03 | 44d | 1 | 1.34mi |
| 410 S Barrington Ave #205 Los Angeles, CA | 3.0 | 2.5 | 1939 | $5,995 | $3.09 | 4d | 1 | 1.35mi |
| 11959 Foxboro Dr Los Angeles, CA | 3.0 | 3.0 | 2125 | $9,400 | $4.42 | 44d | 1 | 1.36mi |
| 10723 Stradella Ct Los Angeles, CA | 4.0 | 3.0 | 2780 | $12,500 | $4.50 | 6d | 1 | 1.38mi |
| 505 S Barrington Ave #106 Los Angeles, CA | 3.0 | 3.5 | 1817 | $14,999 | $8.25 | 44d | 1 | 1.42mi |
| 1830 Old Orchard Rd Los Angeles, CA | 3.0 | 3.0 | 2695 | $22,500 | $8.35 | 22d | 1 | 1.48mi |
Listing history 25 events
-
2026-06-18days on market $1,950,000 Active 52 DOM
-
2026-06-17days on market $1,950,000 Active 51 DOM
-
2026-06-16days on market $1,950,000 Active 50 DOM
-
2026-06-15days on market $1,950,000 Active 49 DOM
-
2026-06-13days on market $1,950,000 Active 47 DOM
-
2026-06-09days on market $1,950,000 Active 43 DOM
-
2026-06-08days on market $1,950,000 Active 42 DOM
-
2026-06-07days on market $1,950,000 Active 41 DOM
-
2026-06-04days on market $1,950,000 Active 38 DOM
-
2026-06-03days on market $1,950,000 Active 37 DOM
-
2026-06-02days on market $1,950,000 Active 36 DOM
-
2026-06-01days on market $1,950,000 Active 35 DOM
-
2026-05-31days on market $1,950,000 Active 34 DOM
-
2026-05-14status Active 1135-char remark
-
2026-05-12historical Backup Offers Accepted 1135-char remark
-
2026-04-27$1,950,000 Active 1135-char remark
-
2026-03-10price
-
2026-01-09Active
-
2025-10-11price
-
2025-07-25Active
-
1999-09-22soldstatus
-
1999-05-25historical
-
1999-04-15$795,000
-
1989-12-21soldstatus $849,000
-
1985-04-03soldstatus $396,000
ⓘ Source: listings_history table (triggers on properties + properties_extension) + one-shot
backfill from property_details.listing_events for pre-trigger history.
Tax reassessment forecast CA · Resets to sale price
- Current annual tax
- $13,892 · $1,158/mo
- Projected year-2 tax
- $14,820 · $1,235/mo
- Expected delta
- +$928/yr (+$77/mo · 6.7%)
ⓘ Screening estimate from a state-policy table — verify with the county assessor before closing.
Climate risk First Street
- Flood 6/10 Major FEMA zone X (unshaded) · 68% chance over 30 yrs
- Wildfire 5/10 Major
- Heat 5/10 Major 7 d/yr ≥86°F today · 21 d/yr by 30 yrs out
- Wind 1/10 Low
- Air quality 4/10 Moderate 5 unhealthy d/yr today · 5 by 30 yrs out
Nearby sold comps map
Loading sold comps map…
Walkable amenities ~0.75 mi
Loading nearby amenities…
Taxation est. · year 1
- Rental income
- $129,065
- − Mortgage interest
- −$109,230
- − Property taxes
- −$13,892
- − Insurance
- −$9,750
- − Repairs & maintenance
- −$10,325
- − Management
- −$10,325
- − Depreciation
- −$56,727
- Taxable loss
- −$81,185
- Est. tax savings @ 24.0%
- +$19,484
- After-tax cash flow
- $-24,908/yr
For passive investors: Depreciation is non-cash, so a rental often shows a tax loss while cash-flowing — sheltering income. Rental losses are passive: they offset passive income freely, and up to $25,000/yr can offset ordinary (W-2) income if you actively participate and your MAGI is under $100k (phasing out to $0 by $150k); unused losses carry forward. On sale, claimed depreciation is recaptured at up to 25%, and gains may owe capital-gains tax (a 1031 exchange can defer both). Figures are a year-1 estimate at your 24.0% rate — not tax advice; consult a CPA.
Schools (NCES district)
- District
- Los Angeles Unified
- NCES district ID
- 0622710
- Math proficiency
- 29% ▼ -4.00%
- Reading proficiency
- 54% ▲ 10.00%
- Median HH income
- $50,403
- Composite
- 35.67/100
- National rank
- #4875
- State rank
- #223 of 517 in CA
Livability — Los Angeles
- Score
- 68/100
- State rank
- #273
- US rank
- #9237
Category grades
Schools grade is shown separately in the Schools card above.
Census & demographics
- Census place
- Los Angeles, CA
- County
- Los Angeles County · 9,444,647 people
- City population
- 3,838,149
- Metro
- Los Angeles-Long Beach-Anaheim, CA
- Population (ZIP)
- 37,122
- Household income
- $170,607
- Rent vs Own
- Severe rent burden
- 1633.0
Population outlook (Los Angeles County) Hauer SSP2
- Today (2025)
- 10,940,515 people
- By 2030
- 11,256,481 · +2.9%
- By 2040
- 11,729,929 · +7.2%
- By 2050
- 11,948,407 · +9.2%
- By 2075
- 11,818,114 · +8.0%
- By 2100
- 10,842,928 · -0.9%
Race, ethnicity, and origin ACS 2023
- Neighborhood character
- Predominantly White (75%)
- Race & ethnicity
- White 75% Two or more races 10% Asian 9% Hispanic / Latino 8% Black 1%
- Hispanic origin (detail)
- Mexican 3%
- Common ancestry
- Italian 7% Scotch-Irish 6% Romanian 5%
- Foreign-born
- 20% · Canada, China, South Korea
- Languages at home
- 78% English-only · Other Indo-European 8% Spanish 4% Russian/Polish/Slavic 2%
Political lean MEDSL · Los Angeles
- 2024 margin
- Solid D (+32.9) · D 64.8% · R 31.9% · Other 3.3%
- 2008→2024 swing
- -7.4pp toward R · 2008: 40.4pp · 2024: 32.9pp
- All cycles
- 2024: D+32.9 2020: D+44.2 2016: D+48.0 2012: D+40.0 2008: D+40.4
Not yet ingested
- Civics
- —
Market trends
- HPI YoY
- ▲ 6.33%
- Current HPI
- 471.6282
- Rent YoY
- ▼ -3.04%
- Metro
- Los Angeles-Long Beach-Anaheim, CA
- State GDP YoY
- ▲ 3.21%
- F500 in state
- 116
Industry mix (Fortune 500 HQ in CA)
| Industry | F500 HQs | Revenue |
|---|---|---|
| Technology | 27 | $1,492B |
|
||
| Financial Services | 3 | $174B |
|
||
| Retail | 3 | $44B |
|
||
| Insurance | 3 | $26B |
|
||
| Media / Entertainment | 2 | $115B |
|
||
| Pharmaceuticals / Biotech | 2 | $62B |
|
||
Price history
+392.4% since first listed12 events — show timeline
- 2026-05-14 Relisted — TheMLS
- 2026-05-12 Contingent — TheMLS
- 2026-04-27 Listed $1,950,000 TheMLS
- 2026-03-10 Price Changed — TheMLS
- 2026-01-09 Listed — TheMLS
- 2025-10-11 Price Changed — TheMLS
- 2025-07-25 Listed — TheMLS
- 1999-09-22 Sold (MLS) — TheMLS
- 1999-05-25 Delisted — TheMLS
- 1999-04-15 Listed $795,000 TheMLS
- 1989-12-21 Sold (Public Records) $849,000 Public Records
- 1985-04-03 Sold (Public Records) $396,000 Public Records
Property tax history
+1.7%/yrLatest (2025): $13,892 · +1.7% YoY. Source: county tax records.
Cash-flow waterfall
monthlySold comps — $/sqft
last 12 mo · ≤1 miLoading sold comps…