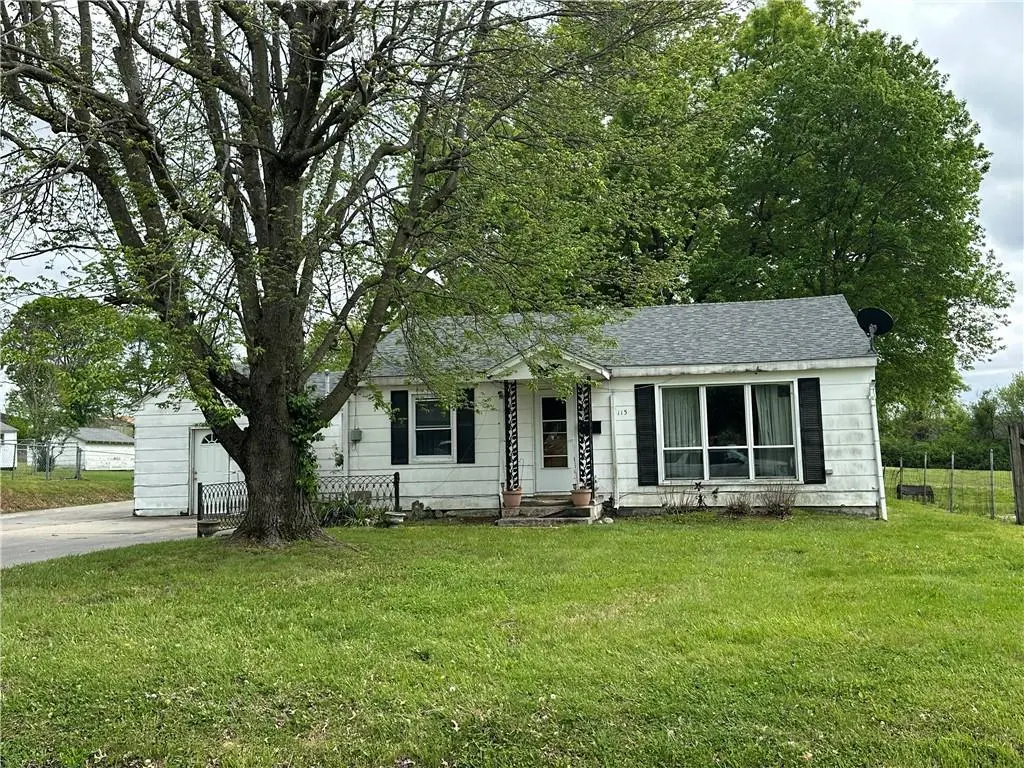
115 E South St · Richmond, MO
Flood risk 1/10 · Minimal
- FEMA flood zone
- X (unshaded)
- Chance of flooding over 30 yrs
- 0.0%
- Est. flood insurance / yr
- $507 – $1,088
Fire risk 3/10 · Minor
- Est. fire insurance / yr
- $1,054 – $1,958
Heat risk 4/10 · Minor
- Hot days now (above 108°F)
- 7 days/yr
- Hot days in 30 yrs
- 16 days/yr
Wind risk 2/10 · Minimal
- Chance of severe wind over 30 yrs
- —
Air-quality risk 2/10 · Minimal
- Unhealthy air days now
- 2 days/yr
- Unhealthy air days in 30 yrs
- 2 days/yr
Risk factors via First Street. Map © Google.
Why this score? — see what drove the B grade
The composite is a weighted blend of 9 inputs, each scored 0–100. Each bar is that input's sub-score; the figure is the points it added to the 100-point composite (weight × sub-score).
- Cash flow +30.0/30.0
- DSCR +10.0/10.0
- 1% rule +8.5/10.0
- ARV discount +7.5/15.0
- Appreciation +5.1/10.0
- Livability +3.4/5.0
- Schools +3.0/10.0
- Rent growth +2.5/5.0
- Condition / age +2.5/5.0
$105,000
🖨 Deal sheet 📄 Offer letter ✓ Due diligence
Key facts
- 0.33 acre lot
- 2 garage spots
- Built 1940
Property features AI
Finance
- Other: Directions: From 13 Highway & East South St. go west to home on left.
- Financial info: No investor or income/expense details provided
- HOA & community: No HOA details provided
Exterior
- Parking: Detached 2-car garage
- Security: No security details provided
- Utilities: Public water
- Home design: Single-family residence; One-story (ranch); Residential property
- Construction: Vinyl siding; Composition roof; Home aged approximately 76–100 years
- Exterior features: Not in a flood plain; Lot approximately 14,549 square feet
Interior
- Kitchen: No kitchen appliance details provided
- Bedrooms: 3 bedrooms
- Flooring: No flooring details provided
- Bathrooms: 1 full bathroom
- Heating & cooling: Natural gas heating; Electric cooling (air conditioning)
- Interior features: Ranch floor plan; Crawl space basement
- Laundry & utility: No laundry details provided
Neighborhood map
What this means for you Summary
Snapshot
- This is a 3-bed/1.5-bath single-family listed at $105k.
Deal economics
- At list price, monthly cash flow is $442 ($5k/yr) — positive.
- The deal already cash-flows at list — no discount required.
- Meets the 1% rule at list price ($1k rent vs $105k).
- Cap rate 11.3% vs local median 3.7% in Richmond — top-decile yield for the area; either an underpriced asset or a hidden risk that comps aren't pricing in. Stress-test before assuming the spread holds.
Location & tenants
- Location reads 67/100 on livability (#198 in MO) — a middle-class / working-renter tenant base. Strengths: cost of living A+, housing A+; Watch: health & safety C-, schools D+, amenities F.
- Richmond R-XVI (town): math 32% / reading 39% proficiency, ranked #209 of 324 in MO (top 64%) — families likely to look elsewhere, expect single-tenant / working-renter base with shorter leases.
- Market conditions: 99 active listings in the ZIP; 56 units permitted in Ray County in 2024 (0 in 5+ unit buildings).
Forward outlook
- In year one you build about $1k of equity ($726 loan paydown + $311 appreciation (0.3% local appreciation)).
- Ray County population projected at -23% by 2050 — secular population decline; favor cash flow + early exit over multi-decade hold.
- At projected returns (0.3% appreciation + 3.0% rent growth), your $29k cash investment doubles in ~5 years — after that, you're playing with house money.
Negotiation context
- Only 5 days on market — expect competitive offers; lowballing is unlikely to land.
- 2 sale attempts since 18y ago with the ask held roughly flat each time — persistent listings suggest the price (not the market) is what's stuck; bring a comps-based counter.
Risks & watch-outs
- Watch-outs: built in 1940 — expect roof / HVAC / electrical / plumbing capex.
Questions for the listing agent
- Built in 1940 — when were the roof, HVAC, electrical panel, plumbing, and water heater last replaced?
- Is there a deadline driving the sale (1031 exchange, divorce, estate, relocation)? That informs how much negotiation room exists.
- Schools are D-rated, which usually means shorter tenancies and higher turnover. Who's the typical renter profile here, and what's been the actual vacancy rate?
- What's the average days-on-market for RENTAL listings here right now (not sales)? A rising rental-DOM trend means longer vacancies and softer asking-rent achievability than the comps imply.
- What's the recent tenant-quality profile in this submarket — average credit score on applications, eviction rate, late-payment / NSF rate, and stable-employment percentage? A property-management company in the area should have these aggregated.
- How much new for-sale + rental construction is in the pipeline within 1–3 miles? Heavy new supply typically softens prices + rents 12–24 months out; constrained supply supports both.
Investment metrics
- 1% rule
- 1.35% ✓
- Cap rate
- 11.35%
- Cash-on-cash
- 18.05%
- DSCR
- 1.80
- GRM
- 6.2
CMA / ARV
- ARV (median comp)
- $232,390
- List price
- $105,000
- Delta
- -54.82%
- Verdict
- UNDERPRICED
- Comps
- 20 within 1.0 mi
Show comp detail 12 sales within ~0.75 mi
| Address | Dist | Beds/Ba | Sqft | Sold | Price | $/sf | Match |
|---|---|---|---|---|---|---|---|
| 201 W Royle St | 0.32mi | 3/2.0 | 1,743 (-1%) | 10mo | $210,900 | $121 | 73 |
| 116 E South St | 0.03mi | 4/2.0 (+1) | 1,534 (-13%) | 8mo | $245,000 | $160 | 64 |
| 505 Hickory St | 0.44mi | 3/3.0 | 1,649 (-6%) | 2mo | $259,000 | $157 | 61 |
| 1005 Wellington St | 0.52mi | 3/2.0 | 1,630 (-8%) | 7mo | $370,565 | $227 | 55 |
| 508 S Thornton St | 0.20mi | 3/2.0 | 1,500 (-15%) | 13mo | $310,690 | $207 | 53 |
| 507 S Shaw St | 0.29mi | 2/1.5 (-1) | 1,523 (-14%) | 8mo | $99,900 | $66 | 53 |
| 305 E Main St | 0.55mi | 3/2.0 | 1,880 (+7%) | 10mo | $195,000 | $104 | 53 |
| 1112 Fairway Dr | 0.70mi | 3/2.0 | 1,592 (-10%) | 1mo | $249,000 | $156 | 48 |
| 303 Wellington St | 0.43mi | 4/2.0 (+1) | 1,584 (-10%) | 10mo | $180,000 | $114 | 48 |
| 812 W Royle St | 0.73mi | 4/2.0 (+1) | 1,675 (-5%) | 9mo | $339,000 | $202 | 44 |
| 307 N College St | 0.74mi | 4/1.5 (+1) | 1,972 (+12%) | 6mo | $195,000 | $99 | 36 |
| 506 E Main St | 0.69mi | 3/2.0 | 1,530 (-13%) | 12mo | $184,750 | $121 | 34 |
Match score weights: distance 35% · size 25% · config 20% · recency 20%. Top-matched comps best support the ARV.
Projected returns pro-forma
0.3% appreciation · 3.0% rent growth · sell at horizon
- IRR
- 18.4%
- Equity multiple
- 1.90×
- Total profit
- $26,548
- Equity at exit
- $32,051
- IRR
- 22.4%
- Equity multiple
- 3.54×
- Total profit
- $74,798
- Equity at exit
- $39,797
Cash invested: $29,400 (down + closing). Projections, not guarantees.
Landlord ↔ Tenant lean methodology
- Overall (STATE)
- 81 Strongly Landlord-Friendly
- State Missouri
- 81 Strongly Landlord-Friendly · R+10
- County
- — inherits STATE
- City
- — inherits STATE
ZIP-level market 64085
- Home prices YoY
- 0.1%
- Active inventory
- 99
- Price-to-rent
- 6.2×
Monthly cashflow live
- Estimated rent
- $1,417 medium interval (Pro) →
- Mortgage (P&I)
- −$551
- Tax from tax record
- −$83 /mo · $992/yr
- Insurance
- −$44
- HOA
- −$0
- Vacancy / Maint / Mgmt
- −$297
- Net cashflow
- $442
Break-even live
UW: 25.0% down · 7.5% · 30yr · 1.5% tax · 5.0% vac · 8.0% maint · 8.0% mgmt
Financing live
Cash to close
- Down payment
- $26,250
- Closing costs
- $3,150
- Reserves months
- —
- Total cash needed
- —
Loan-product check · same deal, 3 products live
Conventional
25% down · 7.5% · 30yr
- Down + closing
- —
- Monthly P&I
- —
- Monthly cashflow
- —
- DSCR
- —
- Eligible?
- —
Personal DTI + credit; lowest rate.
DSCR
20% down · 8.5% · 30yr
- Down + closing
- —
- Monthly P&I
- —
- Monthly cashflow
- —
- DSCR
- —
- Eligible?
- —
No personal income docs; deal must DSCR.
Hard money
10% down · 12.0% · 12mo
- Down + closing
- —
- Monthly P&I
- —
- Monthly cashflow
- —
- DSCR
- —
- Eligible?
- —
Short-term bridge; refi at stabilization.
Listing history 6 events
-
2026-05-12status Pending
-
2026-05-08$105,000 Active
-
2026-05-05price $105,000
-
2026-05-05historical $5,000
-
2009-03-31historical
-
2008-12-04$73,950
ⓘ Source: listings_history table (triggers on properties + properties_extension) + one-shot
backfill from property_details.listing_events for pre-trigger history.
Tax reassessment forecast MO · Resets to sale price
- Current annual tax
- $992 · $83/mo
- Projected year-2 tax
- $1,018 · $85/mo
- Expected delta
- +$27/yr (+$2/mo · 2.7%)
ⓘ Screening estimate from a state-policy table — verify with the county assessor before closing.
Climate risk First Street
- Flood 1/10 Low FEMA zone X (unshaded) · 0% chance over 30 yrs
- Wildfire 3/10 Moderate
- Heat 4/10 Moderate 7 d/yr ≥108°F today · 16 d/yr by 30 yrs out
- Wind 2/10 Low
- Air quality 2/10 Low 2 unhealthy d/yr today · 2 by 30 yrs out
Nearby sold comps map
Loading sold comps map…
Walkable amenities ~0.75 mi
Loading nearby amenities…
Taxation est. · year 1
- Rental income
- $17,000
- − Mortgage interest
- −$5,882
- − Property taxes
- −$992
- − Insurance
- −$525
- − Repairs & maintenance
- −$1,360
- − Management
- −$1,360
- − Depreciation
- −$3,055
- Taxable income
- $3,827
- Est. tax owed @ 24.0%
- −$918
- After-tax cash flow
- $4,387/yr
For passive investors: Depreciation is non-cash, so a rental often shows a tax loss while cash-flowing — sheltering income. Rental losses are passive: they offset passive income freely, and up to $25,000/yr can offset ordinary (W-2) income if you actively participate and your MAGI is under $100k (phasing out to $0 by $150k); unused losses carry forward. On sale, claimed depreciation is recaptured at up to 25%, and gains may owe capital-gains tax (a 1031 exchange can defer both). Figures are a year-1 estimate at your 24.0% rate — not tax advice; consult a CPA.
Schools (NCES district)
- District
- Richmond R-XVI
- NCES district ID
- 2926480
- Math proficiency
- 32% ▼ -11.00%
- Reading proficiency
- 39% ▼ -8.00%
- Median HH income
- $44,070
- Composite
- 30.17/100
- National rank
- #6321
- State rank
- #209 of 324 in MO
Livability — Richmond
- Score
- 67/100
- State rank
- #198
- US rank
- #10160
Category grades
Schools grade is shown separately in the Schools card above.
Census & demographics
- Census place
- Richmond, MO
- Population (ZIP)
- 8,113
Population outlook (Ray County) Hauer SSP2
- Today (2025)
- 21,420 people
- By 2030
- 20,507 · -4.3%
- By 2040
- 18,550 · -13.4%
- By 2050
- 16,516 · -22.9%
- By 2075
- 12,899 · -39.8%
- By 2100
- 10,413 · -51.4%
Race, ethnicity, and origin ACS 2023
- Neighborhood character
- Predominantly White (91%)
- Race & ethnicity
- White 91% Hispanic / Latino 3% Two or more races 3% Black 2% Native American 1%
- Common ancestry
- Lithuanian 3% Slovak 2% Italian 1%
- Foreign-born
- 1% · Canada
- Languages at home
- 97% English-only · Spanish 2%
Political lean MEDSL · Ray
- 2024 margin
- Solid R (+48.7) · D 25.1% · R 73.8% · Other 1.1%
- 2008→2024 swing
- -45.5pp toward R · 2008: -3.2pp · 2024: -48.7pp
- All cycles
- 2024: R+48.7 2020: R+45.0 2016: R+37.1 2012: R+14.9 2008: R+3.2
Not yet ingested
- Civics
- —
Market trends
- HPI YoY
- ▲ 0.30%
- Current HPI
- 374.3671
- Rent YoY
- —
- Metro
- —
- State GDP YoY
- ▲ 1.84%
- F500 in state
- 20
Industry mix (Fortune 500 HQ in MO)
| Industry | F500 HQs | Revenue |
|---|---|---|
| Healthcare | 1 | $163B |
|
||
| Insurance | 1 | $21B |
|
||
| Industrial Technology | 1 | $17B |
|
||
| Retail | 1 | $16B |
|
||
| Industrial Distribution | 1 | $10B |
|
||
| Utilities | 1 | $9B |
|
||
Price history
+42.0% since first listed6 events — show timeline
- 2026-05-12 Pending — Heartland MLS as Distributed by MLS Grid
- 2026-05-08 Listed $105,000 Heartland MLS as Distributed by MLS Grid
- 2026-05-05 Price Changed $105,000 Heartland MLS as Distributed by MLS Grid
- 2026-05-05 Coming Soon $5,000 Heartland MLS as Distributed by MLS Grid
- 2009-03-31 Listing Removed — Heartland MLS as Distributed by MLS Grid
- 2008-12-04 Listed $73,950 Heartland MLS as Distributed by MLS Grid
Property tax history
+5.1%/yrLatest (2025): $992 · +8.6% YoY. Source: county tax records.
Cash-flow waterfall
monthlySold comps — $/sqft
last 12 mo · ≤1 miLoading sold comps…