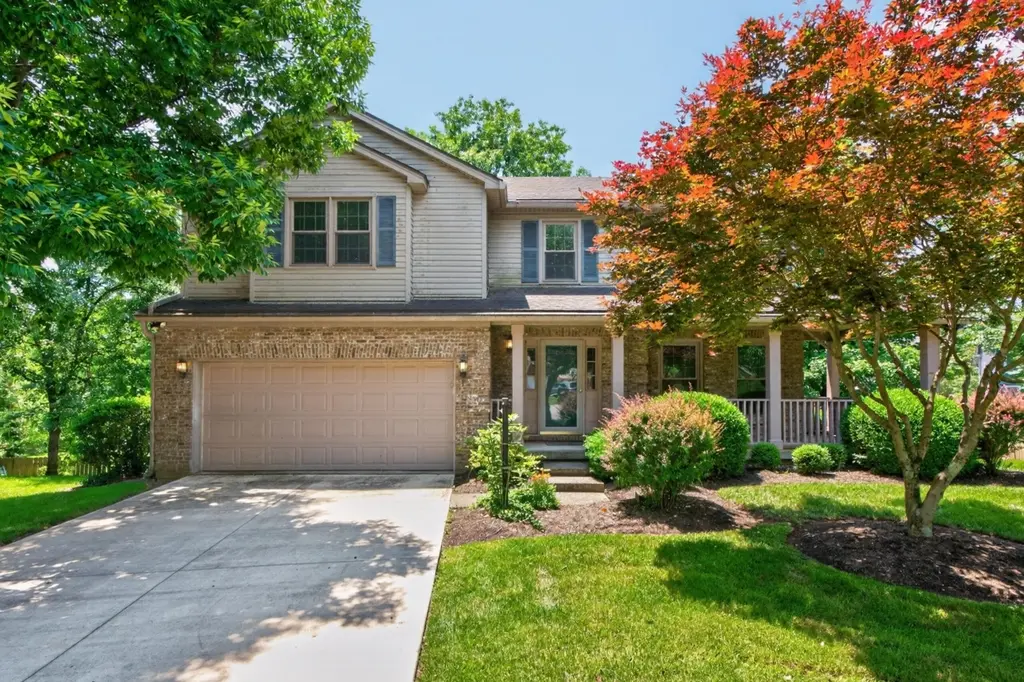
1005 Crimson Creek Dr · Lexington-Fayette, KY
Flood risk 1/10 · Minimal
- FEMA flood zone
- X (unshaded)
- Chance of flooding over 30 yrs
- 0.0%
- Est. flood insurance / yr
- $473 – $860
Fire risk 1/10 · Minimal
- Est. fire insurance / yr
- $839 – $1,559
Heat risk 4/10 · Minor
- Hot days now (above 102°F)
- 7 days/yr
- Hot days in 30 yrs
- 19 days/yr
Wind risk 2/10 · Minimal
- Chance of severe wind over 30 yrs
- 3.0%
Air-quality risk 1/10 · Minimal
- Unhealthy air days now
- 0 days/yr
- Unhealthy air days in 30 yrs
- 0 days/yr
Risk factors via First Street. Map © Google.
Why this score? — see what drove the D+ grade
The composite is a weighted blend of 9 inputs, each scored 0–100. Each bar is that input's sub-score; the figure is the points it added to the 100-point composite (weight × sub-score).
- ARV discount +15.0/15.0
- Cash flow +14.8/30.0
- DSCR +4.5/10.0
- 1% rule +3.4/10.0
- Schools +3.4/10.0
- Rent growth +3.1/5.0
- Livability +2.5/5.0
- Condition / age +2.5/5.0
- Appreciation +0.0/10.0
$315,000
🖨 Deal sheet (PDF) 📄 Offer letter ✓ Due diligence
Listing remarks
Opportunity awaits in the highly desirable Autumn Ridge neighborhood. This spacious two-story home offers three finished levels and an exceptional floor plan, making it an ideal option for investors, flippers, or buyers looking to create their dream home. The main level features a formal dining room, a welcoming family room with fireplace, and a large open kitchen with breakfast area. Upstairs, you'll find an expansive primary suite with two walk-in closets and an ensuite bath featuring a double vanity, soaking tub, and separate shower. A second-floor laundry room adds everyday convenience. The finished walkout basement includes a large recreation room, half bath with plumbing rough-in for
Key facts
- 0.49 acre lot
- 2 garage spots
- Community pool
Property features AI
Finance
- Financial info: Owner pays common area maintenance
- HOA & community: Homeowners association present; fees collected annually
Exterior
- Parking: Attached garage; Driveway; Garage door opener; Garage faces front; Property has a garage
- Utilities: Public water; Public sewer; Electricity connected; Natural gas connected; Sewer connected; Water connected; Cable available; Underground utilities
- Home design: House; Two levels; Located at end of a cul-de-sac in the Autumn Ridge subdivision
- Construction: Brick veneer and vinyl siding; Block foundation; Shingle roof; Built area approximately 2,986 sq ft
- Exterior features: Many trees on the lot; Wood fencing
Interior
- Kitchen: Dishwasher; Range; Microwave; Refrigerator; Disposal
- Bedrooms: Bedrooms included (total rooms indicate 14 rooms)
- Flooring: Hardwood; Carpet; Vinyl
- Bathrooms: 2 full bathrooms; 2 half bathrooms
- Heating & cooling: Forced air heating (natural gas); Zoned heating; Central air conditioning; Attic fan; Zoned cooling
- Interior features: Entrance foyer; Eat-in kitchen; Walk-in closets; Ceiling fans; Soaking tub; 700 sq ft finished lower level; Full, partially finished basement with walk-out access; Fireplace
- Laundry & utility: Washer hookup; Electric dryer hookup; Gas dryer hookup
Neighborhood map
What this means for you Summary
Snapshot
- This is a 4-bed/2.5-bath single-family listed at $315k.
Deal economics
- At list price, monthly cash flow is $89 ($1k/yr) — positive.
- The deal already cash-flows at list — no discount required.
- To meet the 1% rule (rent ≥ 1% of price), the offer needs to be $264k (16.3% below list).
- Recommended offer: $264k (16.3% below list) — sets the bar for 1% rule.
- Cap rate 6.6% vs local median 3.8% in Lexington-Fayette — top-decile yield for the area; either an underpriced asset or a hidden risk that comps aren't pricing in. Stress-test before assuming the spread holds.
Location & tenants
- Location reads: area grade D — affects rentability + tenant quality, not the cash-flow math above.
- Fayette County (urban): math 35% / reading 45% proficiency, ranked #27 of 165 in KY (top 16%) — families likely to look elsewhere, expect single-tenant / working-renter base with shorter leases.
- Zoned schools: Athens-Chilesburg Elementary (math 65% / reading 70%, grade B+, #12 of 676 statewide, top 2%, 533 students, 17% FRL); Edythe Jones Hayes Middle School (math 47% / reading 60%, grade C+, #13 of 217 statewide, top 6%, 1,081 students, 37% FRL); Frederick Douglass High School (math 36% / reading 42%, grade F, #51 of 254 statewide, top 21%, 1,667 students, 43% FRL).
- Zoned-school proficiency averages 53% at this address vs 40% district-wide (+13 pts) — the actual schools serving this property are materially stronger than the Fayette County average implies; a family-tenant draw the district grade alone would hide.
- Market conditions: Rents rising (+2.2%/yr); 280 active listings in the ZIP; 3 comparable units currently listed for rent nearby; rentals at typical pace (median 25d on market — plan ~3-4 weeks tenant-placement turnaround); solid renter incomes; 1,036 units permitted in Fayette County in 2024 (542 in 5+ unit buildings).
- This rent runs 33% of the median local income ($95k/yr) — at the standard rent-burdened threshold; future hikes will face affordability resistance.
Forward outlook
- Local home prices are declining (-3.0%/yr); year-one equity from $2k of loan paydown is wiped out by about $9k of value loss. Plan a longer hold.
- Fayette County population projected at +35% by 2050 — long-run rental-demand tailwind backs the buy-and-hold thesis.
Negotiation context
- Only 11 days on market — expect competitive offers; lowballing is unlikely to land.
- 2 sale attempts since 26y ago with the ask held roughly flat each time — persistent listings suggest the price (not the market) is what's stuck; bring a comps-based counter.
- Current owner paid $205k; list at $315k implies a 54% gain — meaningful room to come down on a strong offer.
Questions for the listing agent
- What does the HOA fee cover, when was the last increase, and are there any pending special assessments or reserve-fund shortfalls?
- Is there a deadline driving the sale (1031 exchange, divorce, estate, relocation)? That informs how much negotiation room exists.
- The area grade is low — what's the realistic commute time and amenity access for the typical tenant pool here? Any planned neighborhood developments (good or bad) we should know about?
- What's the average days-on-market for RENTAL listings here right now (not sales)? A rising rental-DOM trend means longer vacancies and softer asking-rent achievability than the comps imply.
- What's the recent tenant-quality profile in this submarket — average credit score on applications, eviction rate, late-payment / NSF rate, and stable-employment percentage? A property-management company in the area should have these aggregated.
- How much new for-sale + rental construction is in the pipeline within 1–3 miles? Heavy new supply typically softens prices + rents 12–24 months out; constrained supply supports both.
Investment metrics
- 1% rule
- 0.84% ✗
- Cap rate
- 6.63%
- Cash-on-cash
- 1.21%
- DSCR
- 1.05
- GRM
- 10.0
CMA / ARV
- ARV (on-the-fly)
- $530,460
- Comps found
- 12
Show comp detail 12 sales within ~0.75 mi
| Address | Dist | Beds/Ba | Sqft | Sold | Price | $/sf | Match |
|---|---|---|---|---|---|---|---|
| 3724 Broadmoor Dr | 0.44mi | 4/2.5 | 2,434 (-4%) | 1mo | $404,800 | $166 | 73 |
| 1276 Angus Trl | 0.56mi | 4/2.5 | 2,539 (+0%) | 1mo | $549,000 | $216 | 72 |
| 1045 Squirrel Nest Ln | 0.62mi | 4/2.5 | 2,534 (+0%) | 0mo | $535,000 | $211 | 70 |
| 956 Deer Crossing Way | 0.14mi | 4/2.5 | 2,165 (-14%) | 1mo | $434,900 | $201 | 69 |
| 3800 Stolen Horse Trce | 0.64mi | 4/2.5 | 2,521 (-0%) | 1mo | $705,000 | $280 | 69 |
| 1065 Sawgrass Cv | 0.49mi | 4/2.5 | 2,380 (-6%) | 1mo | $490,000 | $206 | 67 |
| 1116 Deer Haven Ln | 0.28mi | 5/3.0 (+1) | 2,296 (-9%) | 2mo | $392,000 | $171 | 63 |
| 1029 Squirrel Nest Ln | 0.58mi | 4/2.5 | 2,703 (+7%) | 1mo | $540,000 | $200 | 61 |
| 629 Andover Village Pl | 0.67mi | 3/2.5 (-1) | 2,597 (+3%) | 2mo | $466,000 | $179 | 57 |
| 704 Maple Ridge Ln | 0.54mi | 3/2.5 (-1) | 2,272 (-10%) | 2mo | $480,000 | $211 | 52 |
| 1148 Autumn Ridge Dr | 0.48mi | 3/2.5 (-1) | 2,210 (-12%) | 1mo | $465,000 | $210 | 51 |
| 1348 Angus Trl | 0.71mi | 4/2.5 | 2,814 (+11%) | 2mo | $670,000 | $238 | 46 |
Match score weights: distance 35% · size 25% · config 20% · recency 20%. Top-matched comps best support the ARV.
Projected returns pro-forma
-3.0% appreciation · 2.22% rent growth · sell at horizon
- IRR
- -15.2%
- Equity multiple
- 0.46×
- Total profit
- $-47,518
- Equity at exit
- $46,968
- IRR
- -8.0%
- Equity multiple
- 0.52×
- Total profit
- $-42,689
- Equity at exit
- $27,235
Cash invested: $88,200 (down + closing). Projections, not guarantees.
Landlord ↔ Tenant lean methodology
- Overall (STATE)
- 83 Strongly Landlord-Friendly
- State Kentucky
- 83 Strongly Landlord-Friendly · R+16
- County
- — inherits STATE
- City
- — inherits STATE
ZIP-level market 40509
- Home prices YoY
- -20.6%
- Rents YoY
- 2.2%
- Active inventory
- 280
- Price-to-rent
- 10.0×
Monthly cashflow live
- Estimated rent
- $2,636 medium interval (Pro) →
- Mortgage (P&I)
- −$1,652
- Tax from tax record
- −$192 /mo · $2,303/yr
- Insurance
- −$131
- HOA
- −$19
- Vacancy / Maint / Mgmt
- −$554
- Net cashflow
- $89
Break-even live
Sensitivity live
| Price | -10% $267 | -5% $178 | +0% $89 | +5% $0 | +10% $-90 |
|---|---|---|---|---|---|
| Rent | -10% $-120 | -5% $-15 | +0% $89 | +5% $193 | +10% $297 |
| Rate | -1.0pp $247 | -0.5pp $169 | base $89 | +0.5pp $7 | +1.0pp $-76 |
UW: 25.0% down · 7.5% · 30yr · 1.5% tax · 5.0% vac · 8.0% maint · 8.0% mgmt
Financing live
Cash to close
- Down payment
- $78,750
- Closing costs
- $9,450
- Reserves months
- —
- Total cash needed
- —
Loan-product check · same deal, 3 products live
Conventional
25% down · 7.5% · 30yr
- Down + closing
- —
- Monthly P&I
- —
- Monthly cashflow
- —
- DSCR
- —
- Eligible?
- —
Personal DTI + credit; lowest rate.
DSCR
20% down · 8.5% · 30yr
- Down + closing
- —
- Monthly P&I
- —
- Monthly cashflow
- —
- DSCR
- —
- Eligible?
- —
No personal income docs; deal must DSCR.
Hard money
10% down · 12.0% · 12mo
- Down + closing
- —
- Monthly P&I
- —
- Monthly cashflow
- —
- DSCR
- —
- Eligible?
- —
Short-term bridge; refi at stabilization.
Rent comps 3 comps
| Address | Beds | Baths | Sqft | Rent | $/sqft | DOM | Units | Dist |
|---|---|---|---|---|---|---|---|---|
| 3548 Stolen Horse Trce Lexington, KY | 4.0 | 2.5 | 2500 | $2,995 | $1.20 | 25d | 1 | 0.55mi |
| 421 Forest Hill Dr Lexington, KY | 3.0 | 2.5 | 2151 | $2,295 | $1.07 | 25d | 1 | 1.08mi |
| 4636 Marcus Trl Lexington, KY | 4.0 | 2.5 | 2440 | $2,500 | $1.02 | 15d | 1 | 1.20mi |
HOA detail
- Monthly dues
- $19 · $228/yr
Listing history 10 events
-
2026-06-15status $315,000 Pending 11 DOM
-
2026-06-15days on market $315,000 Contingent 11 DOM
-
2026-06-14days on market $315,000 Contingent 9 DOM
-
2026-06-13days on market $315,000 Contingent 8 DOM
-
2026-06-10days on market $315,000 Contingent 6 DOM
-
2026-06-09statusdays on market $315,000 Contingent 5 DOM
-
2026-06-08days on market $315,000 Active 4 DOM
-
2026-06-07days on market $315,000 Active 3 DOM
-
2026-06-05remarks 699-char remark
-
2026-06-05$315,000 Active 1 DOM
ⓘ Source: listings_history table (triggers on properties + properties_extension) + one-shot
backfill from property_details.listing_events for pre-trigger history.
Tax reassessment forecast KY · Resets to sale price
- Current annual tax
- $2,303 · $192/mo
- Projected year-2 tax
- $2,709 · $226/mo
- Expected delta
- +$406/yr (+$34/mo · 17.6%)
ⓘ Screening estimate from a state-policy table — verify with the county assessor before closing.
Climate risk First Street
- Flood 1/10 Low FEMA zone X (unshaded) · 0% chance over 30 yrs
- Wildfire 1/10 Low
- Heat 4/10 Moderate 7 d/yr ≥102°F today · 19 d/yr by 30 yrs out
- Wind 2/10 Low 3% chance of damaging wind over 30 yrs
- Air quality 1/10 Low 0 unhealthy d/yr today · 0 by 30 yrs out
Nearby sold comps map
Loading sold comps map…
Walkable amenities ~0.75 mi
Loading nearby amenities…
Taxation est. · year 1
- Rental income
- $31,637
- − Mortgage interest
- −$17,645
- − Property taxes
- −$2,303
- − Insurance
- −$1,575
- − Repairs & maintenance
- −$2,531
- − Management
- −$2,531
- − HOA
- −$228
- − Depreciation
- −$9,164
- Taxable loss
- −$4,339
- Est. tax savings @ 24.0%
- +$1,041
- After-tax cash flow
- $2,106/yr
For passive investors: Depreciation is non-cash, so a rental often shows a tax loss while cash-flowing — sheltering income. Rental losses are passive: they offset passive income freely, and up to $25,000/yr can offset ordinary (W-2) income if you actively participate and your MAGI is under $100k (phasing out to $0 by $150k); unused losses carry forward. On sale, claimed depreciation is recaptured at up to 25%, and gains may owe capital-gains tax (a 1031 exchange can defer both). Figures are a year-1 estimate at your 24.0% rate — not tax advice; consult a CPA.
Schools (NCES district)
- District
- Fayette County
- NCES district ID
- 2101860
- Math proficiency
- 35% ▼ -16.00%
- Reading proficiency
- 45% ▼ -13.00%
- Median HH income
- $49,245
- Composite
- 34.38/100
- National rank
- #5211
- State rank
- #27 of 165 in KY
Livability — Lexington-Fayette
No livability data for this city. (Only ~50 U.S. cities are tracked.)
Census & demographics
- Census place
- Lexington-Fayette, KY
- County
- Fayette County · 317,143 people
- City population
- 321,882
- Metro
- Lexington-Fayette, KY
- Population (ZIP)
- 47,036
- Household income
- $94,804
- Rent vs Own
- Severe rent burden
- 1763.0
Population outlook (Fayette County) Hauer SSP2
- Today (2025)
- 363,454 people
- By 2030
- 388,270 · +6.8%
- By 2040
- 438,688 · +20.7%
- By 2050
- 490,667 · +35.0%
- By 2075
- 625,394 · +72.1%
- By 2100
- 721,354 · +98.5%
Race, ethnicity, and origin ACS 2023
- Neighborhood character
- Predominantly White (67%)
- Race & ethnicity
- White 67% Black 14% Two or more races 8% Asian 7% Hispanic / Latino 7%
- Hispanic origin (detail)
- Mexican 4%
- Common ancestry
- Italian 2% Slovak 2% Romanian 2%
- Foreign-born
- 12% · Canada, China
- Languages at home
- 84% English-only · Spanish 6% Other Indo-European 3% Other Asian/Pacific 2%
Political lean MEDSL · Fayette
- 2024 margin
- D (+18.1) · D 58.0% · R 39.9% · Other 2.1%
- 2008→2024 swing
- +13.3pp toward D · 2008: 4.8pp · 2024: 18.1pp
- All cycles
- 2024: D+18.1 2020: D+20.8 2016: D+9.5 2012: D+1.0 2008: D+4.8
Not yet ingested
- Civics
- —
Market trends
- HPI YoY
- ▼ -58.72%
- Current HPI
- 226.8663
- Rent YoY
- ▲ 2.22%
- Metro
- Lexington-Fayette, KY
- State GDP YoY
- ▲ 1.81%
- F500 in state
- 4
Industry mix (Fortune 500 HQ in KY)
| Industry | F500 HQs | Revenue |
|---|---|---|
| Healthcare | 1 | $118B |
|
||
| Food / Beverage | 1 | $7B |
|
||
Price history
+49.6% since first listed4 events — show timeline
- 2026-06-04 Listed $315,000 ImagineMLS
- 2000-06-29 Sold (MLS) $205,000 ImagineMLS
- 2000-05-25 Listing Removed — ImagineMLS
- 2000-04-17 Listed $210,500 ImagineMLS
Property tax history
+1.3%/yrLatest (2015): $2,303 · +1.3% YoY. Source: county tax records.
Cash-flow waterfall
monthlySold comps — $/sqft
last 12 mo · ≤1 miLoading sold comps…