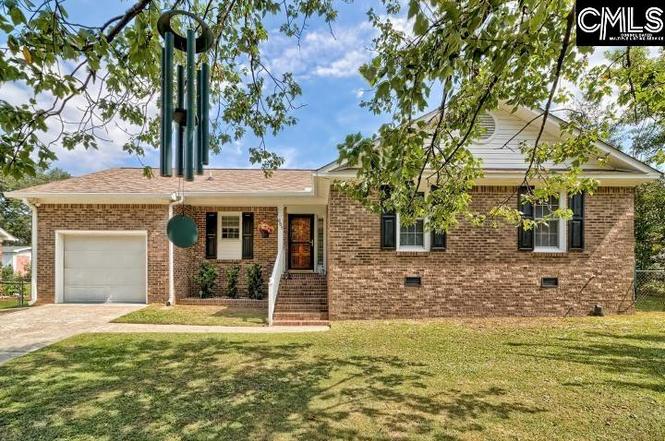
501 Sheridan Dr · Dentsville, SC
Flood risk No data
- FEMA flood zone
- —
- Chance of flooding over 30 yrs
- —
- Est. flood insurance / yr
- —
Fire risk No data
- Est. fire insurance / yr
- —
Heat risk No data
- Hot days now (above threshold)
- —
- Hot days in 30 yrs
- —
Wind risk No data
- Chance of severe wind over 30 yrs
- —
Air-quality risk No data
- Unhealthy air days now
- —
- Unhealthy air days in 30 yrs
- —
Risk factors via First Street. Map © Google.
Why this score? — see what drove the D grade
The composite is a weighted blend of 9 inputs, each scored 0–100. Each bar is that input's sub-score; the figure is the points it added to the 100-point composite (weight × sub-score).
- Cash flow +12.1/30.0
- ARV discount +7.5/15.0
- Appreciation +5.0/10.0
- DSCR +3.6/10.0
- Schools +3.6/10.0
- Livability +3.6/5.0
- Rent growth +2.5/5.0
- Condition / age +2.5/5.0
- 1% rule +2.2/10.0
$242,900
🖨 Deal sheet (PDF) 📄 Offer letter ✓ Due diligence
Listing remarks
Welcome to this charming all-brick home that combines timeless appeal with modern updates. This home features a kitchenette to host your family gathers, a great-room & kitchen with elegant chair-railing, and solid surface countertops. Enjoy the comfort of clean, soft carpet throughout and a sunroom equipped with heated/cooling unit-perfect for year-round relaxation. This home also boasts an attached garage, and a double driveway that fits up to eight cars! Plus, no HOA to worry about, roof replaced in 2014 and all plumbing updated in 2020. A detached 12x20 storage shed with power is ready for all your gardening supplies or storage miscellaneous. Disclaimer: CMLS has not reviewed and,
Key facts
- Kitchenette
- Attached garage
- Double driveway
Tags
Neighborhood map
What this means for you Summary
Snapshot
- This is a 3-bed/2.0-bath single-family listed at $243k.
Deal economics
- At list price, monthly cash flow is $-55 ($-664/yr) — negative.
- To cash-flow at today's rent, offer at most $233k (4.0% below list).
- To meet the 1% rule (rent ≥ 1% of price), the offer needs to be $176k (27.7% below list).
- Recommended offer: $176k (27.7% below list) — sets the bar for 1% rule.
Location & tenants
- Location reads 71/100 on livability (#50 in SC) — a middle-class / working-renter tenant base. Strengths: cost of living A+, health & safety A+, housing A; Watch: amenities D+, crime F, commute F.
- Richland 02 (suburban): math 35% / reading 47% proficiency, ranked #29 of 80 in SC (top 36%) — families likely to look elsewhere, expect single-tenant / working-renter base with shorter leases.
- Zoned schools: L. B. Nelson Elementary (math 39% / reading 43%, grade F, #276 of 597 statewide, top 48%, 567 students, 76% FRL); Spring Valley High (math 53% / reading 92%, grade B+, #46 of 196 statewide, top 24%, 2,187 students, 49% FRL) — zoned schools average 62% FRL vs 38% district-wide (24 pts higher); higher-poverty schools than district average — tighter screening recommended.
- Zoned-school proficiency averages 57% at this address vs 41% district-wide (+16 pts) — the actual schools serving this property are materially stronger than the Richland 02 average implies; a family-tenant draw the district grade alone would hide.
- Market conditions: 1 active listings in the ZIP; 7 comparable units currently listed for rent nearby; rentals at typical pace (median 16d on market — plan ~3-4 weeks tenant-placement turnaround); 3,472 units permitted in Richland County in 2024 (1,096 in 5+ unit buildings).
Forward outlook
- In year one you build about $9k of equity ($2k loan paydown + $7k appreciation (3.0% local appreciation)).
- Richland County population projected at +30% by 2050 — long-run rental-demand tailwind backs the buy-and-hold thesis.
- At projected returns (3.0% appreciation + 3.0% rent growth), your $68k cash investment doubles in ~7 years — after that, you're playing with house money.
- By year 4, paydown + projected appreciation supports a ~$30k cash-out refi (75% LTV) — recoverable capital for the next deal without selling this one.
Negotiation context
- It's been on market 243 days — a 12% lower offer ($214k) is reasonable based on typical stale-listing flexibility.
- Current owner paid $60k; list at $243k implies a 301% gain — meaningful room to come down on a strong offer.
Questions for the listing agent
- What do current leases actually rent for vs. the listed asking? Can we see a recent rent roll and the last 12 months of T-12 income?
- It's been on market 243 days. Have you received any prior offers? Is the seller open to a 28% concession, seller financing, or rate buy-down credit?
- Why hasn't it sold? Are there any deal-killer items the seller is aware of (foundation, flood, title, zoning, code violations)?
- Is there a deadline driving the sale (1031 exchange, divorce, estate, relocation)? That informs how much negotiation room exists.
- Schools are D-rated, which usually means shorter tenancies and higher turnover. Who's the typical renter profile here, and what's been the actual vacancy rate?
- Crime grade is F in this area — have there been break-ins, vandalism, or insurance claims at this property in the last 3 years? What carrier currently insures it and at what premium?
- The area grade is low — what's the realistic commute time and amenity access for the typical tenant pool here? Any planned neighborhood developments (good or bad) we should know about?
- What's the average days-on-market for RENTAL listings here right now (not sales)? A rising rental-DOM trend means longer vacancies and softer asking-rent achievability than the comps imply.
- What's the recent tenant-quality profile in this submarket — average credit score on applications, eviction rate, late-payment / NSF rate, and stable-employment percentage? A property-management company in the area should have these aggregated.
- How much new for-sale + rental construction is in the pipeline within 1–3 miles? Heavy new supply typically softens prices + rents 12–24 months out; constrained supply supports both.
Investment metrics
- 1% rule
- 0.72% ✗
- Cap rate
- 6.02%
- Cash-on-cash
- -0.98%
- DSCR
- 0.96
- GRM
- 11.5
CMA / ARV
No comps found within radius.
Projected returns pro-forma
3.0% appreciation · 3.0% rent growth · sell at horizon
- IRR
- 6.6%
- Equity multiple
- 1.38×
- Total profit
- $25,616
- Equity at exit
- $109,218
- IRR
- 9.4%
- Equity multiple
- 2.41×
- Total profit
- $96,008
- Equity at exit
- $168,319
Cash invested: $68,012 (down + closing). Projections, not guarantees.
Landlord ↔ Tenant lean methodology
- Overall (STATE)
- 90 Strongly Landlord-Friendly
- State South Carolina
- 90 Strongly Landlord-Friendly · R+6
- County
- — inherits STATE
- City
- — inherits STATE
ZIP-level market 29223-5328
- Active inventory
- 1
- Price-to-rent
- 11.5×
Monthly cashflow live
- Estimated rent
- $1,757 high interval (Pro) →
- Mortgage (P&I)
- −$1,274
- Tax from tax record
- −$68 /mo · $817/yr
- Insurance
- −$101
- HOA
- −$0
- Vacancy / Maint / Mgmt
- −$369
- Net cashflow
- $-55
Break-even live
Sensitivity live
| Price | -10% $82 | -5% $13 | +0% $-55 | +5% $-124 | +10% $-193 |
|---|---|---|---|---|---|
| Rent | -10% $-194 | -5% $-125 | +0% $-55 | +5% $14 | +10% $83 |
| Rate | -1.0pp $67 | -0.5pp $6 | base $-55 | +0.5pp $-118 | +1.0pp $-182 |
UW: 25.0% down · 7.5% · 30yr · 1.5% tax · 5.0% vac · 8.0% maint · 8.0% mgmt
Financing live
Cash to close
- Down payment
- $60,725
- Closing costs
- $7,287
- Reserves months
- —
- Total cash needed
- —
Loan-product check · same deal, 3 products live
Conventional
25% down · 7.5% · 30yr
- Down + closing
- —
- Monthly P&I
- —
- Monthly cashflow
- —
- DSCR
- —
- Eligible?
- —
Personal DTI + credit; lowest rate.
DSCR
20% down · 8.5% · 30yr
- Down + closing
- —
- Monthly P&I
- —
- Monthly cashflow
- —
- DSCR
- —
- Eligible?
- —
No personal income docs; deal must DSCR.
Hard money
10% down · 12.0% · 12mo
- Down + closing
- —
- Monthly P&I
- —
- Monthly cashflow
- —
- DSCR
- —
- Eligible?
- —
Short-term bridge; refi at stabilization.
Rent comps 7 comps
| Address | Beds | Baths | Sqft | Rent | $/sqft | DOM | Units | Dist |
|---|---|---|---|---|---|---|---|---|
| 109 Jaybird Ln Columbia, SC | 3.0 | 2.0 | 1250 | $1,679 | $1.34 | 4d | 1 | 0.91mi |
| 916 N Brickyard Rd Columbia, SC | 3.0 | 2.0 | 1350 | $1,695 | $1.26 | 16d | 1 | 0.95mi |
| 136 Westport Dr Columbia, SC | 3.0 | 2.0 | 1303 | $1,769 | $1.36 | 23d | 1 | 1.04mi |
| 108 Quinton Ln Columbia, SC | 3.0 | 2.0 | 1052 | $1,749 | $1.66 | 23d | 1 | 1.24mi |
| 4500 Hard Scrabble Rd Columbia, SC | 1.0–3.0 | 1.0–2.0 | 1031 | $1,455 | $1.41 | 4d | 4 | 1.43mi |
| 440 Town Center Pl Columbia, SC | 1.0–2.0 | 1.0–2.0 | 1016 | $2,610 | $2.57 | 5d | 17 | 1.45mi |
| 423 Elders Pond Cir Columbia, SC | 2.0 | 2.0 | 1125 | $1,475 | $1.31 | 21d | 1 | 1.48mi |
Listing history 23 events
-
2026-06-22days on market $242,900 Active 243 DOM
-
2026-06-18days on market $242,900 Active 240 DOM
-
2026-06-17days on market $242,900 Active 239 DOM
-
2026-06-16days on market $242,900 Active 238 DOM
-
2026-06-15days on market $242,900 Active 237 DOM
-
2026-06-14days on market $242,900 Active 235 DOM
-
2026-06-13days on market $242,900 Active 234 DOM
-
2026-06-10days on market $242,900 Active 232 DOM
-
2026-06-09days on market $242,900 Active 231 DOM
-
2026-06-08days on market $242,900 Active 230 DOM
-
2026-06-07days on market $242,900 Active 229 DOM
-
2026-06-05days on market $242,900 Active 226 DOM
-
2026-06-03days on market $242,900 Active 225 DOM
-
2026-06-03days on market $242,900 Active 224 DOM
-
2026-06-01days on market $242,900 Active 223 DOM
-
2026-05-31days on market $242,900 Active 222 DOM
-
2026-04-13status Pending
-
2026-03-30price $242,900
-
2025-11-26price $249,900
-
2025-10-29price $259,900
-
2025-10-07price $264,900
-
2025-09-05$269,800 Active
-
1983-07-01soldstatus $60,500
ⓘ Source: listings_history table (triggers on properties + properties_extension) + one-shot
backfill from property_details.listing_events for pre-trigger history.
Tax reassessment forecast SC · Resets to sale price
- Current annual tax
- $817 · $68/mo
- Projected year-2 tax
- $1,385 · $115/mo
- Expected delta
- +$568/yr (+$47/mo · 69.5%)
ⓘ Screening estimate from a state-policy table — verify with the county assessor before closing.
Nearby sold comps map
Loading sold comps map…
Walkable amenities ~0.75 mi
Loading nearby amenities…
Taxation est. · year 1
- Rental income
- $21,079
- − Mortgage interest
- −$13,606
- − Property taxes
- −$817
- − Insurance
- −$1,214
- − Repairs & maintenance
- −$1,686
- − Management
- −$1,686
- − Depreciation
- −$7,066
- Taxable loss
- −$4,997
- Est. tax savings @ 24.0%
- +$1,199
- After-tax cash flow
- $535/yr
For passive investors: Depreciation is non-cash, so a rental often shows a tax loss while cash-flowing — sheltering income. Rental losses are passive: they offset passive income freely, and up to $25,000/yr can offset ordinary (W-2) income if you actively participate and your MAGI is under $100k (phasing out to $0 by $150k); unused losses carry forward. On sale, claimed depreciation is recaptured at up to 25%, and gains may owe capital-gains tax (a 1031 exchange can defer both). Figures are a year-1 estimate at your 24.0% rate — not tax advice; consult a CPA.
Schools (NCES district)
- District
- Richland 02
- NCES district ID
- 4503390
- Math proficiency
- 35% ▼ -15.00%
- Reading proficiency
- 47% ▼ -5.00%
- Median HH income
- $59,684
- Composite
- 36.2/100
- National rank
- #4730
- State rank
- #29 of 80 in SC
Livability — Dentsville
- Score
- 71/100
- State rank
- #50
- US rank
- #6940
Category grades
Schools grade is shown separately in the Schools card above.
Census & demographics
No demographic data for this ZIP.
Market trends
- HPI YoY
- —
- Current HPI
- —
- Rent YoY
- —
- Metro
- —
- State GDP YoY
- ▲ 4.51%
- F500 in state
- 2
Industry mix (Fortune 500 HQ in SC)
| Industry | F500 HQs | Revenue |
|---|---|---|
| Packaging | 1 | $7B |
|
||
Price history
+301.5% since first listed7 events — show timeline
- 2026-04-13 Pending — Consolidated MLS
- 2026-03-30 Price Changed $242,900 Consolidated MLS
- 2025-11-26 Price Changed $249,900 Consolidated MLS
- 2025-10-29 Price Changed $259,900 Consolidated MLS
- 2025-10-07 Price Changed $264,900 Consolidated MLS
- 2025-09-05 Listed $269,800 Consolidated MLS
- 1983-07-01 Sold (Public Records) $60,500 Public Records
Property tax history
+3.4%/yrLatest (2025): $817 · +3.5% YoY. Source: county tax records.
Cash-flow waterfall
monthlySold comps — $/sqft
last 12 mo · ≤1 miLoading sold comps…