 Fourplex
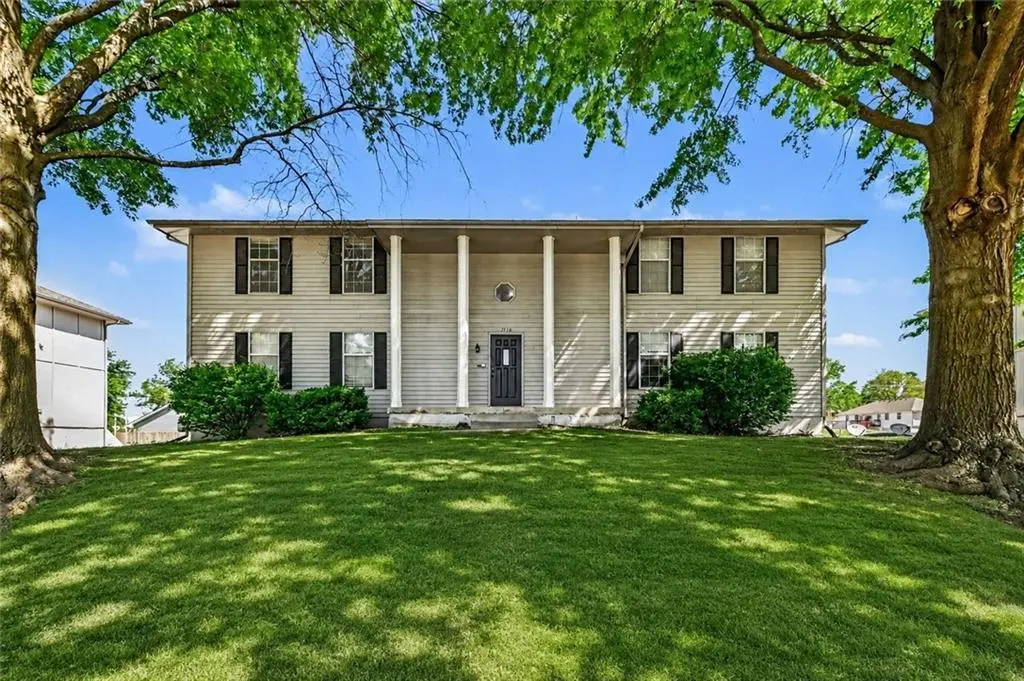
1310 NW Valley Woods Ct · Grain Valley, MO
Flood risk 1/10 · Minimal
- FEMA flood zone
- X (unshaded)
- Chance of flooding over 30 yrs
- 0.0%
- Est. flood insurance / yr
- $473 – $860
Fire risk 3/10 · Minor
- Est. fire insurance / yr
- $1,054 – $1,958
Heat risk 4/10 · Minor
- Hot days now (above 107°F)
- 7 days/yr
- Hot days in 30 yrs
- 16 days/yr
Wind risk 2/10 · Minimal
- Chance of severe wind over 30 yrs
- —
Air-quality risk 3/10 · Minor
- Unhealthy air days now
- 3 days/yr
- Unhealthy air days in 30 yrs
- 4 days/yr
Risk factors via First Street. Map © Google.
Why this score? — see what drove the C grade
The composite is a weighted blend of 9 inputs, each scored 0–100. Each bar is that input's sub-score; the figure is the points it added to the 100-point composite (weight × sub-score).
- Cash flow +22.3/30.0
- ARV discount +7.5/15.0
- DSCR +7.1/10.0
- 1% rule +5.8/10.0
- Schools +4.4/10.0
- Rent growth +4.3/5.0
- Livability +3.8/5.0
- Condition / age +3.8/5.0
- Appreciation +0.0/10.0
$535,000
🖨 Deal sheet 📄 Offer letter ✓ Due diligence
Multi-family units
County records classify this as Multi-Family (2-4 Unit). Listing-text estimate: 4 units. confirmed
Listing remarks MLS
Corporate owned property being sold "as is no warranties, no guarantees, no disclosures expressed or implied. 4-plex in fairly good shape, Has had a roof leak, may still have. 3 units in pretty good shape, 1 needs more work. This one won't take much to get it ready for tenants. Each unit has laundry & 1 car garage.
Key facts
- Private balconies
- Modern finishes
- Top rated schools
Tags
Property features AI
Finance
- Other: Zoned R-1140
- Financial info: Gross income reported: $51,840; Operating expenses include real estate tax
- HOA & community: No association fees
Exterior
- Parking: Garage parking (total 4 spaces)
- Utilities: Public water; Public sewer; Separate meters for utilities
- Home design: Residential income property (quadruplex); 2-story building
- Construction: Wood siding exterior; Composition roof
- Exterior features: Not in a flood plain
Interior
- Kitchen: No kitchen appliance details provided
- Bedrooms: Four 2-bedroom units
- Bathrooms: Each unit has 1 bathroom
- Heating & cooling: Natural gas heating; Electric cooling (central cooling present)
- Interior features: Common entry; Basement present
- Laundry & utility: Inside laundry; Separate utility meters
Neighborhood map
What this means for you Summary
Snapshot
- This is a 4 × 2-bed/1.0-bath units multifamily listed at $535k. Condition is rated good.
Deal economics
- At list price, monthly cash flow is $877 ($11k/yr) — positive. Per door: $219/mo.
- The deal already cash-flows at list — no discount required.
- Meets the 1% rule at list price ($6k rent vs $535k).
- Recommended offer: $527k (1.5% below list) — sets the bar for market timing.
- Cap rate 8.3% vs local median 3.6% in Grain Valley — top-decile yield for the area; either an underpriced asset or a hidden risk that comps aren't pricing in. Stress-test before assuming the spread holds.
Location & tenants
- Location reads 76/100 on livability (#41 in MO, #3,383 nationally) — a middle-class / working-renter tenant base. Strengths: employment A+, cost of living A+, housing A+; Watch: amenities F, commute F.
- Grain Valley R-V (suburban): math 45% / reading 54% proficiency, ranked #30 of 324 in MO (top 9%) — families likely to look elsewhere, expect single-tenant / working-renter base with shorter leases; only 17% free/reduced lunch — higher-income household profile.
- Zoned schools: Grain Valley High (math 25% / reading 68%, grade D-, #169 of 521 statewide, top 32%, 1,438 students, 22% FRL).
- Market conditions: Rents rising fast (+7.0%/yr); 109 active listings in the ZIP; solid renter incomes; 4,002 units permitted in Jackson County in 2024 (2,271 in 5+ unit buildings).
- At $5,790/mo this rent would consume 76% of the median local household income ($92k/yr) (locally 218% of renters already pay >50% of income on rent) — very limited rent-growth headroom before tenants either downsize or default.
Forward outlook
- Local home prices are declining (-3.0%/yr); year-one equity from $4k of loan paydown is wiped out by about $16k of value loss. Plan a longer hold.
- Jackson County population projected at +4% by 2050 — modest demand growth; plan on rents tracking national, not racing it.
- At projected returns (-3.0% appreciation + 7.0% rent growth), your $150k cash investment doubles in ~9 years — after that, you're playing with house money.
Negotiation context
- It's been on market 23 days — a 2% lower offer ($527k) is reasonable based on typical stale-listing flexibility.
- 5 sale attempts since 19y ago with the ask held roughly flat each time — persistent listings suggest the price (not the market) is what's stuck; bring a comps-based counter.
Questions for the listing agent
- Can we see the unit-by-unit rent roll, current vacancy, and any below-market leases? What's the average tenancy length?
- What capital expenditures (roof, boiler, parking lot, exteriors) have been made in the last 5 years, and what's planned in the next 2?
- Is there a deadline driving the sale (1031 exchange, divorce, estate, relocation)? That informs how much negotiation room exists.
- What's the average days-on-market for RENTAL listings here right now (not sales)? A rising rental-DOM trend means longer vacancies and softer asking-rent achievability than the comps imply.
- What's the recent tenant-quality profile in this submarket — average credit score on applications, eviction rate, late-payment / NSF rate, and stable-employment percentage? A property-management company in the area should have these aggregated.
- How much new apartment / multifamily construction is in the pipeline within 1–3 miles? Heavy new supply (>2% of stock underway) typically softens rents 12–24 months out; light construction supports rent growth.
Investment metrics
- 1% rule
- 1.08% ✓
- Cap rate
- 8.26%
- Cash-on-cash
- 7.02%
- DSCR
- 1.31
- GRM
- 7.7
CMA / ARV
No comps found within radius.
Projected returns pro-forma
-3.0% appreciation · 7.03% rent growth · sell at horizon
- IRR
- -1.1%
- Equity multiple
- 0.96×
- Total profit
- $-6,331
- Equity at exit
- $79,770
- IRR
- 12.5%
- Equity multiple
- 2.17×
- Total profit
- $175,687
- Equity at exit
- $46,257
Cash invested: $149,800 (down + closing). Projections, not guarantees.
Landlord ↔ Tenant lean methodology
- Overall (STATE)
- 81 Strongly Landlord-Friendly
- State Missouri
- 81 Strongly Landlord-Friendly · R+10
- County
- — inherits STATE
- City
- — inherits STATE
ZIP-level market 64029
- Home prices YoY
- -24.2%
- Rents YoY
- 7.0%
- Active inventory
- 109
- Price-to-rent
- 30.8×
Monthly cashflow live
- Estimated rent
- $5,790 high interval (Pro) →
- Mortgage (P&I)
- −$2,806
- Tax est. 1.5%
- −$669 /mo · $8,025/yr
- Insurance
- −$223
- HOA
- −$0
- Vacancy / Maint / Mgmt
- −$1,216
- Net cashflow
- $877
Break-even live
4-unit breakdown (identical units grouped — click to expand)
| Units | Beds | Baths | Est. rent |
|---|---|---|---|
| 4× units | 2 | 1 | $5,788 |
| #1 | 2 | 1 | $1,447 |
| #2 | 2 | 1 | $1,447 |
| #3 | 2 | 1 | $1,447 |
| #4 | 2 | 1 | $1,447 |
| Total (4 units) | $5,790 | ||
UW: 25.0% down · 7.5% · 30yr · 1.5% tax · 5.0% vac · 8.0% maint · 8.0% mgmt
Financing live
Cash to close
- Down payment
- $133,750
- Closing costs
- $16,050
- Reserves months
- —
- Total cash needed
- —
Loan-product check · same deal, 3 products live
Conventional
25% down · 7.5% · 30yr
- Down + closing
- —
- Monthly P&I
- —
- Monthly cashflow
- —
- DSCR
- —
- Eligible?
- —
Personal DTI + credit; lowest rate.
DSCR
20% down · 8.5% · 30yr
- Down + closing
- —
- Monthly P&I
- —
- Monthly cashflow
- —
- DSCR
- —
- Eligible?
- —
No personal income docs; deal must DSCR.
Hard money
10% down · 12.0% · 12mo
- Down + closing
- —
- Monthly P&I
- —
- Monthly cashflow
- —
- DSCR
- —
- Eligible?
- —
Short-term bridge; refi at stabilization.
Listing history 23 events
-
2026-06-18days on market $535,000 Active 23 DOM
-
2026-06-17days on market $535,000 Active 22 DOM
-
2026-06-16days on market $535,000 Active 21 DOM
-
2026-06-15days on market $535,000 Active 20 DOM
-
2026-06-13days on market $535,000 Active 18 DOM
-
2026-06-13days on market $535,000 Active 17 DOM
-
2026-06-09days on market $535,000 Active 14 DOM
-
2026-06-08days on market $535,000 Active 13 DOM
-
2026-06-07days on market $535,000 Active 12 DOM
-
2026-06-05days on market $535,000 Active 9 DOM
-
2026-06-03days on market $535,000 Active 8 DOM
-
2026-06-02days on market $535,000 Active 7 DOM
-
2026-06-01days on market $535,000 Active 6 DOM
-
2026-05-31days on market $535,000 Active 5 DOM
-
2026-05-26$535,000 Active
-
2023-11-15soldstatus Closed
-
2023-09-19status Pending
-
2023-09-19status Active
-
2023-08-24status Pending
-
2023-08-23$420,000 Active
-
2009-05-21soldstatus 327-char remark
Show marketing remark (327 chars)
Corporate owned property being sold "as is no warranties, no guarantees, no disclosures expressed or implied. 4-plex in fairly good shape, Has had a roof leak, may still have. 3 units in pretty good shape, 1 needs more work. This one won't take much to get it ready for tenants. Each unit has laundry & 1 car garage.
-
2008-12-18$129,000 327-char remark
Show marketing remark (327 chars)
Corporate owned property being sold "as is no warranties, no guarantees, no disclosures expressed or implied. 4-plex in fairly good shape, Has had a roof leak, may still have. 3 units in pretty good shape, 1 needs more work. This one won't take much to get it ready for tenants. Each unit has laundry & 1 car garage.
-
2007-12-27$255,000
ⓘ Source: listings_history table (triggers on properties + properties_extension) + one-shot
backfill from property_details.listing_events for pre-trigger history.
Climate risk First Street
- Flood 1/10 Low FEMA zone X (unshaded) · 0% chance over 30 yrs
- Wildfire 3/10 Moderate
- Heat 4/10 Moderate 7 d/yr ≥107°F today · 16 d/yr by 30 yrs out
- Wind 2/10 Low
- Air quality 3/10 Moderate 3 unhealthy d/yr today · 4 by 30 yrs out
Nearby sold comps map
Loading sold comps map…
Walkable amenities ~0.75 mi
Loading nearby amenities…
Taxation est. · year 1
- Rental income
- $69,480
- − Mortgage interest
- −$29,968
- − Property taxes
- −$8,025
- − Insurance
- −$2,675
- − Repairs & maintenance
- −$5,558
- − Management
- −$5,558
- − Depreciation
- −$15,564
- Taxable income
- $2,131
- Est. tax owed @ 24.0%
- −$511
- After-tax cash flow
- $10,011/yr
For passive investors: Depreciation is non-cash, so a rental often shows a tax loss while cash-flowing — sheltering income. Rental losses are passive: they offset passive income freely, and up to $25,000/yr can offset ordinary (W-2) income if you actively participate and your MAGI is under $100k (phasing out to $0 by $150k); unused losses carry forward. On sale, claimed depreciation is recaptured at up to 25%, and gains may owe capital-gains tax (a 1031 exchange can defer both). Figures are a year-1 estimate at your 24.0% rate — not tax advice; consult a CPA.
Condition & rehab AI · 12 photos
This well-maintained fourplex is ready for tenants with modern finishes and a good condition. A fresh coat of paint and some minor updates would significantly enhance its resale and rental value.
Value-add opportunities
- Both Paint exterior — Enhances curb appeal and resale value
- Both Replace ceiling fans — Modernizes the space and improves air circulation
- Both Install smart home devices — Enhances convenience and energy efficiency
Renovation cost estimate screening
Value-add ROI direction
- Both Paint exterior — Enhances curb appeal and resale value ↑
- Both Replace ceiling fans — Modernizes the space and improves air circulation ↑
- Both Install smart home devices — Enhances convenience and energy efficiency ↑
ⓘ Cost ranges are severity-bucket heuristics (US national rule-of-thumb). Get contractor quotes + a written scope before underwriting a rehab budget.
Schools (NCES district)
- District
- Grain Valley R-V
- NCES district ID
- 2913080
- Math proficiency
- 45% ▼ -4.00%
- Reading proficiency
- 54% ▼ -1.00%
- Median HH income
- $67,451
- Composite
- 44.01/100
- National rank
- #2888
- State rank
- #30 of 324 in MO
Livability — Grain Valley
- Score
- 76/100
- State rank
- #41
- US rank
- #3383
Category grades
Schools grade is shown separately in the Schools card above.
Census & demographics
- Census place
- Grain Valley, MO
- County
- Jackson County · 687,798 people
- City population
- 21,961
- Metro
- Kansas City, MO-KS
- Population (ZIP)
- 21,961
- Household income
- $91,704
- Rent vs Own
- Severe rent burden
- 218.0
Population outlook (Jackson County) Hauer SSP2
- Today (2025)
- 719,589 people
- By 2030
- 731,456 · +1.6%
- By 2040
- 746,689 · +3.8%
- By 2050
- 749,289 · +4.1%
- By 2075
- 736,227 · +2.3%
- By 2100
- 668,210 · -7.1%
Race, ethnicity, and origin ACS 2023
- Neighborhood character
- Predominantly White (86%)
- Race & ethnicity
- White 86% Two or more races 5% Hispanic / Latino 5% Black 5%
- Common ancestry
- Italian 17% Lithuanian 2% Slovak 2%
- Foreign-born
- 2% · Canada
- Languages at home
- 97% English-only · Spanish 2%
Political lean MEDSL · Jackson
- 2024 margin
- D (+19.3) · D 58.9% · R 39.5% · Other 1.6%
- 2008→2024 swing
- -6.1pp toward R · 2008: 25.4pp · 2024: 19.3pp
- All cycles
- 2024: D+19.3 2020: D+22.0 2016: D+16.6 2012: D+19.0 2008: D+25.4
Not yet ingested
- Civics
- —
Market trends
- HPI YoY
- ▼ -72.90%
- Current HPI
- 228.5568
- Rent YoY
- ▲ 7.03%
- Metro
- Kansas City, MO-KS
- State GDP YoY
- ▲ 1.84%
- F500 in state
- 20
Industry mix (Fortune 500 HQ in MO)
| Industry | F500 HQs | Revenue |
|---|---|---|
| Healthcare | 1 | $163B |
|
||
| Insurance | 1 | $21B |
|
||
| Industrial Technology | 1 | $17B |
|
||
| Retail | 1 | $16B |
|
||
| Industrial Distribution | 1 | $10B |
|
||
| Utilities | 1 | $9B |
|
||
Price history
+109.8% since first listed9 events — show timeline
- 2026-05-26 Listed $535,000 Heartland MLS as Distributed by MLS Grid
- 2023-11-15 Sold (MLS) — Heartland MLS as Distributed by MLS Grid
- 2023-09-19 Pending — Heartland MLS as Distributed by MLS Grid
- 2023-09-19 Relisted — Heartland MLS as Distributed by MLS Grid
- 2023-08-24 Pending — Heartland MLS as Distributed by MLS Grid
- 2023-08-23 Listed $420,000 Heartland MLS as Distributed by MLS Grid
- 2009-05-21 Sold (MLS) — Heartland MLS as Distributed by MLS Grid
- 2008-12-18 Listed $129,000 Heartland MLS as Distributed by MLS Grid
- 2007-12-27 Listed $255,000 Heartland MLS as Distributed by MLS Grid
Cash-flow waterfall
monthlySold comps — $/sqft
last 12 mo · ≤1 miLoading sold comps…