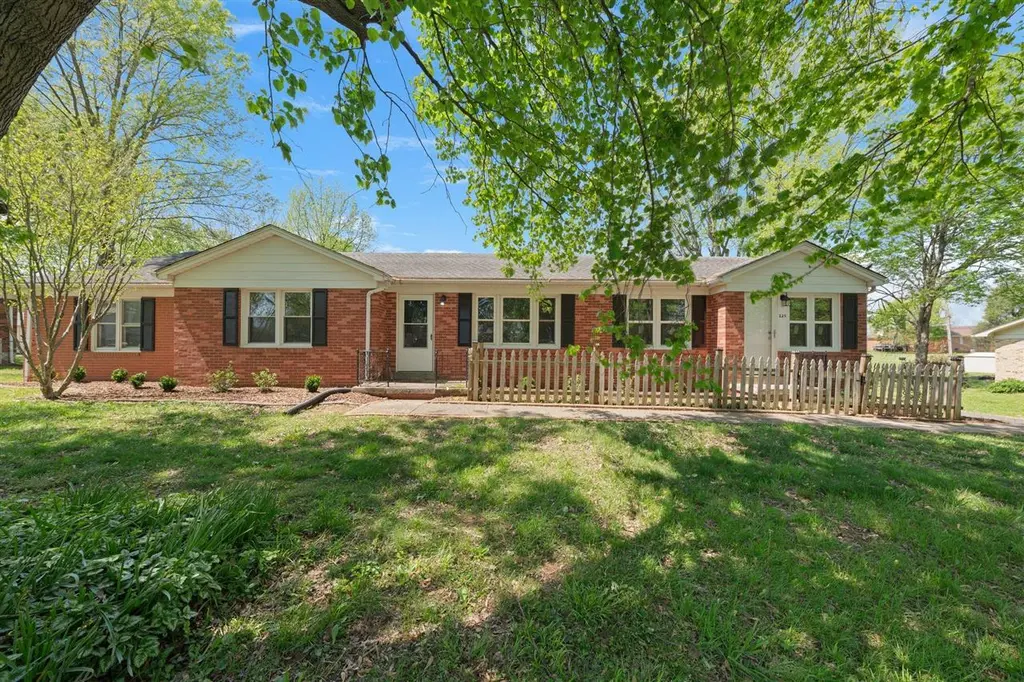
225 Maplemere Dr · Bowling Green, KY
Flood risk 3/10 · Minor
- FEMA flood zone
- X (unshaded)
- Chance of flooding over 30 yrs
- 0.2%
- Est. flood insurance / yr
- $507 – $1,088
Fire risk 1/10 · Minimal
- Est. fire insurance / yr
- $839 – $1,559
Heat risk 5/10 · Moderate
- Hot days now (above 107°F)
- 7 days/yr
- Hot days in 30 yrs
- 19 days/yr
Wind risk 3/10 · Minor
- Chance of severe wind over 30 yrs
- 6.0%
Air-quality risk 2/10 · Minimal
- Unhealthy air days now
- 0 days/yr
- Unhealthy air days in 30 yrs
- 1 days/yr
Risk factors via First Street. Map © Google.
Why this score? — see what drove the D- grade
The composite is a weighted blend of 9 inputs, each scored 0–100. Each bar is that input's sub-score; the figure is the points it added to the 100-point composite (weight × sub-score).
- ARV discount +15.0/15.0
- Cash flow +7.9/30.0
- Schools +3.2/10.0
- Livability +3.2/5.0
- Rent growth +2.5/5.0
- Condition / age +2.5/5.0
- DSCR +2.0/10.0
- 1% rule +1.7/10.0
- Appreciation +0.0/10.0
$299,000
🖨 Deal sheet (PDF) 📄 Offer letter ✓ Due diligence
Listing remarks MLS
This home is eligible for $0 down payment! Welcome to your beautiful, updated ranch home nestled in the peaceful Cumberland Estates neighborhood! This home features 5 bedrooms, 3 full bathrooms, 2 full kitchens and 2 laundry rooms including separate living quarters with its own entrance for the mother in law suite! Inside, you’ll find fresh paint, hardwood flooring, natural light and a large floor plan. Both kitchens are equipped with stainless steel appliances. The primary suite includes a spacious layout and a large walk-in closet and tiled shower, while the private in-law suite features its own entrance, kitchen, bedroom, and full bathroom—ideal for guests, family members, or rental income. Step outside to enjoy a large backyard with mature trees, a wood deck perfect for entertaining, and a storage shed for added convenience. The detached garage adds extra storage or workspace. This home is in the new Cumberland Ridge Elementary School District. Ask about how to get $0 down financing on this home and schedule your tour today!
Key facts
- Wood deck
- Updated ranch home
- Large backyard
Tags
Neighborhood map
What this means for you Summary
Snapshot
- This is a 4-bed/2.0-bath single-family listed at $299k.
Deal economics
- At list price, monthly cash flow is $-318 ($-4k/yr) — negative.
- To cash-flow at today's rent, offer at most $243k (18.8% below list).
- To meet the 1% rule (rent ≥ 1% of price), the offer needs to be $201k (32.7% below list).
- Recommended offer: $201k (32.7% below list) — sets the bar for 1% rule.
- Cap rate 5.0% vs local median 3.0% in Bowling Green — top-decile yield for the area; either an underpriced asset or a hidden risk that comps aren't pricing in. Stress-test before assuming the spread holds.
Location & tenants
- Location reads 65/100 on livability (#255 in KY) — a middle-class / working-renter tenant base. Strengths: cost of living A+, housing A+; Watch: crime C-, amenities F, commute F.
- Warren County (rural): math 30% / reading 43% proficiency, ranked #48 of 165 in KY (top 29%) — families likely to look elsewhere, expect single-tenant / working-renter base with shorter leases.
- Zoned schools: Cumberland Trace Elementary (math 43% / reading 54%, grade D, #110 of 676 statewide, top 17%, 603 students, 52% FRL); Drakes Creek Middle School (math 48% / reading 61%, grade B-, #12 of 217 statewide, top 5%, 729 students, 54% FRL); Greenwood High School (math 39% / reading 47%, grade F, #30 of 254 statewide, top 12%, 1,370 students, 47% FRL).
- Zoned-school proficiency averages 49% at this address vs 36% district-wide (+12 pts) — the actual schools serving this property are materially stronger than the Warren County average implies; a family-tenant draw the district grade alone would hide.
- Market conditions: 290 active listings in the ZIP; 5 comparable units currently listed for rent nearby; rentals lingering (median 46d on market — plan ~5-8 weeks vacancy on turnover, expect pricing pressure); 60% of comp listings sitting > 30 days — soft ceiling on asking rent; solid renter incomes; 2,286 units permitted in Warren County in 2024 (1,410 in 5+ unit buildings).
Forward outlook
- Local home prices are declining (-3.0%/yr); year-one equity from $2k of loan paydown is wiped out by about $9k of value loss. Plan a longer hold.
- Warren County population projected at +41% by 2050 — long-run rental-demand tailwind backs the buy-and-hold thesis.
Negotiation context
- It's been on market 73 days — a 6% lower offer ($281k) is reasonable based on typical stale-listing flexibility.
- 11 sale attempts since 5y ago with the ask held roughly flat each time — persistent listings suggest the price (not the market) is what's stuck; bring a comps-based counter.
- Current owner paid $190k; list at $299k implies a 57% gain — meaningful room to come down on a strong offer.
Risks & watch-outs
- Watch-outs: built in 1957 — expect roof / HVAC / electrical / plumbing capex.
- Climate carrying-cost: extreme-heat days projected 7→19/yr by 2055 (HVAC capex compounding) — expect insurance premiums to compound above CPI over the hold.
Questions for the listing agent
- What do current leases actually rent for vs. the listed asking? Can we see a recent rent roll and the last 12 months of T-12 income?
- It's been on market 73 days. Have you received any prior offers? Is the seller open to a 33% concession, seller financing, or rate buy-down credit?
- Built in 1957 — when were the roof, HVAC, electrical panel, plumbing, and water heater last replaced?
- Why hasn't it sold? Are there any deal-killer items the seller is aware of (foundation, flood, title, zoning, code violations)?
- Is there a deadline driving the sale (1031 exchange, divorce, estate, relocation)? That informs how much negotiation room exists.
- Schools are D-rated, which usually means shorter tenancies and higher turnover. Who's the typical renter profile here, and what's been the actual vacancy rate?
- The area grade is low — what's the realistic commute time and amenity access for the typical tenant pool here? Any planned neighborhood developments (good or bad) we should know about?
- What's the average days-on-market for RENTAL listings here right now (not sales)? A rising rental-DOM trend means longer vacancies and softer asking-rent achievability than the comps imply.
- What's the recent tenant-quality profile in this submarket — average credit score on applications, eviction rate, late-payment / NSF rate, and stable-employment percentage? A property-management company in the area should have these aggregated.
- How much new for-sale + rental construction is in the pipeline within 1–3 miles? Heavy new supply typically softens prices + rents 12–24 months out; constrained supply supports both.
Investment metrics
- 1% rule
- 0.67% ✗
- Cap rate
- 5.02%
- Cash-on-cash
- -4.56%
- DSCR
- 0.80
- GRM
- 12.4
CMA / ARV
- ARV (median comp)
- $376,159
- List price
- $299,000
- Delta
- -20.51%
- Verdict
- UNDERPRICED
- Comps
- 20 within 1.0 mi
Show comp detail 12 sales within ~0.75 mi
| Address | Dist | Beds/Ba | Sqft | Sold | Price | $/sf | Match |
|---|---|---|---|---|---|---|---|
| 2628 Carter Farm Rd | 0.69mi | 3/2.5 (-1) | 2,027 (0%) | 3mo | $409,000 | $202 | 59 |
| 719 Denver Ln | 0.67mi | 3/3.0 (-1) | 2,043 (+1%) | 4mo | $349,900 | $171 | 55 |
| 2562 Carter Farm Rd | 0.69mi | 3/2.0 (-1) | 1,962 (-3%) | 4mo | $375,000 | $191 | 55 |
| 1878 Woodhollow Way | 0.58mi | 3/2.0 (-1) | 1,990 (-2%) | 12mo | $415,000 | $209 | 54 |
| 344 Olympia Ct | 0.66mi | 3/3.0 (-1) | 2,150 (+6%) | 1mo | $409,900 | $191 | 49 |
| 385 Olympia Ct | 0.63mi | 3/2.5 (-1) | 2,148 (+6%) | 8mo | $415,000 | $193 | 47 |
| 2598 Carter Farm Rd | 0.72mi | 4/2.0 | 1,818 (-10%) | 4mo | $389,900 | $214 | 46 |
| 373 Olympia Ct | 0.60mi | 3/3.0 (-1) | 1,899 (-6%) | 10mo | $429,900 | $226 | 44 |
| 329 Olympia Ct | 0.68mi | 3/2.5 (-1) | 1,846 (-9%) | 4mo | $300,000 | $163 | 43 |
| 332 Olympia Ct | 0.69mi | 4/2.5 | 2,271 (+12%) | 5mo | $419,500 | $185 | 42 |
| 2550 Carters Farm Rd | 0.67mi | 3/2.5 (-1) | 2,288 (+13%) | 1mo | $385,000 | $168 | 39 |
| 388 Olympia Ct | 0.66mi | 3/2.0 (-1) | 1,761 (-13%) | 5mo | $348,000 | $198 | 39 |
Match score weights: distance 35% · size 25% · config 20% · recency 20%. Top-matched comps best support the ARV.
Projected returns pro-forma
-3.0% appreciation · 3.0% rent growth · sell at horizon
- IRR
- -24.1%
- Equity multiple
- 0.18×
- Total profit
- $-68,773
- Equity at exit
- $44,582
- IRR
- -19.3%
- Equity multiple
- -0.03×
- Total profit
- $-86,241
- Equity at exit
- $25,852
Cash invested: $83,720 (down + closing). Projections, not guarantees.
Landlord ↔ Tenant lean methodology
- Overall (STATE)
- 83 Strongly Landlord-Friendly
- State Kentucky
- 83 Strongly Landlord-Friendly · R+16
- County
- — inherits STATE
- City
- — inherits STATE
ZIP-level market 42103
- Home prices YoY
- -30.4%
- Active inventory
- 290
- Price-to-rent
- 12.4×
Monthly cashflow live
- Estimated rent
- $2,012 high interval (Pro) →
- Mortgage (P&I)
- −$1,568
- Tax from tax record
- −$215 /mo · $2,578/yr
- Insurance
- −$125
- HOA
- −$0
- Vacancy / Maint / Mgmt
- −$422
- Net cashflow
- $-318
Break-even live
Sensitivity live
| Price | -10% $-149 | -5% $-233 | +0% $-318 | +5% $-403 | +10% $-487 |
|---|---|---|---|---|---|
| Rent | -10% $-477 | -5% $-397 | +0% $-318 | +5% $-239 | +10% $-159 |
| Rate | -1.0pp $-167 | -0.5pp $-242 | base $-318 | +0.5pp $-395 | +1.0pp $-474 |
UW: 25.0% down · 7.5% · 30yr · 1.5% tax · 5.0% vac · 8.0% maint · 8.0% mgmt
Financing live
Cash to close
- Down payment
- $74,750
- Closing costs
- $8,970
- Reserves months
- —
- Total cash needed
- —
Loan-product check · same deal, 3 products live
Conventional
25% down · 7.5% · 30yr
- Down + closing
- —
- Monthly P&I
- —
- Monthly cashflow
- —
- DSCR
- —
- Eligible?
- —
Personal DTI + credit; lowest rate.
DSCR
20% down · 8.5% · 30yr
- Down + closing
- —
- Monthly P&I
- —
- Monthly cashflow
- —
- DSCR
- —
- Eligible?
- —
No personal income docs; deal must DSCR.
Hard money
10% down · 12.0% · 12mo
- Down + closing
- —
- Monthly P&I
- —
- Monthly cashflow
- —
- DSCR
- —
- Eligible?
- —
Short-term bridge; refi at stabilization.
Rent comps 5 comps
| Address | Beds | Baths | Sqft | Rent | $/sqft | DOM | Units | Dist |
|---|---|---|---|---|---|---|---|---|
| 512 Old Lovers Ln Apt 214 Bowling Green, KY | 3.0 | 2.5 | 1915 | $1,950 | $1.02 | 45d | 1 | 0.34mi |
| 512 Old Lovers Ln Unit 413 Bowling Green, KY | 3.0 | 2.5 | 1910 | $1,910 | $1.00 | 45d | 1 | 0.34mi |
| 161 Old Lovers Ln Bowling Green, KY | 1.0–3.0 | 1.0–2.5 | 1100 | $1,400 | $1.27 | 15d | 8 | 0.49mi |
| 564 Cumberland Pointe Ln Bowling Green, KY | 3.0 | 2.5 | 1792 | $2,000 | $1.12 | 45d | 1 | 0.71mi |
| 1258 Ironwood Dr Bowling Green, KY | 4.0 | 2.5 | 2803 | $2,995 | $1.07 | 15d | 1 | 0.76mi |
Listing history 35 events
-
2026-06-22days on market $299,000 Active 73 DOM
-
2026-06-19days on market $299,000 Active 71 DOM
-
2026-06-18days on market $299,000 Active 70 DOM
-
2026-06-17days on market $299,000 Active 69 DOM
-
2026-06-16days on market $299,000 Active 68 DOM
-
2026-06-15days on market $299,000 Active 67 DOM
-
2026-06-14days on market $299,000 Active 65 DOM
-
2026-06-13days on market $299,000 Active 64 DOM
-
2026-06-10days on market $299,000 Active 62 DOM
-
2026-06-09days on market $299,000 Active 61 DOM
-
2026-06-08days on market $299,000 Active 60 DOM
-
2026-06-07days on market $299,000 Active 59 DOM
-
2026-06-05days on market $299,000 Active 56 DOM
-
2026-06-02days on market $299,000 Active 54 DOM
-
2026-06-01days on market $299,000 Active 53 DOM
-
2026-05-31days on market $299,000 Active 52 DOM
-
2026-05-30days on market $299,000 Active 51 DOM
-
2026-04-09$299,000 Active 1056-char remark
Show marketing remark (1056 chars)
This home is eligible for $0 down payment! Welcome to your beautiful, updated ranch home nestled in the peaceful Cumberland Estates neighborhood! This home features 5 bedrooms, 3 full bathrooms, 2 full kitchens and 2 laundry rooms including separate living quarters with its own entrance for the mother in law suite! Inside, you’ll find fresh paint, hardwood flooring, natural light and a large floor plan. Both kitchens are equipped with stainless steel appliances. The primary suite includes a spacious layout and a large walk-in closet and tiled shower, while the private in-law suite features its own entrance, kitchen, bedroom, and full bathroom—ideal for guests, family members, or rental income. Step outside to enjoy a large backyard with mature trees, a wood deck perfect for entertaining, and a storage shed for added convenience. The detached garage adds extra storage or workspace. This home is in the new Cumberland Ridge Elementary School District. Ask about how to get $0 down financing on this home and schedule your tour today!
-
2026-01-07status Active
-
2025-09-19$299,000 Active
-
2025-08-04status Active
-
2025-08-04price $299,000
-
2025-07-22price $299,900
-
2025-06-20$309,000 Active
-
2025-06-06price $309,900
-
2025-05-09$319,900 Active
-
2025-04-21$329,900 Active
-
2025-04-21soldstatus $190,000
-
2023-11-20price $319,900
-
2023-11-10price $325,000
-
2023-11-08$355,000 Active
-
2022-05-20soldstatus $300,000
-
2022-03-28$309,000
-
2022-02-03$281,900
-
2021-08-06$285,900
ⓘ Source: listings_history table (triggers on properties + properties_extension) + one-shot
backfill from property_details.listing_events for pre-trigger history.
Tax reassessment forecast KY · Resets to sale price
- Current annual tax
- $2,578 · $215/mo
- Projected year-2 tax
- $2,578 · $215/mo
- Expected delta
- $0/yr ($0/mo · 0.0%)
ⓘ Screening estimate from a state-policy table — verify with the county assessor before closing.
Climate risk First Street
- Flood 3/10 Moderate FEMA zone X (unshaded) · 20% chance over 30 yrs
- Wildfire 1/10 Low
- Heat 5/10 Major 7 d/yr ≥107°F today · 19 d/yr by 30 yrs out
- Wind 3/10 Moderate 6% chance of damaging wind over 30 yrs
- Air quality 2/10 Low 0 unhealthy d/yr today · 1 by 30 yrs out
Nearby sold comps map
Loading sold comps map…
Walkable amenities ~0.75 mi
Loading nearby amenities…
Taxation est. · year 1
- Rental income
- $24,142
- − Mortgage interest
- −$16,749
- − Property taxes
- −$2,578
- − Insurance
- −$1,495
- − Repairs & maintenance
- −$1,931
- − Management
- −$1,931
- − Depreciation
- −$8,698
- Taxable loss
- −$9,240
- Est. tax savings @ 24.0%
- +$2,218
- After-tax cash flow
- $-1,599/yr
For passive investors: Depreciation is non-cash, so a rental often shows a tax loss while cash-flowing — sheltering income. Rental losses are passive: they offset passive income freely, and up to $25,000/yr can offset ordinary (W-2) income if you actively participate and your MAGI is under $100k (phasing out to $0 by $150k); unused losses carry forward. On sale, claimed depreciation is recaptured at up to 25%, and gains may owe capital-gains tax (a 1031 exchange can defer both). Figures are a year-1 estimate at your 24.0% rate — not tax advice; consult a CPA.
Schools (NCES district)
- District
- Warren County
- NCES district ID
- 2105730
- Math proficiency
- 30% ▼ -18.00%
- Reading proficiency
- 43% ▼ -16.00%
- Median HH income
- $50,092
- Composite
- 31.55/100
- National rank
- #5958
- State rank
- #48 of 165 in KY
Livability — Bowling Green
- Score
- 65/100
- State rank
- #255
- US rank
- #12782
Category grades
Schools grade is shown separately in the Schools card above.
Census & demographics
- County
- Warren County · 129,408 people
- City population
- 129,408
- Metro
- Bowling Green, KY
- Population (ZIP)
- 21,911
- Household income
- $87,689
- Rent vs Own
- Severe rent burden
- 704.0
Population outlook (Warren County) Hauer SSP2
- Today (2025)
- 144,620 people
- By 2030
- 155,977 · +7.9%
- By 2040
- 179,381 · +24.0%
- By 2050
- 203,713 · +40.9%
- By 2075
- 267,291 · +84.8%
- By 2100
- 314,019 · +117.1%
Race, ethnicity, and origin ACS 2023
- Neighborhood character
- Predominantly White (83%)
- Race & ethnicity
- White 83% Black 6% Asian 5% Hispanic / Latino 4% Two or more races 3%
- Common ancestry
- Slovak 4% Italian 2% Romanian 2%
- Foreign-born
- 8% · Canada, Philippines, China
- Languages at home
- 90% English-only · Other Asian/Pacific 4% Spanish 3% Other Indo-European 1%
Political lean MEDSL · Warren
- 2024 margin
- Strong R (+24.3) · D 37.0% · R 61.3% · Other 1.6%
- 2008→2024 swing
- -5.4pp toward R · 2008: -18.9pp · 2024: -24.3pp
- All cycles
- 2024: R+24.3 2020: R+16.8 2016: R+24.2 2012: R+21.8 2008: R+18.9
Not yet ingested
- Civics
- —
Market trends
- HPI YoY
- ▼ -90.89%
- Current HPI
- 208.4381
- Rent YoY
- —
- Metro
- Bowling Green, KY
- State GDP YoY
- ▲ 1.81%
- F500 in state
- 4
Industry mix (Fortune 500 HQ in KY)
| Industry | F500 HQs | Revenue |
|---|---|---|
| Healthcare | 1 | $118B |
|
||
| Food / Beverage | 1 | $7B |
|
||
Price history
+4.6% since first listed18 events — show timeline
- 2026-04-09 Listed $299,000 RASKMLS
- 2026-01-07 Relisted — RASKMLS
- 2025-09-19 Listed $299,000 RASKMLS
- 2025-08-04 Relisted — RASKMLS
- 2025-08-04 Price Changed $299,000 RASKMLS
- 2025-07-22 Price Changed $299,900 RASKMLS
- 2025-06-20 Listed $309,000 RASKMLS
- 2025-06-06 Price Changed $309,900 RASKMLS
- 2025-05-09 Listed $319,900 RASKMLS
- 2025-04-21 Listed $329,900 RASKMLS
- 2025-04-21 Sold (Public Records) $190,000 Public Records
- 2023-11-20 Price Changed $319,900 RASKMLS
- 2023-11-10 Price Changed $325,000 RASKMLS
- 2023-11-08 Listed $355,000 RASKMLS
- 2022-05-20 Sold (MLS) $300,000 RASKMLS
- 2022-03-28 Listed $309,000 RASKMLS
- 2022-02-03 Listed $281,900 RASKMLS
- 2021-08-06 Listed $285,900 RASKMLS
Property tax history
+12.7%/yrLatest (2025): $2,578 · -0.9% YoY. Source: county tax records.
Cash-flow waterfall
monthlySold comps — $/sqft
last 12 mo · ≤1 miLoading sold comps…