1017 Summer Haven Ln · Schertz, TX
Flood risk 1/10 · Minimal
- FEMA flood zone
- X (unshaded)
- Chance of flooding over 30 yrs
- 0.0%
- Est. flood insurance / yr
- $507 – $1,088
Fire risk 5/10 · Moderate
- Est. fire insurance / yr
- $1,222 – $2,270
Heat risk 8/10 · Major
- Hot days now (above 108°F)
- 7 days/yr
- Hot days in 30 yrs
- 22 days/yr
Wind risk 8/10 · Major
- Chance of severe wind over 30 yrs
- 80.0%
Air-quality risk 2/10 · Minimal
- Unhealthy air days now
- 0 days/yr
- Unhealthy air days in 30 yrs
- 1 days/yr
Risk factors via First Street. Map © Google.
Why this score? — see what drove the D+ grade
The composite is a weighted blend of 9 inputs, each scored 0–100. Each bar is that input's sub-score; the figure is the points it added to the 100-point composite (weight × sub-score).
- ARV discount +15.0/15.0
- Cash flow +11.5/30.0
- 1% rule +5.0/10.0
- Schools +4.4/10.0
- Livability +3.7/5.0
- DSCR +3.4/10.0
- Condition / age +2.5/5.0
- Rent growth +1.8/5.0
- Appreciation +0.0/10.0
$200,000
🖨 Deal sheet 📄 Offer letter ✓ Due diligence
Listing remarks
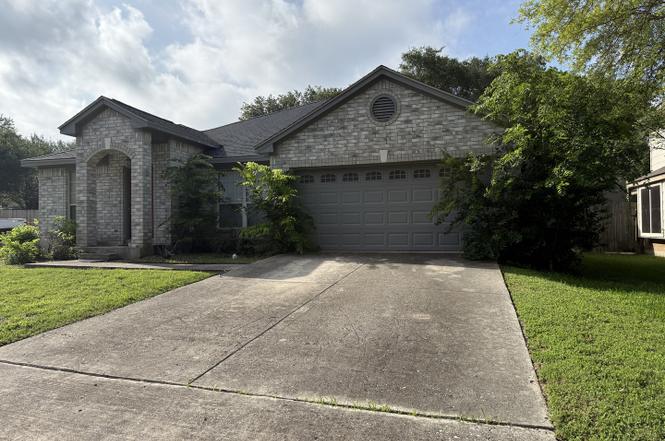
Welcome to this beautifully maintained 4-bedroom, 2-bathroom home perfectly situated on a prime corner lot. This property offers an exceptional blend of curb appeal, functional living space, and pride of ownership.
Key facts
- 7,840 sq ft lot
- 2 garage spots
- Built 1996
Property features AI
Finance
- HOA & community: Mandatory HOA; HOA fee $400 annually; Association transfer fee $45; Neighborhood amenities: Other (see remarks)
Exterior
- Parking: Attached 2-car garage
- Utilities: Water system available; Sewer system available
- Home design: Pre-owned property; Approximately 30 years old
- Construction: Slab foundation; Composition roof
- Exterior features: Brick and siding exterior; Lot in Dove Meadows subdivision
Interior
- Kitchen: Kitchen (10 x 10)
- Bedrooms: Master bedroom on lower level with full bath (15 x 14); Bedroom 2 (11 x 11); Bedroom 3 (11 x 11); Bedroom 4 (11 x 11)
- Flooring: Carpeting
- Bathrooms: Two full bathrooms; Master bathroom with tub/shower combination (10 x 8)
- Heating & cooling: Central heating (electric); Central air conditioning
- Interior features: One living area; Some window coverings remain
- Laundry & utility: Washer connection; Dryer connection
Neighborhood map
What this means for you Summary
Snapshot
- This is a 4-bed/2.0-bath single-family listed at $200k.
Deal economics
- At list price, monthly cash flow is $-66 ($-796/yr) — negative.
- To cash-flow at today's rent, offer at most $188k (5.9% below list).
- To meet the 1% rule (rent ≥ 1% of price), the offer needs to be $199k (0.4% below list).
- Recommended offer: $188k (5.9% below list) — sets the bar for cash-flow.
- Cap rate 5.9% vs local median 2.8% in Schertz — top-decile yield for the area; either an underpriced asset or a hidden risk that comps aren't pricing in. Stress-test before assuming the spread holds.
Location & tenants
- Location reads 73/100 on livability (#198 in TX) — a middle-class / working-renter tenant base. Strengths: employment A+, housing A+, crime A; Watch: health & safety D+, amenities F, commute F.
- Schertz-Cibolo-U City ISD (suburban): math 49% / reading 48% proficiency, ranked #152 of 826 in TX (top 18%) — families likely to look elsewhere, expect single-tenant / working-renter base with shorter leases.
- Zoned schools: Watts El (math 44% / reading 44%, grade F, #1,243 of 4,322 statewide, top 29%, 593 students, 44% FRL); Samuel Clemens H S (math 45% / reading 60%, grade C-, #444 of 1,632 statewide, top 27%, 2,544 students, 30% FRL).
- Market conditions: Rents soft (-2.9%/yr); 495 active listings in the ZIP; 29 comparable units currently listed for rent nearby; rentals at typical pace (median 24d on market — plan ~3-4 weeks tenant-placement turnaround); solid renter incomes; 2,064 units permitted in Guadalupe County in 2024 (133 in 5+ unit buildings).
Forward outlook
- Local home prices are declining (-3.0%/yr); year-one equity from $1k of loan paydown is wiped out by about $6k of value loss. Plan a longer hold.
- Guadalupe County population projected at +61% by 2050 — long-run rental-demand tailwind backs the buy-and-hold thesis.
Negotiation context
- Only 1 days on market — expect competitive offers; lowballing is unlikely to land.
Risks & watch-outs
- Watch-outs: property tax is 2.8% of price.
- Climate carrying-cost: severe wind risk, 80% chance of damaging wind over 30y; moderate wildfire risk; extreme-heat days projected 7→22/yr by 2055 (HVAC capex compounding) — expect insurance premiums to compound above CPI over the hold.
Questions for the listing agent
- What do current leases actually rent for vs. the listed asking? Can we see a recent rent roll and the last 12 months of T-12 income?
- Property tax is high relative to price — has the assessment been appealed recently, and will the sale trigger a re-assessment?
- What does the HOA fee cover, when was the last increase, and are there any pending special assessments or reserve-fund shortfalls?
- Is there a deadline driving the sale (1031 exchange, divorce, estate, relocation)? That informs how much negotiation room exists.
- The area grade is low — what's the realistic commute time and amenity access for the typical tenant pool here? Any planned neighborhood developments (good or bad) we should know about?
- What's the average days-on-market for RENTAL listings here right now (not sales)? A rising rental-DOM trend means longer vacancies and softer asking-rent achievability than the comps imply.
- What's the recent tenant-quality profile in this submarket — average credit score on applications, eviction rate, late-payment / NSF rate, and stable-employment percentage? A property-management company in the area should have these aggregated.
- How much new for-sale + rental construction is in the pipeline within 1–3 miles? Heavy new supply typically softens prices + rents 12–24 months out; constrained supply supports both.
Investment metrics
- 1% rule
- 1.00% ✗
- Cap rate
- 5.89%
- Cash-on-cash
- -1.42%
- DSCR
- 0.94
- GRM
- 8.4
CMA / ARV
- ARV (on-the-fly)
- $314,940
- Comps found
- 12
Show comp detail 12 sales within ~0.75 mi
| Address | Dist | Beds/Ba | Sqft | Sold | Price | $/sf | Match |
|---|---|---|---|---|---|---|---|
| 210 Rosegate Dr | 0.24mi | 4/2.5 | 2,340 (+8%) | 1mo | $299,500 | $128 | 73 |
| 1020 Grey Feather | 0.13mi | 4/2.0 | 1,918 (-12%) | 3mo | $199,900 | $104 | 72 |
| 342 Notch Leaf | 0.40mi | 3/2.5 (-1) | 2,138 (-2%) | 1mo | $290,000 | $136 | 71 |
| 100 Cloud Xing | 0.44mi | 3/2.0 (-1) | 2,062 (-5%) | 1mo | $320,000 | $155 | 65 |
| 237 Tapwood Ln | 0.27mi | 3/2.5 (-1) | 1,930 (-11%) | 3mo | $265,000 | $137 | 59 |
| 229 Notch Leaf | 0.22mi | 3/2.0 (-1) | 1,849 (-15%) | 2mo | $300,000 | $162 | 59 |
| 431 Woodstone | 0.16mi | 3/3.5 (-1) | 2,468 (+14%) | 3mo | $284,900 | $115 | 57 |
| 244 Turkey Tree | 0.57mi | 4/2.0 | 1,941 (-11%) | 2mo | $310,000 | $160 | 54 |
| 124 Henry Ford Dr | 0.32mi | 3/2.0 (-1) | 1,846 (-15%) | 4mo | $297,500 | $161 | 52 |
| 108 Blue Vis | 0.40mi | 3/2.0 (-1) | 1,882 (-13%) | 4mo | $279,900 | $149 | 51 |
| 113 Winter Frost | 0.57mi | 3/2.5 (-1) | 2,445 (+13%) | 0mo | $339,900 | $139 | 45 |
| 117 Kitty Hawk Run | 0.57mi | 3/2.0 (-1) | 1,867 (-14%) | 3mo | $269,900 | $145 | 42 |
Match score weights: distance 35% · size 25% · config 20% · recency 20%. Top-matched comps best support the ARV.
Projected returns pro-forma
-3.0% appreciation · 0.0% rent growth · sell at horizon
- IRR
- -22.6%
- Equity multiple
- 0.24×
- Total profit
- $-42,282
- Equity at exit
- $29,821
- IRR
- -30.2%
- Equity multiple
- -0.14×
- Total profit
- $-64,048
- Equity at exit
- $17,292
Cash invested: $56,000 (down + closing). Projections, not guarantees.
Landlord ↔ Tenant lean methodology
- Overall (STATE)
- 87 Strongly Landlord-Friendly
- State Texas
- 87 Strongly Landlord-Friendly · R+5
- County
- — inherits STATE
- City
- — inherits STATE
ZIP-level market 78154
- Home prices YoY
- -17.6%
- Rents YoY
- -2.9%
- Active inventory
- 495
- Price-to-rent
- 8.4×
Monthly cashflow live
- Estimated rent
- $1,991 high interval (Pro) →
- Mortgage (P&I)
- −$1,049
- Tax from tax record
- −$474 /mo · $5,693/yr
- Insurance
- −$83
- HOA
- −$33
- Vacancy / Maint / Mgmt
- −$418
- Net cashflow
- $-66
Break-even live
UW: 25.0% down · 7.5% · 30yr · 1.5% tax · 5.0% vac · 8.0% maint · 8.0% mgmt
Financing live
Cash to close
- Down payment
- $50,000
- Closing costs
- $6,000
- Reserves months
- —
- Total cash needed
- —
Loan-product check · same deal, 3 products live
Conventional
25% down · 7.5% · 30yr
- Down + closing
- —
- Monthly P&I
- —
- Monthly cashflow
- —
- DSCR
- —
- Eligible?
- —
Personal DTI + credit; lowest rate.
DSCR
20% down · 8.5% · 30yr
- Down + closing
- —
- Monthly P&I
- —
- Monthly cashflow
- —
- DSCR
- —
- Eligible?
- —
No personal income docs; deal must DSCR.
Hard money
10% down · 12.0% · 12mo
- Down + closing
- —
- Monthly P&I
- —
- Monthly cashflow
- —
- DSCR
- —
- Eligible?
- —
Short-term bridge; refi at stabilization.
Rent comps 29 comps
| Address | Beds | Baths | Sqft | Rent | $/sqft | DOM | Units | Dist |
|---|---|---|---|---|---|---|---|---|
| 314 Scotch Rose Ln Cibolo, TX | 3.0 | 2.0 | 1719 | $1,800 | $1.05 | 24d | 1 | 0.39mi |
| 229 Spice Oak Ln Cibolo, TX | 3.0 | 2.0 | 1882 | $1,950 | $1.04 | 13d | 1 | 0.43mi |
| 116 Lindy Hls Cibolo, TX | 4.0 | 2.5 | 2790 | $2,100 | $0.75 | 24d | 1 | 0.56mi |
| 237 Winter Frost Cibolo, TX | 4.0 | 2.5 | 2605 | $2,075 | $0.80 | 3d | 1 | 0.56mi |
| 133 Firebird Run Cibolo, TX | 3.0 | 2.5 | 2167 | $2,000 | $0.92 | 24d | 1 | 0.71mi |
| 1060 Richmond Dr Schertz, TX | 3.0 | 2.0 | 1774 | $1,550 | $0.87 | 4d | 1 | 0.79mi |
| 2413 Star Light Ln Schertz, TX | 3.0 | 2.0 | 1409 | $1,800 | $1.28 | 24d | 1 | 0.92mi |
| 146 Bentwood Ranch Dr Cibolo, TX | 4.0 | 3.5 | 2496 | $2,021 | $0.81 | 4d | 1 | 0.95mi |
| 153 Bentwood Ranch Dr Cibolo, TX | 3.0 | 2.0 | 1544 | $1,695 | $1.10 | 24d | 1 | 0.95mi |
| 509 Sea Headrig Dr Cibolo, TX | 4.0 | 3.0 | 2731 | $2,200 | $0.81 | 24d | 1 | 1.00mi |
| 2801 Hillview Ln Schertz, TX | 3.0 | 2.0 | 1491 | $1,745 | $1.17 | 24d | 1 | 1.07mi |
| 2713 Lockwood Ln Schertz, TX | 3.0 | 2.0 | 1430 | $1,595 | $1.12 | 2d | 1 | 1.07mi |
| 821 Dimrock Schertz, TX | 4.0 | 2.5 | 2509 | $2,000 | $0.80 | 15d | 1 | 1.07mi |
| 417 Turnberry Way Cibolo, TX | 3.0 | 2.0 | 2480 | $2,300 | $0.93 | 20d | 1 | 1.08mi |
| 2813 Kline Cir Schertz, TX | 4.0 | 2.5 | 2130 | $1,800 | $0.85 | 4d | 1 | 1.08mi |
| 1136 Berry Creek Dr Schertz, TX | 3.0 | 2.0 | 1723 | $2,000 | $1.16 | 2d | 1 | 1.09mi |
| 800 Brooks Ave Schertz, TX | 3.0 | 2.0 | 1745 | $1,550 | $0.89 | 24d | 1 | 1.12mi |
| 2805 Berry Way Schertz, TX | 3.0 | 2.0 | 1690 | $1,850 | $1.09 | 24d | 1 | 1.15mi |
| 721 Wooded Trl Schertz, TX | 4.0 | 2.5 | 2426 | $2,200 | $0.91 | 3d | 1 | 1.17mi |
| 226 Maidstone Cv Cibolo, TX | 4.0 | 2.5 | 2710 | $2,200 | $0.81 | 24d | 1 | 1.23mi |
| 2921 Candleberry Dr Schertz, TX | 3.0 | 2.0 | 1871 | $1,850 | $0.99 | 3d | 1 | 1.28mi |
| 137 Hidden Fawn Cibolo, TX | 3.0 | 2.5 | 2232 | $1,975 | $0.88 | 24d | 1 | 1.32mi |
| 555 Planters Pass Schertz, TX | 4.0 | 2.0 | 2056 | $2,000 | $0.97 | 24d | 1 | 1.36mi |
| 555 Planters Pass Schertz, TX | 4.0 | 2.0 | 2056 | $2,000 | $0.97 | 22d | 1 | 1.36mi |
| 1332 Wagon Wheel Schertz, TX | 4.0 | 2.5 | 2491 | $1,975 | $0.79 | 24d | 1 | 1.39mi |
| 2616 Tree Crown Unit N/A Schertz, TX | 4.0 | 3.0 | 2892 | $2,295 | $0.79 | 24d | 1 | 1.41mi |
| 1301 Red Barn Run Schertz, TX | 3.0 | 2.0 | 1736 | $2,100 | $1.21 | 24d | 1 | 1.46mi |
| 501 Ginsberg Dr Schertz, TX | 4.0 | 2.5 | 2500 | $2,095 | $0.84 | 2d | 1 | 1.47mi |
| 3313 Baldwin Park Schertz, TX | 3.0 | 2.0 | 1683 | $1,950 | $1.16 | 24d | 1 | 1.48mi |
HOA detail
- Monthly dues
- $33 · $396/yr
Listing history 2 events
-
2026-06-13remarks 214-char remark
-
2026-06-13$200,000 Pending 1 DOM
ⓘ Source: listings_history table (triggers on properties + properties_extension) + one-shot
backfill from property_details.listing_events for pre-trigger history.
Tax reassessment forecast TX · Resets to sale price
- Current annual tax
- $5,693 · $474/mo
- Projected year-2 tax
- $5,693 · $474/mo
- Expected delta
- $0/yr ($0/mo · 0.0%)
ⓘ Screening estimate from a state-policy table — verify with the county assessor before closing.
Climate risk First Street
- Flood 1/10 Low FEMA zone X (unshaded) · 0% chance over 30 yrs
- Wildfire 5/10 Major
- Heat 8/10 Severe 7 d/yr ≥108°F today · 22 d/yr by 30 yrs out
- Wind 8/10 Severe 80% chance of damaging wind over 30 yrs
- Air quality 2/10 Low 0 unhealthy d/yr today · 1 by 30 yrs out
Nearby sold comps map
Loading sold comps map…
Walkable amenities ~0.75 mi
Loading nearby amenities…
Taxation est. · year 1
- Rental income
- $23,897
- − Mortgage interest
- −$11,203
- − Property taxes
- −$5,693
- − Insurance
- −$1,000
- − Repairs & maintenance
- −$1,912
- − Management
- −$1,912
- − HOA
- −$396
- − Depreciation
- −$5,818
- Taxable loss
- −$4,037
- Est. tax savings @ 24.0%
- +$969
- After-tax cash flow
- $173/yr
For passive investors: Depreciation is non-cash, so a rental often shows a tax loss while cash-flowing — sheltering income. Rental losses are passive: they offset passive income freely, and up to $25,000/yr can offset ordinary (W-2) income if you actively participate and your MAGI is under $100k (phasing out to $0 by $150k); unused losses carry forward. On sale, claimed depreciation is recaptured at up to 25%, and gains may owe capital-gains tax (a 1031 exchange can defer both). Figures are a year-1 estimate at your 24.0% rate — not tax advice; consult a CPA.
Schools (NCES district)
- District
- Schertz-Cibolo-U City ISD
- NCES district ID
- 4839480
- Math proficiency
- 49% ▼ -12.00%
- Reading proficiency
- 48% ▼ -4.00%
- Median HH income
- $75,790
- Composite
- 44.02/100
- National rank
- #2886
- State rank
- #152 of 826 in TX
Livability — Schertz
- Score
- 73/100
- State rank
- #198
- US rank
- #5013
Category grades
Schools grade is shown separately in the Schools card above.
Census & demographics
- Census place
- Schertz, TX
- County
- Guadalupe County · 147,291 people
- City population
- 41,907
- Metro
- San Antonio-New Braunfels, TX
- Population (ZIP)
- 41,907
- Household income
- $100,572
- Rent vs Own
- Severe rent burden
- 776.0
Population outlook (Guadalupe County) Hauer SSP2
- Today (2025)
- 196,854 people
- By 2030
- 220,210 · +11.9%
- By 2040
- 268,004 · +36.1%
- By 2050
- 316,333 · +60.7%
- By 2075
- 434,747 · +120.8%
- By 2100
- 520,447 · +164.4%
Race, ethnicity, and origin ACS 2023
- Neighborhood character
- Diverse neighborhood (Simpson 0.66)
- Race & ethnicity
- White 46% Hispanic / Latino 32% Two or more races 19% Black 15% Asian 2%
- Hispanic origin (detail)
- Mexican 26%
- Common ancestry
- Italian 3% Romanian 3% Lithuanian 2%
- Foreign-born
- 6% · Canada
- Languages at home
- 82% English-only · Spanish 16% German/W. Germanic 1% Other Indo-European 1%
Political lean MEDSL · Guadalupe
- 2024 margin
- Strong R (+29.5) · D 34.8% · R 64.3%
- 2008→2024 swing
- +1.5pp toward D · 2008: -31.0pp · 2024: -29.5pp
- All cycles
- 2024: R+29.5 2020: R+24.2 2016: R+31.8 2012: R+35.1 2008: R+31.0
Not yet ingested
- Civics
- —
Market trends
- HPI YoY
- ▼ -47.53%
- Current HPI
- 222.8314
- Rent YoY
- ▼ -2.86%
- Metro
- San Antonio-New Braunfels, TX
- State GDP YoY
- ▲ 3.95%
- F500 in state
- 110
Industry mix (Fortune 500 HQ in TX)
| Industry | F500 HQs | Revenue |
|---|---|---|
| Energy | 16 | $1,198B |
|
||
| Technology | 5 | $198B |
|
||
| Engineering / Construction | 4 | $72B |
|
||
| Energy Services | 3 | $60B |
|
||
| Utilities | 3 | $41B |
|
||
| Healthcare | 2 | $330B |
|
||
Price history
3 events — show timeline
- 2026-06-11 Pending — LERA
- 2026-06-03 Listed $200,000 LERA
- 1997-02-21 Sold (Public Records) — Public Records
Property tax history
+1.8%/yrLatest (2026): $5,693 · -8.5% YoY. Source: county tax records.
Cash-flow waterfall
monthlySold comps — $/sqft
last 12 mo · ≤1 miLoading sold comps…