19995 Star Rd · Siloam Springs, AR
Flood risk 1/10 · Minimal
- FEMA flood zone
- X (unshaded)
- Chance of flooding over 30 yrs
- 0.0%
- Est. flood insurance / yr
- $507 – $1,088
Fire risk 6/10 · Moderate
- Est. fire insurance / yr
- $1,499 – $2,785
Heat risk 5/10 · Moderate
- Hot days now (above 105°F)
- 7 days/yr
- Hot days in 30 yrs
- 19 days/yr
Wind risk 2/10 · Minimal
- Chance of severe wind over 30 yrs
- 3.0%
Air-quality risk 2/10 · Minimal
- Unhealthy air days now
- 1 days/yr
- Unhealthy air days in 30 yrs
- 2 days/yr
Risk factors via First Street. Map © Google.
Why this score? — see what drove the D grade
The composite is a weighted blend of 9 inputs, each scored 0–100. Each bar is that input's sub-score; the figure is the points it added to the 100-point composite (weight × sub-score).
- Cash flow +14.9/30.0
- ARV discount +7.5/15.0
- DSCR +4.6/10.0
- Livability +3.7/5.0
- Schools +3.6/10.0
- 1% rule +3.1/10.0
- Rent growth +2.5/5.0
- Condition / age +2.5/5.0
- Appreciation +0.0/10.0
$148,000
🖨 Deal sheet (PDF) 📄 Offer letter ✓ Due diligence
Listing remarks
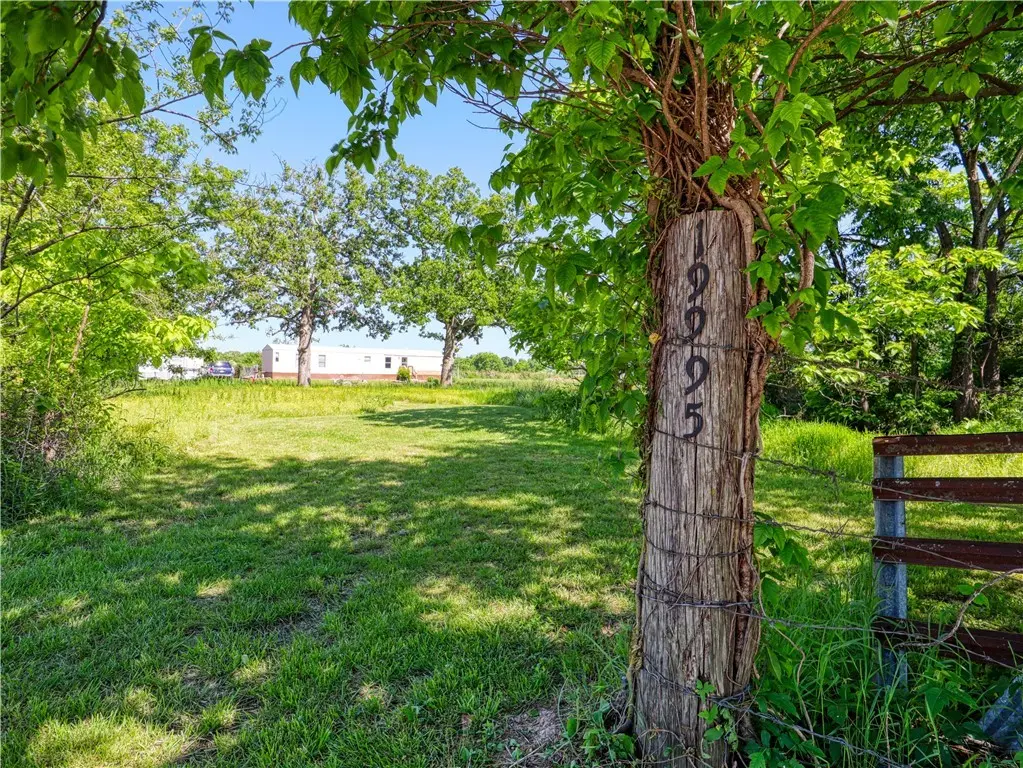
Looking for an affordable full-time residence or a comfortable place to live while you build your dream home on the same land? This property checks all the boxes. Nestled on 1.65 beautiful acres, this move-in-ready 2-bed 2-bath home offers the perfect blend of comfort, space, and opportunity. 20x10 storage shed and fenced back yard. With mostly flat terrain and a wonderful mix of mature trees and open land, the property feels like a private retreat while staying just 10 mins from downtown Siloam Springs.
Key facts
- Open land
- 20x10 storage shed
- Fenced back yard
Tags
Property features AI
Finance
- HOA & community: Monthly association fee
Exterior
- Parking: Gravel driveway
- Security: Smoke detector(s)
- Utilities: Propane; Well water; Septic (septic tank); Water available; Septic available
- Home design: Single-story; Aluminum siding
- Construction: Metal roof; Aluminum siding; Crawlspace/skim foundation; Built 25+ years ago
- Exterior features: Covered patio; Patio; Gravel driveway; Storage structure; Wire fencing; Cleared lot; Private road access; Residential zoning
Interior
- Kitchen: Gas range; Propane oven; Refrigerator
- Flooring: Carpet; Laminate; Simulated wood
- Bathrooms: 2 full bathrooms
- Heating & cooling: Propane heating; Electric cooling
- Interior features: Ceiling fan(s); Pantry; Walk-in closet(s); Window treatments; Blinds; Single-pane windows
- Laundry & utility: Washer hookup; Dryer hookup; Washer; Dryer; Gas water heater
Neighborhood map
What this means for you Summary
Snapshot
- This is a 2-bed/2.0-bath manufactured listed at $148k.
Deal economics
- At list price, monthly cash flow is $44 ($531/yr) — positive.
- The deal already cash-flows at list — no discount required.
- To meet the 1% rule (rent ≥ 1% of price), the offer needs to be $120k (19.0% below list).
- Recommended offer: $120k (19.0% below list) — sets the bar for 1% rule.
- Cap rate 6.7% vs local median 3.8% in Siloam Springs — top-decile yield for the area; either an underpriced asset or a hidden risk that comps aren't pricing in. Stress-test before assuming the spread holds.
Location & tenants
- Location reads 74/100 on livability (#17 in AR, #4,621 nationally) — a middle-class / working-renter tenant base. Strengths: cost of living A+, housing A+, health & safety A+; Watch: crime D, amenities F, commute F.
- Siloam Springs School District (town): math 44% / reading 40% proficiency, ranked #53 of 238 in AR (top 22%) — families likely to look elsewhere, expect single-tenant / working-renter base with shorter leases.
- Zoned schools: Delbert Pete & Pat Allen Ele (667 students, 62% FRL); Siloam Springs Intermediate School (math 44% / reading 42%, grade D-, #70 of 201 statewide, top 38%, 700 students, 59% FRL); Siloam Springs High School Conversion Charter (math 33% / reading 37%, grade F, #90 of 292 statewide, top 31%, 1,402 students, 49% FRL, charter).
- Market conditions: 371 active listings in the ZIP; solid renter incomes; 4,359 units permitted in Benton County in 2024 (402 in 5+ unit buildings).
Forward outlook
- Local home prices are declining (-3.0%/yr); year-one equity from $1k of loan paydown is wiped out by about $4k of value loss. Plan a longer hold.
- Benton County population projected at +56% by 2050 — long-run rental-demand tailwind backs the buy-and-hold thesis.
Negotiation context
- Only 4 days on market — expect competitive offers; lowballing is unlikely to land.
- Current owner paid $28k; list at $148k implies a 429% gain — meaningful room to come down on a strong offer.
Risks & watch-outs
- Climate carrying-cost: major wildfire risk; extreme-heat days projected 7→19/yr by 2055 (HVAC capex compounding) — expect insurance premiums to compound above CPI over the hold.
Questions for the listing agent
- Is there a deadline driving the sale (1031 exchange, divorce, estate, relocation)? That informs how much negotiation room exists.
- Schools are D-rated, which usually means shorter tenancies and higher turnover. Who's the typical renter profile here, and what's been the actual vacancy rate?
- Crime grade is D in this area — have there been break-ins, vandalism, or insurance claims at this property in the last 3 years? What carrier currently insures it and at what premium?
- The area grade is low — what's the realistic commute time and amenity access for the typical tenant pool here? Any planned neighborhood developments (good or bad) we should know about?
- What's the average days-on-market for RENTAL listings here right now (not sales)? A rising rental-DOM trend means longer vacancies and softer asking-rent achievability than the comps imply.
- What's the recent tenant-quality profile in this submarket — average credit score on applications, eviction rate, late-payment / NSF rate, and stable-employment percentage? A property-management company in the area should have these aggregated.
- How much new for-sale + rental construction is in the pipeline within 1–3 miles? Heavy new supply typically softens prices + rents 12–24 months out; constrained supply supports both.
Investment metrics
- 1% rule
- 0.81% ✗
- Cap rate
- 6.65%
- Cash-on-cash
- 1.28%
- DSCR
- 1.06
- GRM
- 10.3
CMA / ARV
No comps found within radius.
Projected returns pro-forma
-3.0% appreciation · 3.0% rent growth · sell at horizon
- IRR
- -14.3%
- Equity multiple
- 0.49×
- Total profit
- $-21,220
- Equity at exit
- $22,067
- IRR
- -5.6%
- Equity multiple
- 0.64×
- Total profit
- $-15,076
- Equity at exit
- $12,796
Cash invested: $41,440 (down + closing). Projections, not guarantees.
Landlord ↔ Tenant lean methodology
- Overall (STATE)
- 92 Strongly Landlord-Friendly
- State Arkansas
- 92 Strongly Landlord-Friendly · R+14
- County
- — inherits STATE
- City
- — inherits STATE
ZIP-level market 72761
- Home prices YoY
- -13.6%
- Active inventory
- 371
- Price-to-rent
- 10.3×
Monthly cashflow live
- Estimated rent
- $1,199 medium interval (Pro) →
- Mortgage (P&I)
- −$776
- Tax from tax record
- −$65 /mo · $779/yr
- Insurance
- −$62
- HOA
- −$0
- Vacancy / Maint / Mgmt
- −$252
- Net cashflow
- $44
Break-even live
Sensitivity live
| Price | -10% $128 | -5% $86 | +0% $44 | +5% $2 | +10% $-40 |
|---|---|---|---|---|---|
| Rent | -10% $-50 | -5% $-3 | +0% $44 | +5% $92 | +10% $139 |
| Rate | -1.0pp $119 | -0.5pp $82 | base $44 | +0.5pp $6 | +1.0pp $-33 |
UW: 25.0% down · 7.5% · 30yr · 1.5% tax · 5.0% vac · 8.0% maint · 8.0% mgmt
Financing live
Cash to close
- Down payment
- $37,000
- Closing costs
- $4,440
- Reserves months
- —
- Total cash needed
- —
Loan-product check · same deal, 3 products live
Conventional
25% down · 7.5% · 30yr
- Down + closing
- —
- Monthly P&I
- —
- Monthly cashflow
- —
- DSCR
- —
- Eligible?
- —
Personal DTI + credit; lowest rate.
DSCR
20% down · 8.5% · 30yr
- Down + closing
- —
- Monthly P&I
- —
- Monthly cashflow
- —
- DSCR
- —
- Eligible?
- —
No personal income docs; deal must DSCR.
Hard money
10% down · 12.0% · 12mo
- Down + closing
- —
- Monthly P&I
- —
- Monthly cashflow
- —
- DSCR
- —
- Eligible?
- —
Short-term bridge; refi at stabilization.
Listing history 3 events
-
2026-05-15status Pending
-
2026-05-11$148,000 Active
-
1989-05-26soldstatus $28,000
ⓘ Source: listings_history table (triggers on properties + properties_extension) + one-shot
backfill from property_details.listing_events for pre-trigger history.
Tax reassessment forecast AR · Resets to sale price
- Current annual tax
- $779 · $65/mo
- Projected year-2 tax
- $947 · $79/mo
- Expected delta
- +$168/yr (+$14/mo · 21.6%)
ⓘ Screening estimate from a state-policy table — verify with the county assessor before closing.
Climate risk First Street
- Flood 1/10 Low FEMA zone X (unshaded) · 0% chance over 30 yrs
- Wildfire 6/10 Major
- Heat 5/10 Major 7 d/yr ≥105°F today · 19 d/yr by 30 yrs out
- Wind 2/10 Low 3% chance of damaging wind over 30 yrs
- Air quality 2/10 Low 1 unhealthy d/yr today · 2 by 30 yrs out
Nearby sold comps map
Loading sold comps map…
Walkable amenities ~0.75 mi
Loading nearby amenities…
Taxation est. · year 1
- Rental income
- $14,384
- − Mortgage interest
- −$8,290
- − Property taxes
- −$779
- − Insurance
- −$740
- − Repairs & maintenance
- −$1,151
- − Management
- −$1,151
- − Depreciation
- −$4,305
- Taxable loss
- −$2,032
- Est. tax savings @ 24.0%
- +$488
- After-tax cash flow
- $1,019/yr
For passive investors: Depreciation is non-cash, so a rental often shows a tax loss while cash-flowing — sheltering income. Rental losses are passive: they offset passive income freely, and up to $25,000/yr can offset ordinary (W-2) income if you actively participate and your MAGI is under $100k (phasing out to $0 by $150k); unused losses carry forward. On sale, claimed depreciation is recaptured at up to 25%, and gains may owe capital-gains tax (a 1031 exchange can defer both). Figures are a year-1 estimate at your 24.0% rate — not tax advice; consult a CPA.
Schools (NCES district)
- District
- Siloam Springs School District
- NCES district ID
- 0512450
- Math proficiency
- 44% ▼ -7.00%
- Reading proficiency
- 40% ▼ -2.00%
- Median HH income
- $46,222
- Composite
- 35.81/100
- National rank
- #4828
- State rank
- #53 of 238 in AR
Livability — Siloam Springs
- Score
- 74/100
- State rank
- #17
- US rank
- #4621
Category grades
Schools grade is shown separately in the Schools card above.
Census & demographics
- County
- Benton County · 259,241 people
- City population
- 24,745
- Metro
- Fayetteville-Springdale-Rogers, AR
- Population (ZIP)
- 24,745
- Household income
- $76,122
- Rent vs Own
- Severe rent burden
- 176.0
Population outlook (Benton County) Hauer SSP2
- Today (2025)
- 318,683 people
- By 2030
- 353,481 · +10.9%
- By 2040
- 425,280 · +33.4%
- By 2050
- 497,239 · +56.0%
- By 2075
- 662,114 · +107.8%
- By 2100
- 776,431 · +143.6%
Race, ethnicity, and origin ACS 2023
- Neighborhood character
- Diverse neighborhood (Simpson 0.63)
- Race & ethnicity
- White 58% Two or more races 24% Hispanic / Latino 19% Native American 4% Asian 3%
- Hispanic origin (detail)
- Mexican 8% Puerto Rican 2%
- Common ancestry
- Italian 2% Slovak 1% Serbian 1%
- Foreign-born
- 11% · Canada
- Languages at home
- 85% English-only · Spanish 13% Other Indo-European 1%
Political lean MEDSL · Benton
- 2024 margin
- Strong R (+27.0) · D 35.2% · R 62.1% · Other 2.7%
- 2008→2024 swing
- +9.6pp toward D · 2008: -36.5pp · 2024: -27.0pp
- All cycles
- 2024: R+27.0 2020: R+26.4 2016: R+34.9 2012: R+40.4 2008: R+36.5
Not yet ingested
- Civics
- —
Market trends
- HPI YoY
- ▼ -45.93%
- Current HPI
- 291.1062
- Rent YoY
- —
- Metro
- Fayetteville-Springdale-Rogers, AR
- State GDP YoY
- ▲ 3.80%
- F500 in state
- 10
Industry mix (Fortune 500 HQ in AR)
| Industry | F500 HQs | Revenue |
|---|---|---|
| Retail | 1 | $681B |
|
||
| Food / Agriculture | 1 | $53B |
|
||
| Retail / Energy | 1 | $22B |
|
||
| Transportation / Logistics | 1 | $12B |
|
||
| Energy | 1 | $4B |
|
||
Price history
+428.6% since first listed3 events — show timeline
- 2026-05-15 Pending — NWARMLS
- 2026-05-11 Listed $148,000 NWARMLS
- 1989-05-26 Sold (Public Records) $28,000 Public Records
Property tax history
+5.0%/yrLatest (2018): $779 · +0.7% YoY. Source: county tax records.
Cash-flow waterfall
monthlySold comps — $/sqft
last 12 mo · ≤1 miLoading sold comps…