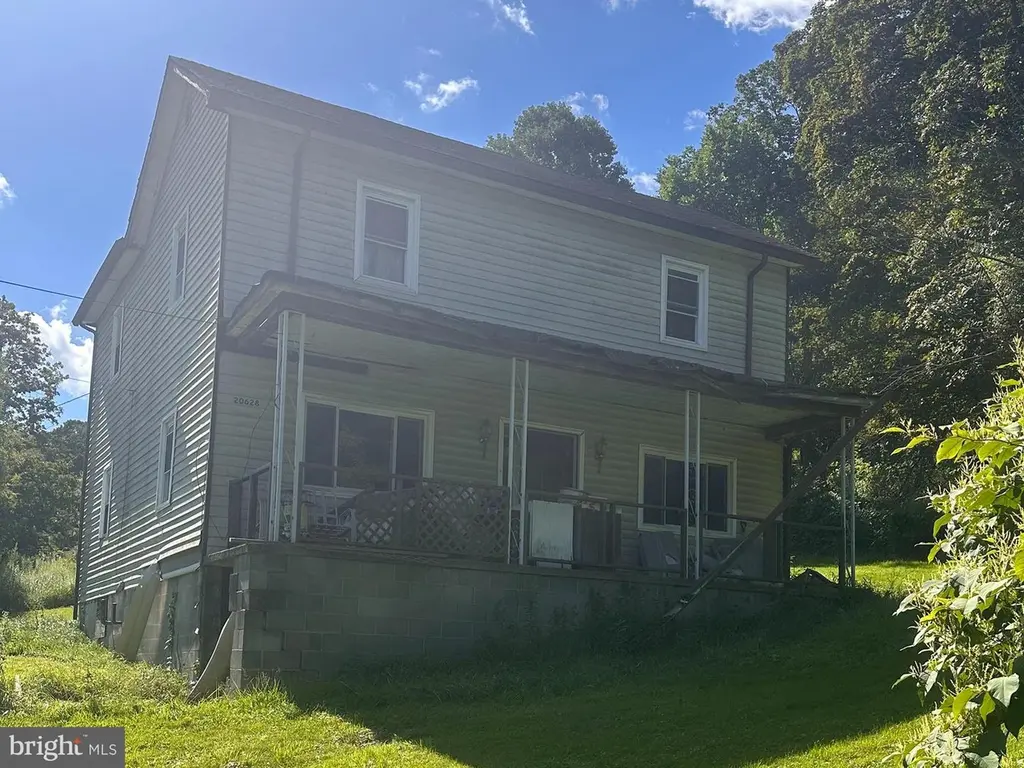
20628 Water Station Run Rd SW · Lonaconing, MD
Flood risk 1/10 · Minimal
- FEMA flood zone
- X (unshaded)
- Chance of flooding over 30 yrs
- 0.0%
- Est. flood insurance / yr
- $473 – $860
Fire risk 3/10 · Minor
- Est. fire insurance / yr
- $755 – $1,403
Heat risk 2/10 · Minimal
- Hot days now (above 93°F)
- 7 days/yr
- Hot days in 30 yrs
- 18 days/yr
Wind risk 2/10 · Minimal
- Chance of severe wind over 30 yrs
- —
Air-quality risk 2/10 · Minimal
- Unhealthy air days now
- 0 days/yr
- Unhealthy air days in 30 yrs
- 1 days/yr
Risk factors via First Street. Map © Google.
Why this score? — see what drove the C- grade
The composite is a weighted blend of 9 inputs, each scored 0–100. Each bar is that input's sub-score; the figure is the points it added to the 100-point composite (weight × sub-score).
- Cash flow +15.0/30.0
- ARV discount +15.0/15.0
- 1% rule +5.0/10.0
- DSCR +5.0/10.0
- Appreciation +4.1/10.0
- Livability +3.2/5.0
- Rent growth +2.5/5.0
- Condition / age +2.5/5.0
- Schools +1.9/10.0
$25,000
🖨 Deal sheet 📄 Offer letter ✓ Due diligence
Listing remarks
ONLINE AUCTION: This auction takes place on the Ashland Auction Group Website Bidding Platform Bidding begins 5/4/2026 @ 10:00 AM. Bidding ends 5/6/2026 @ 12:40 PM. List Price is Suggested Opening Bid. Deposit: $5,000. 2 Story Detached Home located in Allegany County. Located on a generous approximately 2 1/2 Acre Lot Easy access to major traffic artery E Main St. Property is vacant.
Key facts
- 2.49 acre lot
- Built 1920
- Listed 27 days
Tags
Neighborhood map
What this means for you Summary
Snapshot
- This is a 3-bed/1.0-bath single-family listed at $25k.
Deal economics
- At list price, monthly cash flow is $733 ($9k/yr) — positive.
- The deal already cash-flows at list — no discount required.
- Meets the 1% rule at list price ($1k rent vs $25k).
- Recommended offer: $25k (1.5% below list) — sets the bar for market timing.
Location & tenants
- Location reads 64/100 on livability (#287 in MD) — a middle-class / working-renter tenant base. Strengths: cost of living A+, housing A, crime B; Watch: schools D+, amenities F, commute F.
- Allegany County Public Schools (other): math 15% / reading 30% proficiency, ranked #18 of 24 in MD (top 75%) — low school quality limits family demand, transient renter base, plan for 1-2y turnover.
- Market conditions: 9 active listings in the ZIP; 24 units permitted in Allegany County in 2024 (0 in 5+ unit buildings).
Forward outlook
- Local home prices are declining (-1.9%/yr); year-one equity from $173 of loan paydown is wiped out by about $463 of value loss. Plan a longer hold.
- Allegany County population projected at -14% by 2050 — secular population decline; favor cash flow + early exit over multi-decade hold.
- At projected returns (-1.9% appreciation + 3.0% rent growth), your $7k cash investment doubles in ~1 year — after that, you're playing with house money.
Negotiation context
- It's been on market 27 days — a 2% lower offer ($25k) is reasonable based on typical stale-listing flexibility.
- 2 sale attempts with the ask held roughly flat each time — persistent listings suggest the price (not the market) is what's stuck; bring a comps-based counter.
Risks & watch-outs
- Watch-outs: property tax is 4.4% of price; built in 1920 — expect roof / HVAC / electrical / plumbing capex.
Questions for the listing agent
- Built in 1920 — when were the roof, HVAC, electrical panel, plumbing, and water heater last replaced?
- Property tax is high relative to price — has the assessment been appealed recently, and will the sale trigger a re-assessment?
- Is there a deadline driving the sale (1031 exchange, divorce, estate, relocation)? That informs how much negotiation room exists.
- Schools are D-rated, which usually means shorter tenancies and higher turnover. Who's the typical renter profile here, and what's been the actual vacancy rate?
- What's the average days-on-market for RENTAL listings here right now (not sales)? A rising rental-DOM trend means longer vacancies and softer asking-rent achievability than the comps imply.
- What's the recent tenant-quality profile in this submarket — average credit score on applications, eviction rate, late-payment / NSF rate, and stable-employment percentage? A property-management company in the area should have these aggregated.
- How much new for-sale + rental construction is in the pipeline within 1–3 miles? Heavy new supply typically softens prices + rents 12–24 months out; constrained supply supports both.
Investment metrics
- 1% rule
- 4.89% ✓
- Cap rate
- 41.46%
- Cash-on-cash
- 125.58%
- DSCR
- 6.59
- GRM
- 1.7
CMA / ARV
- ARV (on-the-fly)
- $47,676
- Comps found
- 3
Show comp detail 3 sales within ~0.75 mi
| Address | Dist | Beds/Ba | Sqft | Sold | Price | $/sf | Match |
|---|---|---|---|---|---|---|---|
| 20628 Water Station Run Rd SW | 0.00mi | 3/1.0 | 1,644 (0%) | 1mo | $48,000 | $29 | 99 |
| 21108 Willow Tree Ln SW | 0.69mi | 3/1.5 | 1,470 (-11%) | 1mo | $205,000 | $139 | 47 |
| 7 High St | 0.75mi | 3/2.0 | 1,630 (-1%) | 19mo | $35,000 | $21 | 44 |
Match score weights: distance 35% · size 25% · config 20% · recency 20%. Top-matched comps best support the ARV.
Projected returns pro-forma
-1.85% appreciation · 3.0% rent growth · sell at horizon
- IRR
- —
- Equity multiple
- 7.27×
- Total profit
- $43,886
- Equity at exit
- $5,030
- IRR
- —
- Equity multiple
- 15.23×
- Total profit
- $99,618
- Equity at exit
- $4,467
Cash invested: $7,000 (down + closing). Projections, not guarantees.
Landlord ↔ Tenant lean methodology
- Overall (STATE)
- 27 Tenant-Leaning
- State Maryland
- 27 Tenant-Leaning · D+14
- County
- — inherits STATE
- City
- — inherits STATE
ZIP-level market 21539
- Home prices YoY
- -1.0%
- Active inventory
- 9
- Price-to-rent
- 1.7×
Monthly cashflow live
- Estimated rent
- $1,222 medium interval (Pro) →
- Mortgage (P&I)
- −$131
- Tax from tax record
- −$91 /mo · $1,091/yr
- Insurance
- −$10
- HOA
- −$0
- Vacancy / Maint / Mgmt
- −$257
- Net cashflow
- $733
Break-even live
UW: 25.0% down · 7.5% · 30yr · 1.5% tax · 5.0% vac · 8.0% maint · 8.0% mgmt
Financing live
Cash to close
- Down payment
- $6,250
- Closing costs
- $750
- Reserves months
- —
- Total cash needed
- —
Loan-product check · same deal, 3 products live
Conventional
25% down · 7.5% · 30yr
- Down + closing
- —
- Monthly P&I
- —
- Monthly cashflow
- —
- DSCR
- —
- Eligible?
- —
Personal DTI + credit; lowest rate.
DSCR
20% down · 8.5% · 30yr
- Down + closing
- —
- Monthly P&I
- —
- Monthly cashflow
- —
- DSCR
- —
- Eligible?
- —
No personal income docs; deal must DSCR.
Hard money
10% down · 12.0% · 12mo
- Down + closing
- —
- Monthly P&I
- —
- Monthly cashflow
- —
- DSCR
- —
- Eligible?
- —
Short-term bridge; refi at stabilization.
Listing history 5 events
-
2026-04-20status Pending
-
2026-03-24$25,000 Active
-
2026-02-17historical
-
2025-10-19price $75,000
-
2025-08-31$100,000 Active
ⓘ Source: listings_history table (triggers on properties + properties_extension) + one-shot
backfill from property_details.listing_events for pre-trigger history.
Tax reassessment forecast MD · Partial reset (capped growth)
- Current annual tax
- $1,091 · $91/mo
- Projected year-2 tax
- $1,091 · $91/mo
- Expected delta
- $0/yr ($0/mo · 0.0%)
ⓘ Screening estimate from a state-policy table — verify with the county assessor before closing.
Climate risk First Street
- Flood 1/10 Low FEMA zone X (unshaded) · 0% chance over 30 yrs
- Wildfire 3/10 Moderate
- Heat 2/10 Low 7 d/yr ≥93°F today · 18 d/yr by 30 yrs out
- Wind 2/10 Low
- Air quality 2/10 Low 0 unhealthy d/yr today · 1 by 30 yrs out
Nearby sold comps map
Loading sold comps map…
Walkable amenities ~0.75 mi
Loading nearby amenities…
Taxation est. · year 1
- Rental income
- $14,659
- − Mortgage interest
- −$1,400
- − Property taxes
- −$1,091
- − Insurance
- −$125
- − Repairs & maintenance
- −$1,173
- − Management
- −$1,173
- − Depreciation
- −$727
- Taxable income
- $8,969
- Est. tax owed @ 24.0%
- −$2,153
- After-tax cash flow
- $6,638/yr
For passive investors: Depreciation is non-cash, so a rental often shows a tax loss while cash-flowing — sheltering income. Rental losses are passive: they offset passive income freely, and up to $25,000/yr can offset ordinary (W-2) income if you actively participate and your MAGI is under $100k (phasing out to $0 by $150k); unused losses carry forward. On sale, claimed depreciation is recaptured at up to 25%, and gains may owe capital-gains tax (a 1031 exchange can defer both). Figures are a year-1 estimate at your 24.0% rate — not tax advice; consult a CPA.
Schools (NCES district)
- District
- Allegany County Public Schools
- NCES district ID
- 2400030
- Math proficiency
- 15% ▼ -26.00%
- Reading proficiency
- 30% ▼ -20.00%
- Median HH income
- $39,760
- Composite
- 18.95/100
- National rank
- #8854
- State rank
- #18 of 24 in MD
Livability — Lonaconing
- Score
- 64/100
- State rank
- #287
- US rank
- #14826
Category grades
Schools grade is shown separately in the Schools card above.
Census & demographics
- Population (ZIP)
- 1,846
Population outlook (Allegany County) Hauer SSP2
- Today (2025)
- 68,778 people
- By 2030
- 66,766 · -2.9%
- By 2040
- 62,784 · -8.7%
- By 2050
- 59,179 · -14.0%
- By 2075
- 50,732 · -26.2%
- By 2100
- 40,837 · -40.6%
Race, ethnicity, and origin ACS 2023
- Neighborhood character
- Predominantly White (94%)
- Race & ethnicity
- White 94% Two or more races 3% Hispanic / Latino 3% Asian 1%
- Common ancestry
- Slovak 6% Romanian 3% Greek 1%
- Foreign-born
- 2% · South Korea, China
- Languages at home
- 97% English-only · Arabic 1% Korean 1% Chinese 1%
Political lean MEDSL · Allegany
- 2024 margin
- Solid R (+40.3) · D 28.9% · R 69.2% · Other 2.0%
- 2008→2024 swing
- -14.4pp toward R · 2008: -25.9pp · 2024: -40.3pp
- All cycles
- 2024: R+40.3 2020: R+38.3 2016: R+48.0 2012: R+32.9 2008: R+25.9
Not yet ingested
- Civics
- —
Market trends
- HPI YoY
- ▼ -1.85%
- Current HPI
- 188.3299
- Rent YoY
- —
- Metro
- —
- State GDP YoY
- ▲ 2.97%
- F500 in state
- 12
Industry mix (Fortune 500 HQ in MD)
| Industry | F500 HQs | Revenue |
|---|---|---|
| Aerospace / Defense | 1 | $71B |
|
||
| Utilities | 1 | $25B |
|
||
| Hotels | 1 | $24B |
|
||
| Consumer Goods | 1 | $7B |
|
||
| Real Estate | 1 | $6B |
|
||
| Chemicals | 1 | $2B |
|
||
Price history
-75.0% since first listed5 events — show timeline
- 2026-04-20 Pending — BRIGHT MLS
- 2026-03-24 Listed $25,000 BRIGHT MLS
- 2026-02-17 Listing Removed — BRIGHT MLS
- 2025-10-19 Price Changed $75,000 BRIGHT MLS
- 2025-08-31 Listed $100,000 BRIGHT MLS
Property tax history
+4.0%/yrLatest (2025): $1,091 · +12.3% YoY. Source: county tax records.
Cash-flow waterfall
monthlySold comps — $/sqft
last 12 mo · ≤1 miLoading sold comps…