 Fourplex
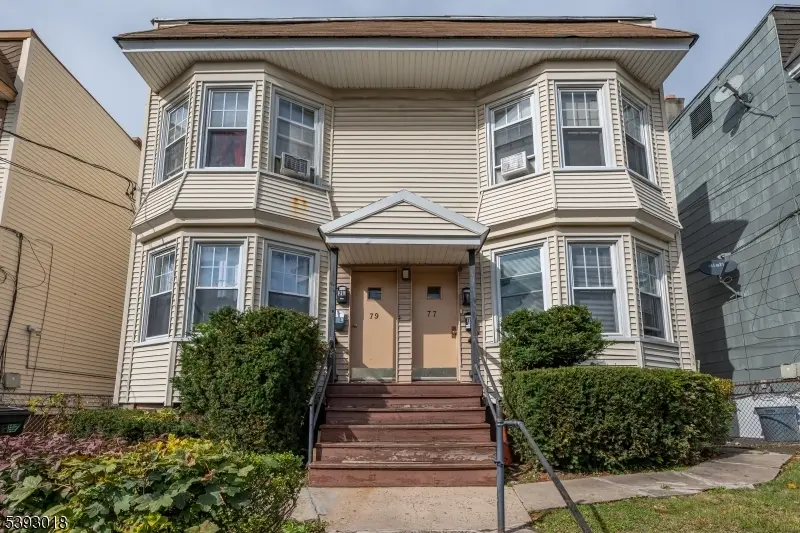
77-79 Harrison Ave · Llewellyn Park, NJ
Flood risk 1/10 · Minimal
- FEMA flood zone
- X (unshaded)
- Chance of flooding over 30 yrs
- 0.0%
- Est. flood insurance / yr
- $507 – $1,088
Fire risk 1/10 · Minimal
- Est. fire insurance / yr
- $526 – $976
Heat risk 6/10 · Moderate
- Hot days now (above 100°F)
- 7 days/yr
- Hot days in 30 yrs
- 14 days/yr
Wind risk 6/10 · Moderate
- Chance of severe wind over 30 yrs
- 27.0%
Air-quality risk 4/10 · Minor
- Unhealthy air days now
- 3 days/yr
- Unhealthy air days in 30 yrs
- 5 days/yr
Risk factors via First Street. Map © Google.
Why this score? — see what drove the B grade
The composite is a weighted blend of 9 inputs, each scored 0–100. Each bar is that input's sub-score; the figure is the points it added to the 100-point composite (weight × sub-score).
- Cash flow +29.0/30.0
- DSCR +10.0/10.0
- 1% rule +8.1/10.0
- ARV discount +7.5/15.0
- Appreciation +5.0/10.0
- Schools +3.5/10.0
- Rent growth +2.5/5.0
- Livability +2.5/5.0
- Condition / age +2.2/5.0
$799,000
🖨 Deal sheet (PDF) 📄 Offer letter ✓ Due diligence
Multi-family units
County records classify this as Multi-Family (2-4 Unit). Listing-text estimate: 4 units. confirmed
Listing remarks
Welcome to this expansive fourplex in the heart of West Orange, an ideal opportunity for both investors and owner occupants! This side-by-side layout offers four total units: two 2-bedroom units and two 3-bedroom units, each with functional layouts, great natural light, and some recent updates. Making it move-in/rent-ready with upside to increase value and income. Potential rental income of $10,000/month! Transit-friendly location with a NYC bound bus stop right outside your door, and just minutes from the Morris & Essex line, offering Midtown Direct train service to NYC. West Orange also offers free jitney service to nearby train stations. Conveniently located near shopping, dining,
Key facts
- Nyc bound bus stop
- Near shopping
- Free jitney service
Tags
Neighborhood map
What this means for you Summary
Snapshot
- This is a 4 × 2-bed/1.0-bath units multifamily listed at $799k. Condition is rated fair.
Deal economics
- At list price, monthly cash flow is $3k ($33k/yr) — positive. Per door: $681/mo.
- The deal already cash-flows at list — no discount required.
- Meets the 1% rule at list price ($10k rent vs $799k).
- Recommended offer: $787k (1.5% below list) — sets the bar for market timing.
- Cap rate 10.4% vs local median 2.7% in Llewellyn Park — top-decile yield for the area; either an underpriced asset or a hidden risk that comps aren't pricing in. Stress-test before assuming the spread holds.
Location & tenants
- Location reads: area grade B — affects rentability + tenant quality, not the cash-flow math above.
- West Orange Public Schools (suburban): math 23% / reading 50% proficiency, ranked #230 of 472 in NJ (top 49%) — families likely to look elsewhere, expect single-tenant / working-renter base with shorter leases.
- Market conditions: 1 active listings in the ZIP; 3,364 units permitted in Essex County in 2024 (2,551 in 5+ unit buildings).
Forward outlook
- In year one you build about $29k of equity ($6k loan paydown + $24k appreciation (3.0% local appreciation)).
- Essex County population projected at +3% by 2050 — modest demand growth; plan on rents tracking national, not racing it.
- At projected returns (3.0% appreciation + 3.0% rent growth), your $224k cash investment doubles in ~4 years — after that, you're playing with house money.
- By year 2, paydown + projected appreciation supports a ~$48k cash-out refi (75% LTV) — recoverable capital for the next deal without selling this one.
Negotiation context
- It's been on market 15 days — a 2% lower offer ($787k) is reasonable based on typical stale-listing flexibility.
- 2 sale attempts with the ask held roughly flat each time — persistent listings suggest the price (not the market) is what's stuck; bring a comps-based counter.
Risks & watch-outs
- Watch-outs: built in 1918 — expect roof / HVAC / electrical / plumbing capex.
- Climate carrying-cost: major wind risk, 27% chance of damaging wind over 30y; extreme-heat days projected 7→14/yr by 2055 (HVAC capex compounding) — expect insurance premiums to compound above CPI over the hold.
Questions for the listing agent
- Can we see the unit-by-unit rent roll, current vacancy, and any below-market leases? What's the average tenancy length?
- What capital expenditures (roof, boiler, parking lot, exteriors) have been made in the last 5 years, and what's planned in the next 2?
- Have any recent inspections been done? Can we get a copy of the seller's disclosures and any deferred-maintenance estimates?
- Built in 1918 — when were the roof, HVAC, electrical panel, plumbing, and water heater last replaced?
- Is there a deadline driving the sale (1031 exchange, divorce, estate, relocation)? That informs how much negotiation room exists.
- What's the average days-on-market for RENTAL listings here right now (not sales)? A rising rental-DOM trend means longer vacancies and softer asking-rent achievability than the comps imply.
- What's the recent tenant-quality profile in this submarket — average credit score on applications, eviction rate, late-payment / NSF rate, and stable-employment percentage? A property-management company in the area should have these aggregated.
- How much new apartment / multifamily construction is in the pipeline within 1–3 miles? Heavy new supply (>2% of stock underway) typically softens rents 12–24 months out; light construction supports rent growth.
Investment metrics
- 1% rule
- 1.31% ✓
- Cap rate
- 10.39%
- Cash-on-cash
- 14.62%
- DSCR
- 1.65
- GRM
- 6.4
CMA / ARV
No comps found within radius.
Show comp detail 3 sales within ~0.75 mi
| Address | Dist | Beds/Ba | Sqft | Sold | Price | $/sf | Match |
|---|---|---|---|---|---|---|---|
| 67 Harrison Ave | 0.02mi | 9/4.0 (+1) | — | 8mo | $865,000 | — | 75 |
| 67 Cedar Ave | 0.52mi | 8/4.0 | — | 12mo | $999,999 | — | 53 |
| 23 Watson Ave | 0.32mi | 7/3.0 (-1) | — | 16mo | $645,000 | — | 50 |
Match score weights: distance 35% · size 25% · config 20% · recency 20%. Top-matched comps best support the ARV.
Projected returns pro-forma
3.0% appreciation · 3.0% rent growth · sell at horizon
- IRR
- 21.2%
- Equity multiple
- 2.21×
- Total profit
- $269,972
- Equity at exit
- $359,265
- IRR
- 22.3%
- Equity multiple
- 4.21×
- Total profit
- $718,173
- Equity at exit
- $553,670
Cash invested: $223,720 (down + closing). Projections, not guarantees.
Landlord ↔ Tenant lean methodology
- Overall (STATE)
- 21 Tenant-Leaning
- State New Jersey
- 21 Tenant-Leaning · D+6
- County
- — inherits STATE
- City
- — inherits STATE
ZIP-level market 07052-5913
- Active inventory
- 1
- Price-to-rent
- 25.5×
Monthly cashflow live
- Estimated rent
- $10,439 high interval (Pro) →
- Mortgage (P&I)
- −$4,190
- Tax est. 1.5%
- −$999 /mo · $11,985/yr
- Insurance
- −$333
- HOA
- −$0
- Vacancy / Maint / Mgmt
- −$2,192
- Net cashflow
- $2,725
Break-even live
Sensitivity live
| Price | -10% $3,277 | -5% $3,001 | +0% $2,725 | +5% $2,449 | +10% $2,173 |
|---|---|---|---|---|---|
| Rent | -10% $1,900 | -5% $2,313 | +0% $2,725 | +5% $3,137 | +10% $3,550 |
| Rate | -1.0pp $3,127 | -0.5pp $2,928 | base $2,725 | +0.5pp $2,518 | +1.0pp $2,307 |
4-unit breakdown (identical units grouped — click to expand)
| Units | Beds | Baths | Est. rent |
|---|---|---|---|
| 4× units | 2 | 1 | $10,440 |
| #1 | 2 | 1 | $2,610 |
| #2 | 2 | 1 | $2,610 |
| #3 | 2 | 1 | $2,610 |
| #4 | 2 | 1 | $2,610 |
| Total (4 units) | $10,439 | ||
UW: 25.0% down · 7.5% · 30yr · 1.5% tax · 5.0% vac · 8.0% maint · 8.0% mgmt
Financing live
Cash to close
- Down payment
- $199,750
- Closing costs
- $23,970
- Reserves months
- —
- Total cash needed
- —
Loan-product check · same deal, 3 products live
Conventional
25% down · 7.5% · 30yr
- Down + closing
- —
- Monthly P&I
- —
- Monthly cashflow
- —
- DSCR
- —
- Eligible?
- —
Personal DTI + credit; lowest rate.
DSCR
20% down · 8.5% · 30yr
- Down + closing
- —
- Monthly P&I
- —
- Monthly cashflow
- —
- DSCR
- —
- Eligible?
- —
No personal income docs; deal must DSCR.
Hard money
10% down · 12.0% · 12mo
- Down + closing
- —
- Monthly P&I
- —
- Monthly cashflow
- —
- DSCR
- —
- Eligible?
- —
Short-term bridge; refi at stabilization.
Listing history 5 events
-
2026-04-09status Under Contract
-
2026-03-25$799,000 Active
-
2025-11-17historical Active Under Contract
-
2025-11-03status Pending
-
2025-10-28$789,000 Active
ⓘ Source: listings_history table (triggers on properties + properties_extension) + one-shot
backfill from property_details.listing_events for pre-trigger history.
Climate risk First Street
- Flood 1/10 Low FEMA zone X (unshaded) · 0% chance over 30 yrs
- Wildfire 1/10 Low
- Heat 6/10 Major 7 d/yr ≥100°F today · 14 d/yr by 30 yrs out
- Wind 6/10 Major 27% chance of damaging wind over 30 yrs
- Air quality 4/10 Moderate 3 unhealthy d/yr today · 5 by 30 yrs out
Nearby sold comps map
Loading sold comps map…
Walkable amenities ~0.75 mi
Loading nearby amenities…
Taxation est. · year 1
- Rental income
- $125,268
- − Mortgage interest
- −$44,756
- − Property taxes
- −$11,985
- − Insurance
- −$3,995
- − Repairs & maintenance
- −$10,021
- − Management
- −$10,021
- − Depreciation
- −$23,244
- Taxable income
- $21,245
- Est. tax owed @ 24.0%
- −$5,099
- After-tax cash flow
- $27,602/yr
For passive investors: Depreciation is non-cash, so a rental often shows a tax loss while cash-flowing — sheltering income. Rental losses are passive: they offset passive income freely, and up to $25,000/yr can offset ordinary (W-2) income if you actively participate and your MAGI is under $100k (phasing out to $0 by $150k); unused losses carry forward. On sale, claimed depreciation is recaptured at up to 25%, and gains may owe capital-gains tax (a 1031 exchange can defer both). Figures are a year-1 estimate at your 24.0% rate — not tax advice; consult a CPA.
Condition & rehab AI · 14 photos
This fourplex in West Orange requires moderate repairs and updates to its exterior, interior, and kitchen and bathroom fixtures. Upgrading the exterior and interior will significantly increase its resale and rental value.
Repairs flagged
- Major exterior siding — The exterior siding is weathered and stained, indicating significant damage that needs to be addressed.
- Major flooring — The flooring in the living room and kitchen is old and worn, requiring replacement.
- Moderate kitchen cabinets — The kitchen cabinets are in fair condition but could benefit from updates or replacement.
- Moderate bathroom fixtures — The bathroom fixtures appear outdated and may need replacement or updating.
Value-add opportunities
- Both exterior siding and paint — Updating the exterior siding and paint will improve the home's curb appeal and increase its resale and rental value.
- Both kitchen and bathroom updates — Updating the kitchen and bathroom fixtures will improve the home's functionality and increase its resale and rental value.
Renovation cost estimate screening
| Repair item | Severity | Est. cost |
|---|---|---|
| exterior siding · The exterior siding is weathered and stained, indicating significant damage that needs to be addressed. | Major | $15,000–50,000 |
| flooring · The flooring in the living room and kitchen is old and worn, requiring replacement. | Major | $15,000–50,000 |
| kitchen cabinets · The kitchen cabinets are in fair condition but could benefit from updates or replacement. | Moderate | $3,000–15,000 |
| bathroom fixtures · The bathroom fixtures appear outdated and may need replacement or updating. | Moderate | $3,000–15,000 |
| Total estimated repair cost · 4 items | $36,000–130,000 |
Value-add ROI direction
- Both exterior siding and paint — Updating the exterior siding and paint will improve the home's curb appeal and increase its resale and rental value. ↑
- Both kitchen and bathroom updates — Updating the kitchen and bathroom fixtures will improve the home's functionality and increase its resale and rental value. ↑
ⓘ Cost ranges are severity-bucket heuristics (US national rule-of-thumb). Get contractor quotes + a written scope before underwriting a rehab budget.
Schools (NCES district)
- District
- West Orange Public Schools
- NCES district ID
- 3417610
- Math proficiency
- 23% ▼ -20.00%
- Reading proficiency
- 50% ▼ -9.00%
- Median HH income
- $89,678
- Composite
- 35.28/100
- National rank
- #4971
- State rank
- #230 of 472 in NJ
Livability — Llewellyn Park
No livability data for this city. (Only ~50 U.S. cities are tracked.)
Census & demographics
No demographic data for this ZIP.
Market trends
- HPI YoY
- —
- Current HPI
- —
- Rent YoY
- —
- Metro
- —
- State GDP YoY
- ▲ 2.05%
- F500 in state
- 34
Industry mix (Fortune 500 HQ in NJ)
| Industry | F500 HQs | Revenue |
|---|---|---|
| Consumer Goods | 3 | $31B |
|
||
| Pharmaceuticals | 2 | $153B |
|
||
| Technology | 2 | $21B |
|
||
| Insurance | 2 | $20B |
|
||
| Healthcare | 2 | $19B |
|
||
| Financial Services | 1 | $70B |
|
||
Price history
+1.3% since first listed5 events — show timeline
- 2026-04-09 Pending — GSMLS
- 2026-03-25 Listed $799,000 GSMLS
- 2025-11-17 Contingent — NJMLS
- 2025-11-03 Pending — NJMLS
- 2025-10-28 Listed $789,000 NJMLS
Cash-flow waterfall
monthlySold comps — $/sqft
last 12 mo · ≤1 miLoading sold comps…