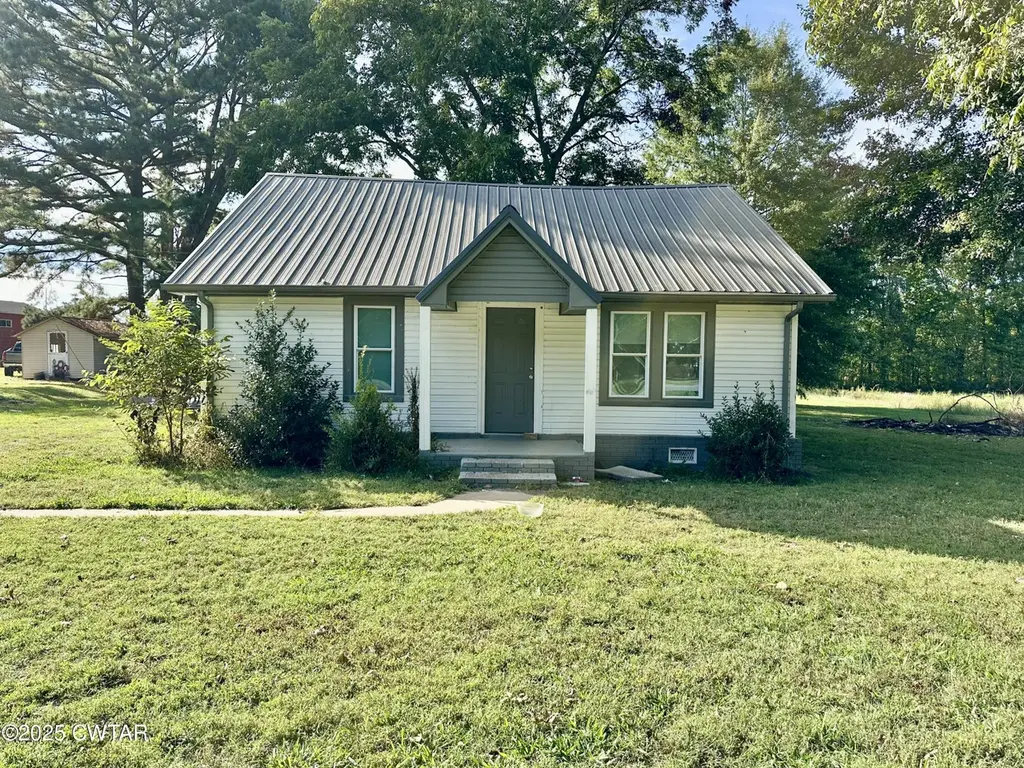
901 S Trenton St · Rutherford, TN
Flood risk 4/10 · Minor
- FEMA flood zone
- X (unshaded)
- Chance of flooding over 30 yrs
- 0.22%
- Est. flood insurance / yr
- $507 – $1,088
Fire risk 2/10 · Minimal
- Est. fire insurance / yr
- $949 – $1,763
Heat risk 6/10 · Moderate
- Hot days now (above 108°F)
- 7 days/yr
- Hot days in 30 yrs
- 20 days/yr
Wind risk 4/10 · Minor
- Chance of severe wind over 30 yrs
- 10.0%
Air-quality risk 1/10 · Minimal
- Unhealthy air days now
- 0 days/yr
- Unhealthy air days in 30 yrs
- 0 days/yr
Risk factors via First Street. Map © Google.
Why this score? — see what drove the D grade
The composite is a weighted blend of 9 inputs, each scored 0–100. Each bar is that input's sub-score; the figure is the points it added to the 100-point composite (weight × sub-score).
- Cash flow +13.1/30.0
- ARV discount +7.5/15.0
- Appreciation +4.7/10.0
- DSCR +3.9/10.0
- Schools +3.7/10.0
- Livability +3.1/5.0
- Rent growth +2.5/5.0
- Condition / age +2.5/5.0
- 1% rule +2.4/10.0
$129,000
🖨 Deal sheet (PDF) 📄 Offer letter ✓ Due diligence
Listing remarks MLS
New remodel! Very nice 2 BR 1 Ba home located in Rutherford. This house has new floors, recessed lighting, appliances, and much more including a brand new HVAC! You have got to see this! Call today to be able to see this great house. It won't be around very long!
Key facts
- Big backyard
- Conveniently located
- 0.45 acre lot
Tags
Property features AI
Finance
- Other: Public maintained road access; Lot dimensions approximately 85 x 230
Exterior
- Parking: Three parking spaces
- Utilities: Public water; Public sewer
- Home design: Single-family residence; One story
- Construction: Vinyl siding; Metal roof
- Exterior features: Rain gutters
Interior
- Kitchen: Electric range; Microwave; Refrigerator
- Bedrooms: Two main-level bedrooms
- Flooring: Vinyl
- Bathrooms: One full bathroom on the main level
- Heating & cooling: Ceiling fan cooling (has cooling)
- Interior features: Ceiling fans; Eat-in kitchen
- Laundry & utility: Washer and dryer hookups; Electric dryer hookup; Electric water heater
Neighborhood map
What this means for you Summary
Snapshot
- This is a 2-bed/1.0-bath single-family listed at $129k.
Deal economics
- At list price, monthly cash flow is $-5 ($-63/yr) — negative.
- To cash-flow at today's rent, offer at most $128k (0.7% below list).
- To meet the 1% rule (rent ≥ 1% of price), the offer needs to be $95k (26.3% below list).
- Recommended offer: $95k (26.3% below list) — sets the bar for 1% rule.
Location & tenants
- Location reads 62/100 on livability (#235 in TN) — a middle-class / working-renter tenant base. Strengths: cost of living A+, housing A-; Watch: health & safety C-, amenities F, commute F.
- Gibson County Sp District (rural): math 47% / reading 39% proficiency, ranked #11 of 139 in TN (top 8%) — families likely to look elsewhere, expect single-tenant / working-renter base with shorter leases.
- Zoned schools: Rutherford Elementary (math 42% / reading 37%, grade F, #231 of 952 statewide, top 26%, 282 students, 0% FRL); South Gibson County Middle School (math 58% / reading 42%, grade C, #20 of 333 statewide, top 6%, 800 students, 0% FRL); Gibson County High School (math 27% / reading 37%, grade F, #56 of 332 statewide, top 20%, 449 students, 0% FRL) — zoned schools average 0% FRL vs 33% district-wide (33 pts lower); this property's tenant base skews higher-income than the district average.
- Market conditions: 22 active listings in the ZIP; 155 units permitted in Gibson County in 2024 (0 in 5+ unit buildings).
Forward outlook
- In year one you build about $217 of equity ($892 loan paydown + $-675 appreciation (-0.5% local appreciation)).
- Gibson County population projected to shrink 8% by 2050 — rents likely to lag national; underwrite the cash flow, not the appreciation.
Negotiation context
- It's been on market 39 days — a 3% lower offer ($125k) is reasonable based on typical stale-listing flexibility.
- 2 sale attempts since 2y ago with the ask held roughly flat each time — persistent listings suggest the price (not the market) is what's stuck; bring a comps-based counter.
Risks & watch-outs
- Watch-outs: built in 1944 — expect roof / HVAC / electrical / plumbing capex.
- Climate carrying-cost: extreme-heat days projected 7→20/yr by 2055 (HVAC capex compounding) — expect insurance premiums to compound above CPI over the hold.
Questions for the listing agent
- What do current leases actually rent for vs. the listed asking? Can we see a recent rent roll and the last 12 months of T-12 income?
- It's been on market 39 days. Have you received any prior offers? Is the seller open to a 26% concession, seller financing, or rate buy-down credit?
- Built in 1944 — when were the roof, HVAC, electrical panel, plumbing, and water heater last replaced?
- Is there a deadline driving the sale (1031 exchange, divorce, estate, relocation)? That informs how much negotiation room exists.
- Schools are D-rated, which usually means shorter tenancies and higher turnover. Who's the typical renter profile here, and what's been the actual vacancy rate?
- The area grade is low — what's the realistic commute time and amenity access for the typical tenant pool here? Any planned neighborhood developments (good or bad) we should know about?
- What's the average days-on-market for RENTAL listings here right now (not sales)? A rising rental-DOM trend means longer vacancies and softer asking-rent achievability than the comps imply.
- What's the recent tenant-quality profile in this submarket — average credit score on applications, eviction rate, late-payment / NSF rate, and stable-employment percentage? A property-management company in the area should have these aggregated.
- How much new for-sale + rental construction is in the pipeline within 1–3 miles? Heavy new supply typically softens prices + rents 12–24 months out; constrained supply supports both.
Investment metrics
- 1% rule
- 0.74% ✗
- Cap rate
- 6.24%
- Cash-on-cash
- -0.17%
- DSCR
- 0.99
- GRM
- 11.3
CMA / ARV
No comps found within radius.
Projected returns pro-forma
-0.52% appreciation · 3.0% rent growth · sell at horizon
- IRR
- -4.5%
- Equity multiple
- 0.80×
- Total profit
- $-7,316
- Equity at exit
- $34,116
- IRR
- 1.8%
- Equity multiple
- 1.18×
- Total profit
- $6,380
- Equity at exit
- $38,430
Cash invested: $36,120 (down + closing). Projections, not guarantees.
Landlord ↔ Tenant lean methodology
- Overall (STATE)
- 87 Strongly Landlord-Friendly
- State Tennessee
- 87 Strongly Landlord-Friendly · R+13
- County
- — inherits STATE
- City
- — inherits STATE
ZIP-level market 38369
- Home prices YoY
- -0.2%
- Active inventory
- 22
- Price-to-rent
- 11.3×
Monthly cashflow live
- Estimated rent
- $950 medium interval (Pro) →
- Mortgage (P&I)
- −$676
- Tax from tax record
- −$26 /mo · $307/yr
- Insurance
- −$54
- HOA
- −$0
- Vacancy / Maint / Mgmt
- −$200
- Net cashflow
- $-5
Break-even live
Sensitivity live
| Price | -10% $68 | -5% $31 | +0% $-5 | +5% $-42 | +10% $-78 |
|---|---|---|---|---|---|
| Rent | -10% $-80 | -5% $-43 | +0% $-5 | +5% $32 | +10% $70 |
| Rate | -1.0pp $60 | -0.5pp $28 | base $-5 | +0.5pp $-39 | +1.0pp $-73 |
UW: 25.0% down · 7.5% · 30yr · 1.5% tax · 5.0% vac · 8.0% maint · 8.0% mgmt
Financing live
Cash to close
- Down payment
- $32,250
- Closing costs
- $3,870
- Reserves months
- —
- Total cash needed
- —
Loan-product check · same deal, 3 products live
Conventional
25% down · 7.5% · 30yr
- Down + closing
- —
- Monthly P&I
- —
- Monthly cashflow
- —
- DSCR
- —
- Eligible?
- —
Personal DTI + credit; lowest rate.
DSCR
20% down · 8.5% · 30yr
- Down + closing
- —
- Monthly P&I
- —
- Monthly cashflow
- —
- DSCR
- —
- Eligible?
- —
No personal income docs; deal must DSCR.
Hard money
10% down · 12.0% · 12mo
- Down + closing
- —
- Monthly P&I
- —
- Monthly cashflow
- —
- DSCR
- —
- Eligible?
- —
Short-term bridge; refi at stabilization.
Listing history 22 events
-
2026-06-21days on market $129,000 Active 39 DOM
-
2026-06-21days on market $129,000 Active 38 DOM
-
2026-06-18days on market $129,000 Active 36 DOM
-
2026-06-17days on market $129,000 Active 35 DOM
-
2026-06-16days on market $129,000 Active 34 DOM
-
2026-06-15days on market $129,000 Active 33 DOM
-
2026-06-13days on market $129,000 Active 31 DOM
-
2026-06-12days on market $129,000 Active 30 DOM
-
2026-06-09days on market $129,000 Active 27 DOM
-
2026-06-08days on market $129,000 Active 26 DOM
-
2026-06-08days on market $129,000 Active 25 DOM
-
2026-06-07days on market $129,000 Active 24 DOM
-
2026-06-03days on market $129,000 Active 21 DOM
-
2026-06-02days on market $129,000 Active 20 DOM
-
2026-06-01days on market $129,000 Active 19 DOM
-
2026-05-31days on market $129,000 Active 18 DOM
-
2026-05-13$129,000 Active
-
2024-04-17soldstatus $123,000
-
2024-04-15soldstatus $123,000 Closed 263-char remark
Show marketing remark (263 chars)
New remodel! Very nice 2 BR 1 Ba home located in Rutherford. This house has new floors, recessed lighting, appliances, and much more including a brand new HVAC! You have got to see this! Call today to be able to see this great house. It won't be around very long!
-
2024-03-19status Pending 263-char remark
Show marketing remark (263 chars)
New remodel! Very nice 2 BR 1 Ba home located in Rutherford. This house has new floors, recessed lighting, appliances, and much more including a brand new HVAC! You have got to see this! Call today to be able to see this great house. It won't be around very long!
-
2024-03-16historical Active Under Contract 263-char remark
Show marketing remark (263 chars)
New remodel! Very nice 2 BR 1 Ba home located in Rutherford. This house has new floors, recessed lighting, appliances, and much more including a brand new HVAC! You have got to see this! Call today to be able to see this great house. It won't be around very long!
-
2024-02-19$120,000 Active 263-char remark
Show marketing remark (263 chars)
New remodel! Very nice 2 BR 1 Ba home located in Rutherford. This house has new floors, recessed lighting, appliances, and much more including a brand new HVAC! You have got to see this! Call today to be able to see this great house. It won't be around very long!
ⓘ Source: listings_history table (triggers on properties + properties_extension) + one-shot
backfill from property_details.listing_events for pre-trigger history.
Tax reassessment forecast TN · Resets to sale price
- Current annual tax
- $307 · $26/mo
- Projected year-2 tax
- $916 · $76/mo
- Expected delta
- +$609/yr (+$51/mo · 198.3%)
ⓘ Screening estimate from a state-policy table — verify with the county assessor before closing.
Climate risk First Street
- Flood 4/10 Moderate FEMA zone X (unshaded) · 22% chance over 30 yrs
- Wildfire 2/10 Low
- Heat 6/10 Major 7 d/yr ≥108°F today · 20 d/yr by 30 yrs out
- Wind 4/10 Moderate 10% chance of damaging wind over 30 yrs
- Air quality 1/10 Low 0 unhealthy d/yr today · 0 by 30 yrs out
Nearby sold comps map
Loading sold comps map…
Walkable amenities ~0.75 mi
Loading nearby amenities…
Taxation est. · year 1
- Rental income
- $11,402
- − Mortgage interest
- −$7,226
- − Property taxes
- −$307
- − Insurance
- −$645
- − Repairs & maintenance
- −$912
- − Management
- −$912
- − Depreciation
- −$3,753
- Taxable loss
- −$2,353
- Est. tax savings @ 24.0%
- +$565
- After-tax cash flow
- $502/yr
For passive investors: Depreciation is non-cash, so a rental often shows a tax loss while cash-flowing — sheltering income. Rental losses are passive: they offset passive income freely, and up to $25,000/yr can offset ordinary (W-2) income if you actively participate and your MAGI is under $100k (phasing out to $0 by $150k); unused losses carry forward. On sale, claimed depreciation is recaptured at up to 25%, and gains may owe capital-gains tax (a 1031 exchange can defer both). Figures are a year-1 estimate at your 24.0% rate — not tax advice; consult a CPA.
Schools (NCES district)
- District
- Gibson County Sp District
- NCES district ID
- 4701400
- Math proficiency
- 47% ▼ -13.00%
- Reading proficiency
- 39% ▼ -5.00%
- Median HH income
- $47,868
- Composite
- 36.82/100
- National rank
- #4565
- State rank
- #11 of 139 in TN
Livability — Rutherford
- Score
- 62/100
- State rank
- #235
- US rank
- #17256
Category grades
Schools grade is shown separately in the Schools card above.
Census & demographics
- Census place
- Rutherford, TN
- Population (ZIP)
- 1,636
Population outlook (Gibson County) Hauer SSP2
- Today (2025)
- 48,793 people
- By 2030
- 48,221 · -1.2%
- By 2040
- 46,793 · -4.1%
- By 2050
- 44,909 · -8.0%
- By 2075
- 40,191 · -17.6%
- By 2100
- 33,574 · -31.2%
Race, ethnicity, and origin ACS 2023
- Neighborhood character
- Predominantly White (81%)
- Race & ethnicity
- White 81% Two or more races 10% Black 7% Native American 1% Hispanic / Latino 1%
- Common ancestry
- Lithuanian 2% Slovak 1% Serbian 1%
- Foreign-born
- 1% · Canada
- Languages at home
- 95% English-only · Spanish 3% German/W. Germanic 1%
Political lean MEDSL · Gibson
- 2024 margin
- Solid R (+52.0) · D 23.6% · R 75.5%
- 2008→2024 swing
- -23.2pp toward R · 2008: -28.8pp · 2024: -52.0pp
- All cycles
- 2024: R+52.0 2020: R+47.0 2016: R+43.8 2012: R+32.1 2008: R+28.8
Not yet ingested
- Civics
- —
Market trends
- HPI YoY
- ▼ -0.52%
- Current HPI
- 230.3868
- Rent YoY
- —
- Metro
- —
- State GDP YoY
- ▲ 2.78%
- F500 in state
- 22
Industry mix (Fortune 500 HQ in TN)
| Industry | F500 HQs | Revenue |
|---|---|---|
| Healthcare | 3 | $91B |
|
||
| Retail | 3 | $72B |
|
||
| Transportation / Logistics | 1 | $88B |
|
||
| Paper / Packaging | 1 | $19B |
|
||
| Insurance | 1 | $13B |
|
||
| Energy | 1 | $12B |
|
||
Price history
+7.5% since first listed6 events — show timeline
- 2026-05-13 Listed $129,000 CWTAR
- 2024-04-17 Sold (Public Records) $123,000 Public Records
- 2024-04-15 Sold (MLS) $123,000 RRAR as distributed by MLS GRID
- 2024-03-19 Pending — RRAR as distributed by MLS GRID
- 2024-03-16 Contingent — RRAR as distributed by MLS GRID
- 2024-02-19 Listed $120,000 RRAR as distributed by MLS GRID
Property tax history
-2.9%/yrLatest (2025): $307 · +5.9% YoY. Source: county tax records.
Cash-flow waterfall
monthlySold comps — $/sqft
last 12 mo · ≤1 miLoading sold comps…