 🏗️ New Construction
11226 N Lakeview Dr · Harold, FL
Flood risk No data
- FEMA flood zone
- —
- Chance of flooding over 30 yrs
- —
- Est. flood insurance / yr
- —
Fire risk No data
- Est. fire insurance / yr
- —
Heat risk No data
- Hot days now (above threshold)
- —
- Hot days in 30 yrs
- —
Wind risk No data
- Chance of severe wind over 30 yrs
- —
Air-quality risk No data
- Unhealthy air days now
- —
- Unhealthy air days in 30 yrs
- —
Risk factors via First Street. Map © Google.
Why this score? — see what drove the F grade
The composite is a weighted blend of 9 inputs, each scored 0–100. Each bar is that input's sub-score; the figure is the points it added to the 100-point composite (weight × sub-score).
- ARV discount +7.5/15.0
- Cash flow +7.1/30.0
- Schools +5.3/10.0
- Livability +4.1/5.0
- Condition / age +4.0/5.0
- Rent growth +3.6/5.0
- 1% rule +1.9/10.0
- DSCR +1.3/10.0
- Appreciation +0.0/10.0
$250,000
🖨 Deal sheet 📄 Offer letter ✓ Due diligence
Listing remarks MLS
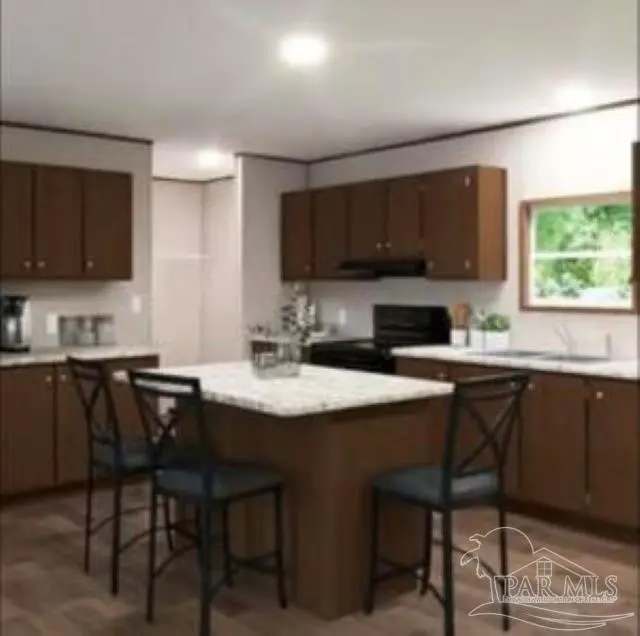
If you've been dreaming of your own little piece of heaven, this brand-new 2026 manufactured home is it!!! Offering 4 bedrooms, 2 bathrooms, and 1,971 square feet, this home sits on approximately an acre in a beautiful wooded setting with a cleared homesite. Inside, you'll love the open layout with two living areas and a kitchen with island that flows into the main spaces. The split bedroom design offers a private primary suite, while the additional bedrooms are on the opposite side of home. Enjoy that down-home country feel while being just a short drive to the beach and close to Pensacola, Eglin, Duke Field, and Whiting Field. Pics are taken from the manufacturers advertisement video of home. Home in to be delivered early May.
Key facts
- Cleared homesite
- Split bedroom design
- Open layout
Tags
Property features AI
Finance
- HOA & community: No association
Exterior
- Parking: Open parking; Driveway providing front entrance access
- Utilities: Circuit breaker electrical service; Septic tank; Cable available; Paved, publicly maintained road access
- Home design: Modular property; New construction; One story; Off-grade foundation
- Construction: Frame construction; Composition roof; Built as new construction
- Exterior features: Lake view; Interior lot
Interior
- Kitchen: Updated kitchen with an island; Dishwasher; Refrigerator; ENERGY STAR qualified appliances
- Bedrooms: Primary bedroom on the first floor (approx. 12.7' x 16.8'); Additional bedrooms on the first floor (approx. 10.4' x 12.7')
- Flooring: Vinyl flooring
- Bathrooms: Two full bathrooms; Bathrooms recently updated (1 to 5 years) — described as brand new
- Heating & cooling: Central heating (ENERGY STAR qualified heat pump); Central air (ENERGY STAR qualified equipment)
- Interior features: Storage; Baseboards; High ceilings; Recessed lighting; Bonus room; Storm windows; Pets allowed
- Laundry & utility: Indoor laundry with washer/dryer hookups; Electric water heater (ENERGY STAR qualified)
Neighborhood map
What this means for you Summary
Snapshot
- This is a 4-bed/2.0-bath manufactured listed at $250k. Condition is rated good.
Deal economics
- At list price, monthly cash flow is $-472 ($-6k/yr) — negative.
- The deal already cash-flows at list — no discount required.
- To meet the 1% rule (rent ≥ 1% of price), the offer needs to be $230k (8.1% below list).
- Recommended offer: $230k (8.1% below list) — sets the bar for 1% rule.
Location & tenants
- Location reads 82/100 on livability (#69 in FL, #1,163 nationally) — a professional / high-income tenant draw. Strengths: crime A+, cost of living A+, housing A+; Watch: amenities C-, commute F.
- Santa Rosa (suburban): math 63% / reading 60% proficiency, ranked #8 of 73 in FL (top 11%) — acceptable for families but not a draw, mixed tenant base, ~2y average lease.
- Market conditions: Rents rising fast (+4.5%/yr); 806 active listings in the ZIP; 1 comparable units currently listed for rent nearby; solid renter incomes; 1,983 units permitted in Santa Rosa County in 2024 (128 in 5+ unit buildings).
- This rent runs 32% of the median local income ($85k/yr) — at the standard rent-burdened threshold; future hikes will face affordability resistance.
Forward outlook
- Local home prices are declining (-3.0%/yr); year-one equity from $2k of loan paydown is wiped out by about $10k of value loss. Plan a longer hold.
- Santa Rosa County population projected at +31% by 2050 — long-run rental-demand tailwind backs the buy-and-hold thesis.
Negotiation context
- It's been on market 46 days — a 3% lower offer ($242k) is reasonable based on typical stale-listing flexibility.
- 2 sale attempts with the ask held roughly flat each time — persistent listings suggest the price (not the market) is what's stuck; bring a comps-based counter.
Questions for the listing agent
- What do current leases actually rent for vs. the listed asking? Can we see a recent rent roll and the last 12 months of T-12 income?
- It's been on market 46 days. Have you received any prior offers? Is the seller open to a 8% concession, seller financing, or rate buy-down credit?
- Is there a deadline driving the sale (1031 exchange, divorce, estate, relocation)? That informs how much negotiation room exists.
- Schools are A-rated — typically a magnet for longer-tenancy family renters. What's the average tenant stay here, and is there a school-zone premium baked into asking?
- The area grade is low — what's the realistic commute time and amenity access for the typical tenant pool here? Any planned neighborhood developments (good or bad) we should know about?
- What's the average days-on-market for RENTAL listings here right now (not sales)? A rising rental-DOM trend means longer vacancies and softer asking-rent achievability than the comps imply.
- What's the recent tenant-quality profile in this submarket — average credit score on applications, eviction rate, late-payment / NSF rate, and stable-employment percentage? A property-management company in the area should have these aggregated.
- How much new for-sale + rental construction is in the pipeline within 1–3 miles? Heavy new supply typically softens prices + rents 12–24 months out; constrained supply supports both.
Investment metrics
- 1% rule
- 0.69% ✗
- Cap rate
- 4.58%
- Cash-on-cash
- -6.11%
- DSCR
- 0.73
- GRM
- 12.0
CMA / ARV
- ARV (on-the-fly)
- $331,128
- Comps found
- 1
Show comp detail 1 sale within ~0.75 mi
| Address | Dist | Beds/Ba | Sqft | Sold | Price | $/sf | Match |
|---|---|---|---|---|---|---|---|
| 5900 Riverchase Rd | 0.31mi | 3/2.5 (-1) | 2,231 (+13%) | 3mo | $375,000 | $168 | 54 |
Match score weights: distance 35% · size 25% · config 20% · recency 20%. Top-matched comps best support the ARV.
Projected returns pro-forma
-3.0% appreciation · 4.53% rent growth · sell at horizon
- IRR
- -25.1%
- Equity multiple
- 0.14×
- Total profit
- $-80,119
- Equity at exit
- $49,372
- IRR
- -17.1%
- Equity multiple
- -0.00×
- Total profit
- $-93,161
- Equity at exit
- $28,630
Cash invested: $92,716 (down + closing). Projections, not guarantees.
Landlord ↔ Tenant lean methodology
- Overall (STATE)
- 87 Strongly Landlord-Friendly
- State Florida
- 87 Strongly Landlord-Friendly · R+3
- County
- — inherits STATE
- City
- — inherits STATE
ZIP-level market 32583
- Home prices YoY
- -11.3%
- Rents YoY
- 4.5%
- Active inventory
- 806
- Price-to-rent
- 9.1×
Monthly cashflow live
- Estimated rent
- $2,299 medium interval (Pro) →
- Mortgage (P&I)
- −$1,736
- Tax est. 1.5%
- −$414 /mo · $4,967/yr
- Insurance
- −$138
- HOA
- −$0
- Vacancy / Maint / Mgmt
- −$483
- Net cashflow
- $-472
Break-even live
UW: 25.0% down · 7.5% · 30yr · 1.5% tax · 5.0% vac · 8.0% maint · 8.0% mgmt
Financing live
Cash to close
- Down payment
- $82,782
- Closing costs
- $9,934
- Reserves months
- —
- Total cash needed
- —
Loan-product check · same deal, 3 products live
Conventional
25% down · 7.5% · 30yr
- Down + closing
- —
- Monthly P&I
- —
- Monthly cashflow
- —
- DSCR
- —
- Eligible?
- —
Personal DTI + credit; lowest rate.
DSCR
20% down · 8.5% · 30yr
- Down + closing
- —
- Monthly P&I
- —
- Monthly cashflow
- —
- DSCR
- —
- Eligible?
- —
No personal income docs; deal must DSCR.
Hard money
10% down · 12.0% · 12mo
- Down + closing
- —
- Monthly P&I
- —
- Monthly cashflow
- —
- DSCR
- —
- Eligible?
- —
Short-term bridge; refi at stabilization.
Rent comps 1 comps
| Address | Beds | Baths | Sqft | Rent | $/sqft | DOM | Units | Dist |
|---|---|---|---|---|---|---|---|---|
| 5860 Murmur Trl Milton, FL | 2.0–3.0 | 2.0–2.5 | 1477 | $1,975 | $1.34 | 21d | 8 | 0.36mi |
Listing history 17 events
-
2026-06-18days on market $250,000 Active 46 DOM
-
2026-06-17days on market $250,000 Active 45 DOM
-
2026-06-16days on market $250,000 Active 44 DOM
-
2026-06-15days on market $250,000 Active 43 DOM
-
2026-06-14days on market $250,000 Active 41 DOM
-
2026-06-10days on market $250,000 Active 38 DOM
-
2026-06-09days on market $250,000 Active 37 DOM
-
2026-06-08days on market $250,000 Active 36 DOM
-
2026-06-07days on market $250,000 Active 35 DOM
-
2026-06-05days on market $250,000 Active 32 DOM
-
2026-06-03days on market $250,000 Active 31 DOM
-
2026-06-02days on market $250,000 Active 30 DOM
-
2026-06-01days on market $250,000 Active 29 DOM
-
2026-05-31days on market $250,000 Active 28 DOM
-
2026-05-31days on market $250,000 Active 27 DOM
-
2026-05-03$250,000 Active
-
2026-04-19$250,000 Active 738-char remark
Show marketing remark (738 chars)
If you've been dreaming of your own little piece of heaven, this brand-new 2026 manufactured home is it!!! Offering 4 bedrooms, 2 bathrooms, and 1,971 square feet, this home sits on approximately an acre in a beautiful wooded setting with a cleared homesite. Inside, you'll love the open layout with two living areas and a kitchen with island that flows into the main spaces. The split bedroom design offers a private primary suite, while the additional bedrooms are on the opposite side of home. Enjoy that down-home country feel while being just a short drive to the beach and close to Pensacola, Eglin, Duke Field, and Whiting Field. Pics are taken from the manufacturers advertisement video of home. Home in to be delivered early May.
ⓘ Source: listings_history table (triggers on properties + properties_extension) + one-shot
backfill from property_details.listing_events for pre-trigger history.
Nearby sold comps map
Loading sold comps map…
Walkable amenities ~0.75 mi
Loading nearby amenities…
Taxation est. · year 1
- Rental income
- $27,584
- − Mortgage interest
- −$18,548
- − Property taxes
- −$4,967
- − Insurance
- −$1,656
- − Repairs & maintenance
- −$2,207
- − Management
- −$2,207
- − Depreciation
- −$9,633
- Taxable loss
- −$11,633
- Est. tax savings @ 24.0%
- +$2,792
- After-tax cash flow
- $-2,877/yr
For passive investors: Depreciation is non-cash, so a rental often shows a tax loss while cash-flowing — sheltering income. Rental losses are passive: they offset passive income freely, and up to $25,000/yr can offset ordinary (W-2) income if you actively participate and your MAGI is under $100k (phasing out to $0 by $150k); unused losses carry forward. On sale, claimed depreciation is recaptured at up to 25%, and gains may owe capital-gains tax (a 1031 exchange can defer both). Figures are a year-1 estimate at your 24.0% rate — not tax advice; consult a CPA.
Condition & rehab AI · 12 photos
This 2026 manufactured home is in excellent condition with a good layout and curb appeal. Minor updates can further enhance its value for both resale and rental.
Value-add opportunities
- Both Paint the exterior siding — Fresh paint can enhance curb appeal and property value.
- Resale Replace the kitchen faucet — A new faucet can improve the kitchen's aesthetic and functionality.
- Both Install smart home devices — Smart home devices can increase convenience and add value to the property.
Renovation cost estimate screening
Value-add ROI direction
- Both Paint the exterior siding — Fresh paint can enhance curb appeal and property value. ↑
- Resale Replace the kitchen faucet — A new faucet can improve the kitchen's aesthetic and functionality. ↑
- Both Install smart home devices — Smart home devices can increase convenience and add value to the property. ↑
ⓘ Cost ranges are severity-bucket heuristics (US national rule-of-thumb). Get contractor quotes + a written scope before underwriting a rehab budget.
Schools (NCES district)
- District
- Santa Rosa
- NCES district ID
- 1201650
- Math proficiency
- 63% ▼ -6.00%
- Reading proficiency
- 60% ▼ -5.00%
- Median HH income
- $58,161
- Composite
- 53.12/100
- National rank
- #1511
- State rank
- #8 of 73 in FL
Livability — Harold
- Score
- 82/100
- State rank
- #69
- US rank
- #1163
Category grades
Schools grade is shown separately in the Schools card above.
Census & demographics
- Census place
- Harold, FL
- County
- Santa Rosa County · 194,764 people
- Metro
- Pensacola-Ferry Pass-Brent, FL
- Population (ZIP)
- 31,828
- Household income
- $85,440
- Rent vs Own
- Severe rent burden
- 122.0
Population outlook (Santa Rosa County) Hauer SSP2
- Today (2025)
- 195,978 people
- By 2030
- 209,782 · +7.0%
- By 2040
- 235,293 · +20.1%
- By 2050
- 256,408 · +30.8%
- By 2075
- 298,074 · +52.1%
- By 2100
- 303,216 · +54.7%
Race, ethnicity, and origin ACS 2023
- Neighborhood character
- Predominantly White (74%)
- Race & ethnicity
- White 74% Black 11% Two or more races 10% Hispanic / Latino 6% Asian 1%
- Hispanic origin (detail)
- Mexican 3% Puerto Rican 2% Cuban 1%
- Common ancestry
- Italian 3% Slovak 2% Serbian 2%
- Foreign-born
- 3% · Canada
- Languages at home
- 94% English-only · Spanish 3%
Political lean MEDSL · Santa Rosa
- 2024 margin
- Solid R (+51.0) · D 24.1% · R 75.0%
- 2008→2024 swing
- -3.0pp toward R · 2008: -47.9pp · 2024: -51.0pp
- All cycles
- 2024: R+51.0 2020: R+46.5 2016: R+53.5 2012: R+52.6 2008: R+47.9
Not yet ingested
- Civics
- —
Market trends
- HPI YoY
- ▼ -38.35%
- Current HPI
- 301.8819
- Rent YoY
- ▲ 4.53%
- Metro
- Pensacola-Ferry Pass-Brent, FL
- State GDP YoY
- ▲ 3.28%
- F500 in state
- 36
Industry mix (Fortune 500 HQ in FL)
| Industry | F500 HQs | Revenue |
|---|---|---|
| Industrial Technology | 2 | $29B |
|
||
| Insurance | 2 | $17B |
|
||
| Retail | 1 | $60B |
|
||
| Technology Distribution | 1 | $58B |
|
||
| Homebuilding | 1 | $35B |
|
||
| Technology Manufacturing | 1 | $35B |
|
||
Price history
+0.0% since first listed2 events — show timeline
- 2026-05-03 Listed $250,000 PARMLS
- 2026-04-19 Listed $250,000 ECAR
Cash-flow waterfall
monthlySold comps — $/sqft
last 12 mo · ≤1 miLoading sold comps…