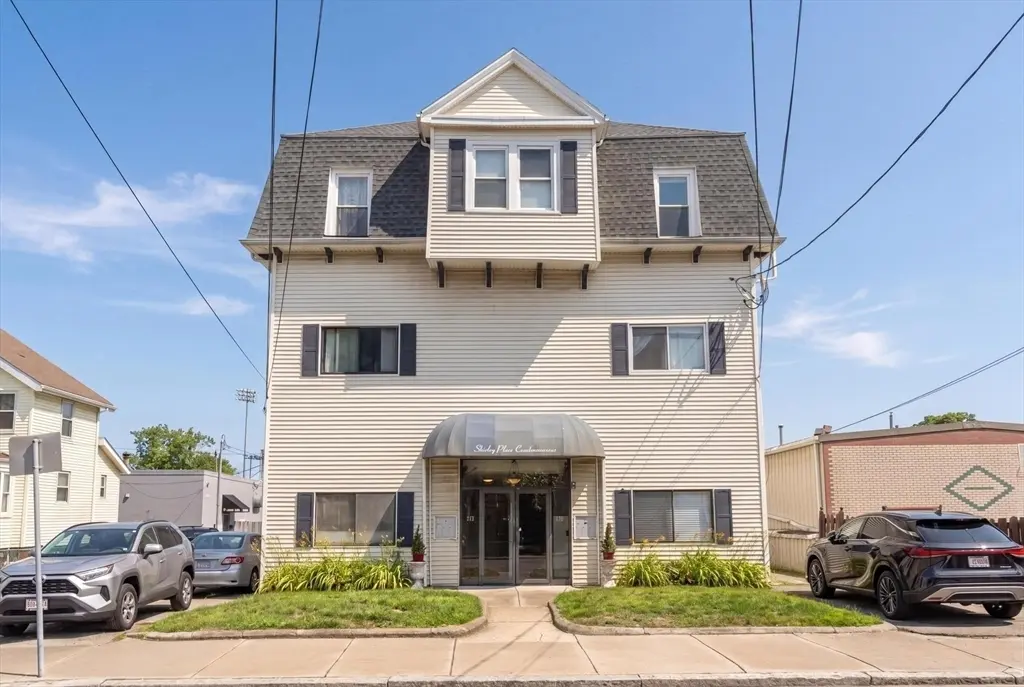
173-175 Shirley St #2 · Winthrop Town, MA
Flood risk No data
- FEMA flood zone
- —
- Chance of flooding over 30 yrs
- —
- Est. flood insurance / yr
- —
Fire risk No data
- Est. fire insurance / yr
- —
Heat risk 6/10 · Moderate
- Hot days now (above threshold)
- 7 days/yr
- Hot days in 30 yrs
- 15 days/yr
Wind risk No data
- Chance of severe wind over 30 yrs
- —
Air-quality risk 3/10 · Minor
- Unhealthy air days now
- 3 days/yr
- Unhealthy air days in 30 yrs
- 3 days/yr
Risk factors via First Street. Map © Google.
Why this score? — see what drove the D grade
The composite is a weighted blend of 9 inputs, each scored 0–100. Each bar is that input's sub-score; the figure is the points it added to the 100-point composite (weight × sub-score).
- ARV discount +15.0/15.0
- Cash flow +7.5/30.0
- Rent growth +5.0/5.0
- Livability +3.8/5.0
- Schools +3.5/10.0
- 1% rule +3.1/10.0
- Condition / age +2.5/5.0
- DSCR +1.7/10.0
- Appreciation +0.0/10.0
$300,000
🖨 Deal sheet 📄 Offer letter ✓ Due diligence
Listing remarks MLS
6 unit building. Eat-in kitchen. Will have condo dues,flood & master insurance. Coin-op laundry. Close to beach. Good sized master bedroom. Yearly budget on file.
Key facts
- $400 HOA
- Parking
- Built 1900
Property features AI
Finance
- Other: Listing status: Active
- HOA & community: Monthly association fee of $400; HOA covers heat, water, sewer, building and grounds maintenance, snow removal, and trash; Association amenities include hot water and laundry; Pets allowed with restrictions; Community features: public transportation, shopping, tennis courts, park, walk/jog trails, golf, medical facility, laundromat, bike path, conservation area, highway access, house of worship, marina, private and public schools, T-Station, university
Exterior
- Parking: One assigned off-street parking space on stone/gravel; Open parking space
- Utilities: Public water; Public sewer; 100 amp electric service; Electric for range
- Home design: Condominium; Low-rise building; Single-story; Ground-level unit / entry at grade; Entry level: 1
- Construction: Frame construction; Year built: approximate (public records)
- Exterior features: Ocean nearby; 0 to 1/10 mile to the beach; Public beach access; Shingle roof
Interior
- Kitchen: Range; Microwave; Refrigerator
- Bedrooms: Master bedroom on the first floor with closet and hardwood flooring; Second bedroom on the first floor with closet and hardwood flooring
- Flooring: Hardwood flooring; Tile flooring
- Bathrooms: One full bathroom on the first floor with tiled tub and stone/ceramic tile flooring
- Heating & cooling: Natural gas heating; Has heating
- Interior features: Ceiling fans in living room and master bedroom; Total of 4 rooms
- Laundry & utility: In-building laundry
Neighborhood map
What this means for you Summary
Snapshot
- This is a 2-bed/1.0-bath condo listed at $300k.
Deal economics
- At list price, monthly cash flow is $-369 ($-4k/yr) — negative.
- To cash-flow at today's rent, offer at most $235k (21.7% below list).
- To meet the 1% rule (rent ≥ 1% of price), the offer needs to be $244k (18.7% below list).
- Recommended offer: $235k (21.7% below list) — sets the bar for cash-flow.
- Cap rate 4.8% vs local median 2.1% in Winthrop Town — top-decile yield for the area; either an underpriced asset or a hidden risk that comps aren't pricing in. Stress-test before assuming the spread holds.
Location & tenants
- Location reads 75/100 on livability (#72 in MA, #3,946 nationally) — a middle-class / working-renter tenant base. Strengths: crime A+, commute A+, employment A+; Watch: amenities F, cost of living F.
- Winthrop (suburban): math 30% / reading 49% proficiency, ranked #200 of 302 in MA (top 66%) — families likely to look elsewhere, expect single-tenant / working-renter base with shorter leases.
- Market conditions: Rents rising fast (+13.3%/yr); 58 active listings in the ZIP; 14 comparable units currently listed for rent nearby; rentals lingering (median 44d on market — plan ~5-8 weeks vacancy on turnover, expect pricing pressure); 50% of comp listings sitting > 30 days — soft ceiling on asking rent; high-income renter base; 2,207 units permitted in Suffolk County in 2024 (1,961 in 5+ unit buildings).
Forward outlook
- Local home prices are declining (-3.0%/yr); year-one equity from $2k of loan paydown is wiped out by about $9k of value loss. Plan a longer hold.
- Suffolk County population projected at +37% by 2050 — long-run rental-demand tailwind backs the buy-and-hold thesis.
Negotiation context
- It's been on market 43 days — a 3% lower offer ($291k) is reasonable based on typical stale-listing flexibility.
- 2 sale attempts since 22y ago; this cycle's ask has dropped $25k (8%) from the opening price — seller is motivated, your offer sets the floor, not the list.
- Current owner paid $220k; 36% above their basis — modest negotiation headroom, anchor on the comps not their cost.
Risks & watch-outs
- Watch-outs: built in 1900 — expect roof / HVAC / electrical / plumbing capex.
- Climate carrying-cost: extreme-heat days projected 7→15/yr by 2055 (HVAC capex compounding) — expect insurance premiums to compound above CPI over the hold.
Questions for the listing agent
- What do current leases actually rent for vs. the listed asking? Can we see a recent rent roll and the last 12 months of T-12 income?
- It's been on market 43 days. Have you received any prior offers? Is the seller open to a 22% concession, seller financing, or rate buy-down credit?
- Built in 1900 — when were the roof, HVAC, electrical panel, plumbing, and water heater last replaced?
- What does the HOA fee cover, when was the last increase, and are there any pending special assessments or reserve-fund shortfalls?
- Any open or pending special assessments — roof, HVAC, plumbing, elevator, façade? What's the per-unit balance and payoff schedule, and is the seller paying it off at close or rolling it to the buyer?
- Is there a deadline driving the sale (1031 exchange, divorce, estate, relocation)? That informs how much negotiation room exists.
- Schools are B-rated — typically a magnet for longer-tenancy family renters. What's the average tenant stay here, and is there a school-zone premium baked into asking?
- The area grade is low — what's the realistic commute time and amenity access for the typical tenant pool here? Any planned neighborhood developments (good or bad) we should know about?
- What's the average days-on-market for RENTAL listings here right now (not sales)? A rising rental-DOM trend means longer vacancies and softer asking-rent achievability than the comps imply.
- What's the recent tenant-quality profile in this submarket — average credit score on applications, eviction rate, late-payment / NSF rate, and stable-employment percentage? A property-management company in the area should have these aggregated.
- How much new apartment / multifamily construction is in the pipeline within 1–3 miles? Heavy new supply (>2% of stock underway) typically softens rents 12–24 months out; light construction supports rent growth.
Investment metrics
- 1% rule
- 0.81% ✗
- Cap rate
- 4.82%
- Cash-on-cash
- -5.27%
- DSCR
- 0.77
- GRM
- 10.3
CMA / ARV
- ARV (median comp)
- $383,762
- List price
- $300,000
- Delta
- -21.83%
- Verdict
- UNDERPRICED
- Comps
- 20 within 1.0 mi
Projected returns pro-forma
-3.0% appreciation · 8.0% rent growth · sell at horizon
- IRR
- -19.2%
- Equity multiple
- 0.30×
- Total profit
- $-59,048
- Equity at exit
- $44,731
- IRR
- -3.2%
- Equity multiple
- 0.73×
- Total profit
- $-22,322
- Equity at exit
- $25,939
Cash invested: $84,000 (down + closing). Projections, not guarantees.
Landlord ↔ Tenant lean methodology
- Overall (STATE)
- 20 Strongly Tenant-Friendly
- State Massachusetts
- 20 Strongly Tenant-Friendly · D+15
- County
- — inherits STATE
- City
- — inherits STATE
ZIP-level market 02152
- Home prices YoY
- -18.7%
- Rents YoY
- 13.3%
- Active inventory
- 58
- Price-to-rent
- 10.3×
Monthly cashflow live
- Estimated rent
- $2,438 high interval (Pro) →
- Mortgage (P&I)
- −$1,573
- Tax from tax record
- −$197 /mo · $2,361/yr
- Insurance
- −$125
- HOA
- −$400
- Vacancy / Maint / Mgmt
- −$512
- Net cashflow
- $-369
Break-even live
UW: 25.0% down · 7.5% · 30yr · 1.5% tax · 5.0% vac · 8.0% maint · 8.0% mgmt
Financing live
Cash to close
- Down payment
- $75,000
- Closing costs
- $9,000
- Reserves months
- —
- Total cash needed
- —
Loan-product check · same deal, 3 products live
Conventional
25% down · 7.5% · 30yr
- Down + closing
- —
- Monthly P&I
- —
- Monthly cashflow
- —
- DSCR
- —
- Eligible?
- —
Personal DTI + credit; lowest rate.
DSCR
20% down · 8.5% · 30yr
- Down + closing
- —
- Monthly P&I
- —
- Monthly cashflow
- —
- DSCR
- —
- Eligible?
- —
No personal income docs; deal must DSCR.
Hard money
10% down · 12.0% · 12mo
- Down + closing
- —
- Monthly P&I
- —
- Monthly cashflow
- —
- DSCR
- —
- Eligible?
- —
Short-term bridge; refi at stabilization.
Rent comps 14 comps
| Address | Beds | Baths | Sqft | Rent | $/sqft | DOM | Units | Dist |
|---|---|---|---|---|---|---|---|---|
| 91 Veterans Rd Winthrop, MA | 2.0 | 1.0 | 750 | $2,945 | $3.93 | 23d | 44 | 0.05mi |
| 20 Coral Ave Unit 6 Winthrop, MA | 1.0 | 1.0 | 600 | $2,050 | $3.42 | 20d | 1 | 0.06mi |
| 20 Coral Ave Unit 10 Winthrop, MA | 1.0 | 1.0 | 600 | $2,050 | $3.42 | 43d | 1 | 0.06mi |
| 53 Trident Ave #101 Winthrop, MA | 2.0 | 1.0 | 678 | $2,500 | $3.69 | 43d | 1 | 0.16mi |
| 17 Cutler St Apt 103 Winthrop, MA | 1.0 | 1.0 | 600 | $1,900 | $3.17 | 17d | 1 | 0.41mi |
| 304 Main St Winthrop, MA | 1.0 | 1.0 | 500 | $2,300 | $4.60 | 19d | 1 | 0.42mi |
| 97 Winthrop Shore Dr Unit 1R Winthrop, MA | 1.0 | 1.0 | 550 | $2,400 | $4.36 | 43d | 1 | 0.43mi |
| 45 Sturgis St Unit 1 Winthrop, MA | 1.0 | 1.0 | 700 | $2,100 | $3.00 | 43d | 1 | 0.57mi |
| 600 Shirley St #01 Winthrop, MA | 1.0 | 2.0 | 604 | $2,650 | $4.39 | 20d | 1 | 0.76mi |
| 789 Shirley St Unit 3 Winthrop, MA | 1.0 | 1.0 | 700 | $2,300 | $3.29 | 12d | 1 | 1.02mi |
| 740 Winthrop Ave Unit 12 Revere, MA | 2.0 | 1.0 | 700 | $2,595 | $3.71 | 43d | 1 | 1.36mi |
| 23B Siren St Unit 2 Winthrop, MA | 1.0 | 1.0 | 500 | $2,025 | $4.05 | 43d | 1 | 1.37mi |
| 93 Bennington St Revere, MA | 2.0 | 1.0–2.0 | 757 | $3,950 | $5.21 | 43d | 1 | 1.41mi |
| 93 Bennington St Revere, MA | 2.0 | 1.0–2.0 | 769 | $3,995 | $5.19 | 2d | 7 | 1.41mi |
HOA detail condo
- Monthly dues
- $400 · $4,800/yr
- Likely covers
- insurance
- Assessments
- None detected in remarks — confirm with the listing agent.
Listing history 21 events
-
2026-06-18days on market $300,000 Active 43 DOM
-
2026-06-17days on market $300,000 Active 42 DOM
-
2026-06-16days on market $300,000 Active 41 DOM
-
2026-06-15statusdays on market $300,000 Active 40 DOM
-
2026-06-13days on market $300,000 Price Changed 38 DOM
-
2026-06-13pricestatusdays on market $300,000 Price Changed 37 DOM
-
2026-06-09days on market $315,000 Active 34 DOM
-
2026-06-08days on market $315,000 Active 33 DOM
-
2026-06-07days on market $315,000 Active 32 DOM
-
2026-06-04remarks 699-char remark
-
2026-06-04days on market $315,000 Active 29 DOM
-
2026-06-03days on market $315,000 Active 28 DOM
-
2026-06-02days on market $315,000 Active 27 DOM
-
2026-06-01days on market $315,000 Active 26 DOM
-
2026-05-31days on market $315,000 Active 25 DOM
-
2026-05-06$325,000 New 666-char remark
-
2006-03-27soldstatus $220,000
-
2004-08-24soldstatus $173,000
-
2004-08-23soldstatus $173,000 166-char remark
Show marketing remark (166 chars)
6 unit building. Eat-in kitchen. Will have condo dues,flood & master insurance. Coin-op laundry. Close to beach. Good sized master bedroom. Yearly budget on file.
-
2004-07-27historical 166-char remark
Show marketing remark (166 chars)
6 unit building. Eat-in kitchen. Will have condo dues,flood & master insurance. Coin-op laundry. Close to beach. Good sized master bedroom. Yearly budget on file.
-
2004-03-06$184,500 166-char remark
Show marketing remark (166 chars)
6 unit building. Eat-in kitchen. Will have condo dues,flood & master insurance. Coin-op laundry. Close to beach. Good sized master bedroom. Yearly budget on file.
ⓘ Source: listings_history table (triggers on properties + properties_extension) + one-shot
backfill from property_details.listing_events for pre-trigger history.
Tax reassessment forecast MA · Partial reset (capped growth)
- Current annual tax
- $2,361 · $197/mo
- Projected year-2 tax
- $3,026 · $252/mo
- Expected delta
- +$664/yr (+$55/mo · 28.1%)
ⓘ Screening estimate from a state-policy table — verify with the county assessor before closing.
Climate risk First Street
- Heat 6/10 Major
- Air quality 3/10 Moderate 3 unhealthy d/yr today · 3 by 30 yrs out
Nearby sold comps map
Loading sold comps map…
Walkable amenities ~0.75 mi
Loading nearby amenities…
Taxation est. · year 1
- Rental income
- $29,257
- − Mortgage interest
- −$16,805
- − Property taxes
- −$2,361
- − Insurance
- −$1,500
- − Repairs & maintenance
- −$2,341
- − Management
- −$2,341
- − HOA
- −$4,800
- − Depreciation
- −$8,727
- Taxable loss
- −$9,617
- Est. tax savings @ 24.0%
- +$2,308
- After-tax cash flow
- $-2,118/yr
For passive investors: Depreciation is non-cash, so a rental often shows a tax loss while cash-flowing — sheltering income. Rental losses are passive: they offset passive income freely, and up to $25,000/yr can offset ordinary (W-2) income if you actively participate and your MAGI is under $100k (phasing out to $0 by $150k); unused losses carry forward. On sale, claimed depreciation is recaptured at up to 25%, and gains may owe capital-gains tax (a 1031 exchange can defer both). Figures are a year-1 estimate at your 24.0% rate — not tax advice; consult a CPA.
Schools (NCES district)
- District
- Winthrop
- NCES district ID
- 2513170
- Math proficiency
- 30% ▼ -23.00%
- Reading proficiency
- 49% ▼ -9.00%
- Median HH income
- $63,859
- Composite
- 35.33/100
- National rank
- #4960
- State rank
- #200 of 302 in MA
Livability — Winthrop Town
- Score
- 75/100
- State rank
- #72
- US rank
- #3946
Category grades
Schools grade is shown separately in the Schools card above.
Census & demographics
- Census place
- Winthrop Town, MA
- County
- Suffolk County · 777,335 people
- City population
- 18,807
- Metro
- Boston-Cambridge-Newton, MA-NH
- Population (ZIP)
- 18,759
- Household income
- $116,167
- Rent vs Own
- Severe rent burden
- 862.0
Population outlook (Suffolk County) Hauer SSP2
- Today (2025)
- 915,464 people
- By 2030
- 983,798 · +7.5%
- By 2040
- 1,119,602 · +22.3%
- By 2050
- 1,255,187 · +37.1%
- By 2075
- 1,534,434 · +67.6%
- By 2100
- 1,748,505 · +91.0%
Race, ethnicity, and origin ACS 2023
- Neighborhood character
- Predominantly White (71%)
- Race & ethnicity
- White 71% Hispanic / Latino 20% Two or more races 7% Black 3% Native American 2% Asian 2%
- Hispanic origin (detail)
- Puerto Rican 2% Cuban 3%
- Common ancestry
- Romanian 3% Russian 2% Lithuanian 1%
- Foreign-born
- 19% · Canada, Jamaica, China
- Languages at home
- 70% English-only · Spanish 18% Other Indo-European 5% Arabic 3%
Political lean MEDSL · Suffolk
- 2024 margin
- Solid D (+52.5) · D 74.8% · R 22.4% · Other 2.8%
- 2008→2024 swing
- -3.2pp toward R · 2008: 55.7pp · 2024: 52.5pp
- All cycles
- 2024: D+52.5 2020: D+63.2 2016: D+63.0 2012: D+56.7 2008: D+55.7
Not yet ingested
- Civics
- —
Market trends
- HPI YoY
- ▼ -79.09%
- Current HPI
- 344.6568
- Rent YoY
- ▲ 13.35%
- Metro
- Boston-Cambridge-Newton, MA-NH
- State GDP YoY
- ▲ 2.28%
- F500 in state
- 38
Industry mix (Fortune 500 HQ in MA)
| Industry | F500 HQs | Revenue |
|---|---|---|
| Technology | 3 | $17B |
|
||
| Insurance | 2 | $84B |
|
||
| Retail | 2 | $76B |
|
||
| Life Sciences | 1 | $43B |
|
||
| Energy Technology | 1 | $31B |
|
||
| Aerospace / Defense | 1 | $18B |
|
||
Price history
+62.6% since first listed8 events — show timeline
- 2026-06-10 Price Changed $300,000 MLS PIN
- 2026-05-20 Price Changed $315,000 MLS PIN
- 2026-05-06 Listed $325,000 MLS PIN
- 2006-03-27 Sold (Public Records) $220,000 Public Records
- 2004-08-24 Sold (Public Records) $173,000 Public Records
- 2004-08-23 Sold (MLS) $173,000 MLS PIN
- 2004-07-27 Listing Removed — MLS PIN
- 2004-03-06 Listed $184,500 MLS PIN
Property tax history
+1.2%/yrLatest (2023): $2,361 · -3.8% YoY. Source: county tax records.
Cash-flow waterfall
monthlySold comps — $/sqft
last 12 mo · ≤1 miLoading sold comps…