1515 E St Patrick St · Rapid City, SD
Flood risk 1/10 · Minimal
- FEMA flood zone
- X (unshaded)
- Chance of flooding over 30 yrs
- 0.0%
- Est. flood insurance / yr
- $473 – $860
Fire risk 6/10 · Moderate
- Est. fire insurance / yr
- $1,342 – $2,492
Heat risk 2/10 · Minimal
- Hot days now (above 95°F)
- 7 days/yr
- Hot days in 30 yrs
- 16 days/yr
Wind risk 2/10 · Minimal
- Chance of severe wind over 30 yrs
- —
Air-quality risk 4/10 · Minor
- Unhealthy air days now
- 4 days/yr
- Unhealthy air days in 30 yrs
- 4 days/yr
Risk factors via First Street. Map © Google.
Why this score? — see what drove the B grade
The composite is a weighted blend of 9 inputs, each scored 0–100. Each bar is that input's sub-score; the figure is the points it added to the 100-point composite (weight × sub-score).
- Cash flow +30.0/30.0
- 1% rule +10.0/10.0
- DSCR +10.0/10.0
- ARV discount +7.5/15.0
- Livability +3.7/5.0
- Schools +3.4/10.0
- Rent growth +2.9/5.0
- Condition / age +2.5/5.0
- Appreciation +0.0/10.0
$39,900
🖨 Deal sheet (PDF) 📄 Offer letter ✓ Due diligence
Listing remarks MLS
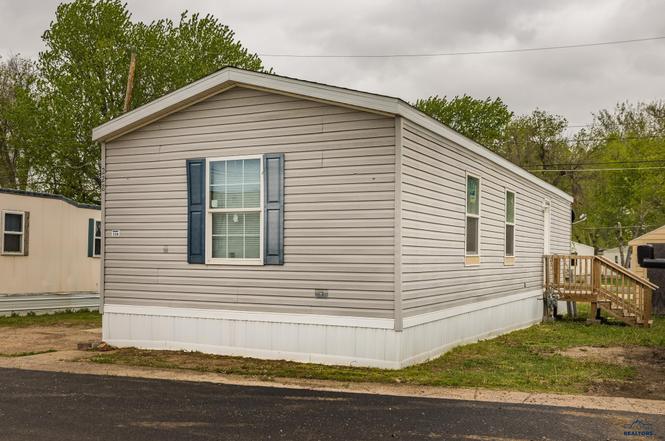
Well-maintained 2017 mobile home featuring 3 bedrooms and 1 bathroom. Recent 2024 upgrades include new siding, skirting, and a covered front porch. Includes a storage shed for added convenience. Buyer must be approved by park management. Great opportunity for affordable, move-in-ready living.
Key facts
- Covered front porch
- New siding
- New skirting
Tags
Property features AI
Finance
- Other: Located in the HERRING BONE subdivision
- HOA & community: No association amenities
Exterior
- Security: Smoke detector(s)
- Utilities: Electric with circuit breakers
- Home design: Manufactured home; Single-story
- Construction: Composition roof
- Exterior features: Level lot; Has view; No fencing
Interior
- Kitchen: Microwave; Refrigerator
- Flooring: Carpet
- Bathrooms: 1 full bathroom
- Heating & cooling: Forced air heating; Window unit cooling
- Interior features: Microwave; Refrigerator; Carpet flooring; Has cooling (window unit); Forced air heating
- Laundry & utility: Washer and dryer (main level)
Neighborhood map
What this means for you Summary
Snapshot
- This is a 3-bed/1.0-bath single-family listed at $40k.
Deal economics
- At list price, monthly cash flow is $764 ($9k/yr) — positive.
- The deal already cash-flows at list — no discount required.
- Meets the 1% rule at list price ($1k rent vs $40k).
- Recommended offer: $35k (12.0% below list) — sets the bar for market timing.
- Cap rate 29.3% vs local median 2.5% in Rapid City — top-decile yield for the area; either an underpriced asset or a hidden risk that comps aren't pricing in. Stress-test before assuming the spread holds.
Location & tenants
- Location reads 74/100 on livability (#34 in SD, #4,720 nationally) — a middle-class / working-renter tenant base. Strengths: cost of living A+, housing A+, health & safety A+; Watch: crime F, commute F.
- Rapid City Area School District 51-4 (urban): math 34% / reading 46% proficiency, ranked #50 of 59 in SD (top 85%) — families likely to look elsewhere, expect single-tenant / working-renter base with shorter leases.
- Zoned schools: Robbinsdale Elementary - 14 (math 17% / reading 27%, grade F, #228 of 253 statewide, top 92%, 359 students, 100% FRL); East Middle School - 30 (math 26% / reading 38%, grade F, #121 of 143 statewide, top 87%, 600 students, 37% FRL); Central High School - 41 (math 35% / reading 61%, grade D, #106 of 151 statewide, top 71%, 1,768 students, 37% FRL) — zoned schools average 58% FRL vs 36% district-wide (22 pts higher); higher-poverty schools than district average — tighter screening recommended.
- Market conditions: Rents rising (+1.7%/yr); 217 active listings in the ZIP; 5 comparable units currently listed for rent nearby; rentals at typical pace (median 23d on market — plan ~3-4 weeks tenant-placement turnaround); 1,181 units permitted in Pennington County in 2024 (715 in 5+ unit buildings).
Forward outlook
- Local home prices are declining (-3.0%/yr); year-one equity from $276 of loan paydown is wiped out by about $1k of value loss. Plan a longer hold.
- Pennington County population projected at +28% by 2050 — long-run rental-demand tailwind backs the buy-and-hold thesis.
- At projected returns (-3.0% appreciation + 1.7% rent growth), your $11k cash investment doubles in ~2 years — after that, you're playing with house money.
Negotiation context
- It's been on market 154 days — a 12% lower offer ($35k) is reasonable based on typical stale-listing flexibility.
- 20 sale attempts since 3y ago with the ask held roughly flat each time — persistent listings suggest the price (not the market) is what's stuck; bring a comps-based counter.
- Current owner paid $25k; list at $40k implies a 60% gain — meaningful room to come down on a strong offer.
Risks & watch-outs
- Climate carrying-cost: major wildfire risk — expect insurance premiums to compound above CPI over the hold.
Questions for the listing agent
- It's been on market 154 days. Have you received any prior offers? Is the seller open to a 12% concession, seller financing, or rate buy-down credit?
- Why hasn't it sold? Are there any deal-killer items the seller is aware of (foundation, flood, title, zoning, code violations)?
- Is there a deadline driving the sale (1031 exchange, divorce, estate, relocation)? That informs how much negotiation room exists.
- Crime grade is F in this area — have there been break-ins, vandalism, or insurance claims at this property in the last 3 years? What carrier currently insures it and at what premium?
- What's the average days-on-market for RENTAL listings here right now (not sales)? A rising rental-DOM trend means longer vacancies and softer asking-rent achievability than the comps imply.
- What's the recent tenant-quality profile in this submarket — average credit score on applications, eviction rate, late-payment / NSF rate, and stable-employment percentage? A property-management company in the area should have these aggregated.
- How much new for-sale + rental construction is in the pipeline within 1–3 miles? Heavy new supply typically softens prices + rents 12–24 months out; constrained supply supports both.
Investment metrics
- 1% rule
- 3.30% ✓
- Cap rate
- 29.27%
- Cash-on-cash
- 82.07%
- DSCR
- 4.65
- GRM
- 2.5
CMA / ARV
- ARV (on-the-fly)
- $252,648
- Comps found
- 12
Show comp detail 12 sales within ~0.75 mi
| Address | Dist | Beds/Ba | Sqft | Sold | Price | $/sf | Match |
|---|---|---|---|---|---|---|---|
| 806 E Ohio St | 0.74mi | 3/1.0 | 1,284 (+1%) | 8mo | $115,000 | $90 | 58 |
| 2312 Smith Ave | 0.44mi | 3/2.0 | 1,365 (+7%) | 8mo | $250,000 | $183 | 57 |
| 814 E Ohio St | 0.72mi | 3/1.0 | 1,355 (+6%) | 1mo | $231,900 | $171 | 56 |
| 930 E Oakland St | 0.68mi | 4/1.5 (+1) | 1,224 (-4%) | 2mo | $239,000 | $195 | 53 |
| 913 E St Francis St | 0.54mi | 3/1.5 | 1,391 (+9%) | 9mo | $260,300 | $187 | 50 |
| 821 E Ohio St | 0.71mi | 3/1.0 | 1,176 (-8%) | 7mo | $266,000 | $226 | 48 |
| 908 E Tallent St | 0.60mi | 3/1.0 | 1,092 (-14%) | 1mo | $240,000 | $220 | 47 |
| 2103 Maywood Dr | 0.57mi | 4/1.0 (+1) | 1,140 (-11%) | 5mo | $209,900 | $184 | 46 |
| 923 E Oakland St | 0.71mi | 4/1.5 (+1) | 1,224 (-4%) | 9mo | $242,000 | $198 | 45 |
| 2137 Maywood Dr | 0.56mi | 3/1.0 | 1,092 (-14%) | 8mo | $282,999 | $259 | 43 |
| 2624 Hoefer Ave | 0.72mi | 3/2.0 | 1,448 (+14%) | 1mo | $310,000 | $214 | 39 |
| 2345 E St Francis St | 0.70mi | 3/3.0 | 1,390 (+9%) | 8mo | $320,000 | $230 | 38 |
Match score weights: distance 35% · size 25% · config 20% · recency 20%. Top-matched comps best support the ARV.
Projected returns pro-forma
-3.0% appreciation · 1.71% rent growth · sell at horizon
- IRR
- 80.9%
- Equity multiple
- 4.63×
- Total profit
- $40,533
- Equity at exit
- $5,949
- IRR
- 84.0%
- Equity multiple
- 9.17×
- Total profit
- $91,296
- Equity at exit
- $3,450
Cash invested: $11,172 (down + closing). Projections, not guarantees.
Landlord ↔ Tenant lean methodology
- Overall (STATE)
- 83 Strongly Landlord-Friendly
- State South Dakota
- 83 Strongly Landlord-Friendly · R+16
- County
- — inherits STATE
- City
- — inherits STATE
ZIP-level market 57701
- Rents YoY
- 1.7%
- Active inventory
- 217
- Price-to-rent
- 2.5×
Monthly cashflow live
- Estimated rent
- $1,316 high interval (Pro) →
- Mortgage (P&I)
- −$209
- Tax est. 1.5%
- −$50 /mo · $598/yr
- Insurance
- −$17
- HOA
- −$0
- Vacancy / Maint / Mgmt
- −$276
- Net cashflow
- $764
Break-even live
Sensitivity live
| Price | -10% $792 | -5% $778 | +0% $764 | +5% $750 | +10% $737 |
|---|---|---|---|---|---|
| Rent | -10% $660 | -5% $712 | +0% $764 | +5% $816 | +10% $868 |
| Rate | -1.0pp $784 | -0.5pp $774 | base $764 | +0.5pp $754 | +1.0pp $743 |
UW: 25.0% down · 7.5% · 30yr · 1.5% tax · 5.0% vac · 8.0% maint · 8.0% mgmt
Financing live
Cash to close
- Down payment
- $9,975
- Closing costs
- $1,197
- Reserves months
- —
- Total cash needed
- —
Loan-product check · same deal, 3 products live
Conventional
25% down · 7.5% · 30yr
- Down + closing
- —
- Monthly P&I
- —
- Monthly cashflow
- —
- DSCR
- —
- Eligible?
- —
Personal DTI + credit; lowest rate.
DSCR
20% down · 8.5% · 30yr
- Down + closing
- —
- Monthly P&I
- —
- Monthly cashflow
- —
- DSCR
- —
- Eligible?
- —
No personal income docs; deal must DSCR.
Hard money
10% down · 12.0% · 12mo
- Down + closing
- —
- Monthly P&I
- —
- Monthly cashflow
- —
- DSCR
- —
- Eligible?
- —
Short-term bridge; refi at stabilization.
Rent comps 5 comps
| Address | Beds | Baths | Sqft | Rent | $/sqft | DOM | Units | Dist |
|---|---|---|---|---|---|---|---|---|
| 3335 Palm Dr Rapid City, SD | 2.0 | 1.0 | 900 | $1,250 | $1.39 | 22d | 1 | 1.10mi |
| 426 E Fairmont Blvd Rapid City, SD | 3.0 | 2.0 | 990 | $999 | $1.01 | 22d | 1 | 1.17mi |
| 1230 Estes Park Ct Rapid City, SD | 2.0 | 1.0–2.0 | 956 | $1,035 | $1.08 | 22d | 9 | 1.27mi |
| 118 Waterloo St Apt 110 Rapid City, SD | 1.0–4.0 | 1.0–1.5 | 810 | $1,180 | $1.46 | 22d | 7 | 1.44mi |
| 3276 Jim St Rapid City, SD | 2.0 | 1.0–2.0 | 718 | $1,500 | $2.09 | 22d | 50 | 1.44mi |
Listing history 50 events
-
2026-06-21days on market $39,900 Active 154 DOM
-
2026-06-19days on market $39,900 Active 152 DOM
-
2026-06-18days on market $39,900 Active 151 DOM
-
2026-06-17days on market $39,900 Active 150 DOM
-
2026-06-16days on market $39,900 Active 149 DOM
-
2026-06-15days on market $39,900 Active 148 DOM
-
2026-06-14days on market $39,900 Active 146 DOM
-
2026-06-13days on market $39,900 Active 145 DOM
-
2026-06-10days on market $39,900 Active 143 DOM
-
2026-06-09days on market $39,900 Active 142 DOM
-
2026-06-08days on market $39,900 Active 141 DOM
-
2026-06-07days on market $39,900 Active 140 DOM
-
2026-06-05days on market $39,900 Active 137 DOM
-
2026-06-02days on market $39,900 Active 135 DOM
-
2026-06-01days on market $39,900 Active 134 DOM
-
2026-05-31days on market $39,900 Active 133 DOM
-
2026-05-30days on market $39,900 Active 132 DOM
-
2026-05-18price $39,900 293-char remark
Show marketing remark (293 chars)
Well-maintained 2017 mobile home featuring 3 bedrooms and 1 bathroom. Recent 2024 upgrades include new siding, skirting, and a covered front porch. Includes a storage shed for added convenience. Buyer must be approved by park management. Great opportunity for affordable, move-in-ready living.
-
2026-05-04price $44,900 293-char remark
Show marketing remark (293 chars)
Well-maintained 2017 mobile home featuring 3 bedrooms and 1 bathroom. Recent 2024 upgrades include new siding, skirting, and a covered front porch. Includes a storage shed for added convenience. Buyer must be approved by park management. Great opportunity for affordable, move-in-ready living.
-
2026-03-17price $49,900 293-char remark
Show marketing remark (293 chars)
Well-maintained 2017 mobile home featuring 3 bedrooms and 1 bathroom. Recent 2024 upgrades include new siding, skirting, and a covered front porch. Includes a storage shed for added convenience. Buyer must be approved by park management. Great opportunity for affordable, move-in-ready living.
-
2026-02-22historical Active Under Contract
-
2026-01-21$39,000 Active
-
2026-01-19$55,000 Active 293-char remark
Show marketing remark (293 chars)
Well-maintained 2017 mobile home featuring 3 bedrooms and 1 bathroom. Recent 2024 upgrades include new siding, skirting, and a covered front porch. Includes a storage shed for added convenience. Buyer must be approved by park management. Great opportunity for affordable, move-in-ready living.
-
2025-10-31price $45,000
-
2025-09-19status Active
-
2025-09-04historical Active Under Contract
-
2025-08-11price $50,000
-
2025-06-19price $60,000
-
2025-05-24price $70,000
-
2025-05-22$75,000 Active
-
2025-03-21soldstatus $25,000 Closed
-
2025-03-21soldstatus $25,000 Closed
-
2025-03-11Active Under Contract
-
2025-03-11Active Under Contract
-
2025-03-11$26,900
-
2025-03-06$26,900
-
2025-03-06$26,900
-
2025-03-06$26,900
-
2025-01-29price $26,900
-
2025-01-29price $26,900
-
2025-01-11$55,000 Active
-
2024-12-09price $28,900
-
2024-12-09price $28,900
-
2024-11-06$39,900 Active
-
2024-11-01price $32,000
-
2024-11-01price $32,000
-
2024-10-18soldstatus $55,000 Closed
-
2024-09-24price $35,000
-
2024-09-24price $35,000
-
2024-09-15$55,000 Active
ⓘ Source: listings_history table (triggers on properties + properties_extension) + one-shot
backfill from property_details.listing_events for pre-trigger history.
Climate risk First Street
- Flood 1/10 Low FEMA zone X (unshaded) · 0% chance over 30 yrs
- Wildfire 6/10 Major
- Heat 2/10 Low 7 d/yr ≥95°F today · 16 d/yr by 30 yrs out
- Wind 2/10 Low
- Air quality 4/10 Moderate 4 unhealthy d/yr today · 4 by 30 yrs out
Nearby sold comps map
Loading sold comps map…
Walkable amenities ~0.75 mi
Loading nearby amenities…
Taxation est. · year 1
- Rental income
- $15,795
- − Mortgage interest
- −$2,235
- − Property taxes
- −$598
- − Insurance
- −$200
- − Repairs & maintenance
- −$1,264
- − Management
- −$1,264
- − Depreciation
- −$1,161
- Taxable income
- $9,074
- Est. tax owed @ 24.0%
- −$2,178
- After-tax cash flow
- $6,991/yr
For passive investors: Depreciation is non-cash, so a rental often shows a tax loss while cash-flowing — sheltering income. Rental losses are passive: they offset passive income freely, and up to $25,000/yr can offset ordinary (W-2) income if you actively participate and your MAGI is under $100k (phasing out to $0 by $150k); unused losses carry forward. On sale, claimed depreciation is recaptured at up to 25%, and gains may owe capital-gains tax (a 1031 exchange can defer both). Figures are a year-1 estimate at your 24.0% rate — not tax advice; consult a CPA.
Schools (NCES district)
- District
- Rapid City Area School District 51-4
- NCES district ID
- 4659820
- Math proficiency
- 34% ▼ -8.00%
- Reading proficiency
- 46% ▼ -4.00%
- Median HH income
- $50,145
- Composite
- 34.47/100
- National rank
- #5189
- State rank
- #50 of 59 in SD
Livability — Rapid City
- Score
- 74/100
- State rank
- #34
- US rank
- #4720
Category grades
Schools grade is shown separately in the Schools card above.
Census & demographics
- Census place
- Rapid City, SD
- County
- Pennington County · 99,403 people
- City population
- 99,403
- Metro
- Rapid City, SD
- Population (ZIP)
- 45,795
- Household income
- $56,461
- Rent vs Own
- Severe rent burden
- 1646.0
Population outlook (Pennington County) Hauer SSP2
- Today (2025)
- 125,504 people
- By 2030
- 133,370 · +6.3%
- By 2040
- 147,505 · +17.5%
- By 2050
- 160,507 · +27.9%
- By 2075
- 197,585 · +57.4%
- By 2100
- 241,736 · +92.6%
Race, ethnicity, and origin ACS 2023
- Neighborhood character
- Predominantly White (73%)
- Race & ethnicity
- White 73% Native American 11% Two or more races 11% Hispanic / Latino 6% Black 2%
- Hispanic origin (detail)
- Mexican 4%
- Common ancestry
- Portuguese 7% Lithuanian 4% Slovak 3%
- Foreign-born
- 2% · Canada
- Languages at home
- 96% English-only · Spanish 1%
Political lean MEDSL · Pennington
- 2024 margin
- Strong R (+26.4) · D 35.4% · R 61.9% · Other 2.7%
- 2008→2024 swing
- -5.3pp toward R · 2008: -21.2pp · 2024: -26.4pp
- All cycles
- 2024: R+26.4 2020: R+25.1 2016: R+33.0 2012: R+29.5 2008: R+21.2
Not yet ingested
- Civics
- —
Market trends
- HPI YoY
- ▼ -189.12%
- Current HPI
- 222.9041
- Rent YoY
- ▲ 1.71%
- Metro
- Rapid City, SD
- State GDP YoY
- ▲ 0.70%
- F500 in state
- 2
Industry mix (Fortune 500 HQ in SD)
| Industry | F500 HQs | Revenue |
|---|---|---|
| Utilities | 1 | $1B |
|
||
Price history
-99.4% since first listed51 events — show timeline
- 2026-05-18 Price Changed $39,900 BHMLS
- 2026-05-04 Price Changed $44,900 BHMLS
- 2026-03-17 Price Changed $49,900 BHMLS
- 2026-02-22 Contingent — BHMLS
- 2026-01-21 Listed $39,000 BHMLS
- 2026-01-19 Listed $55,000 BHMLS
- 2025-10-31 Price Changed $45,000 BHMLS
- 2025-09-19 Relisted — BHMLS
- 2025-09-04 Contingent — BHMLS
- 2025-08-11 Price Changed $50,000 BHMLS
- 2025-06-19 Price Changed $60,000 BHMLS
- 2025-05-24 Price Changed $70,000 BHMLS
- 2025-05-22 Listed $75,000 BHMLS
- 2025-03-21 Sold (MLS) $25,000 BHMLS
- 2025-03-21 Sold (MLS) $25,000 MRAOR
- 2025-03-11 Listed — MRAOR
- 2025-03-11 Listed — BHMLS
- 2025-03-11 Listed $26,900 MRAOR
- 2025-03-06 Listed $26,900 MRAOR
- 2025-03-06 Listed $26,900 BHMLS
- 2025-03-06 Listed $26,900 MRAOR
- 2025-01-29 Price Changed $26,900 MRAOR
- 2025-01-29 Price Changed $26,900 BHMLS
- 2025-01-11 Listed $55,000 BHMLS
- 2024-12-09 Price Changed $28,900 MRAOR
- 2024-12-09 Price Changed $28,900 BHMLS
- 2024-11-06 Listed $39,900 BHMLS
- 2024-11-01 Price Changed $32,000 MRAOR
- 2024-11-01 Price Changed $32,000 BHMLS
- 2024-10-18 Sold (MLS) $55,000 BHMLS
- 2024-09-24 Price Changed $35,000 BHMLS
- 2024-09-24 Price Changed $35,000 MRAOR
- 2024-09-15 Listed $55,000 BHMLS
- 2024-09-08 Listed $43,900 MRAOR
- 2024-09-08 Price Changed $43,900 BHMLS
- 2024-09-07 Listed $49,900 BHMLS
- 2024-07-24 Sold (MLS) $43,900 BHMLS
- 2024-07-24 Sold (MLS) $43,900 MRAOR
- 2024-07-11 Pending — MRAOR
- 2024-07-07 Listed $47,000 MRAOR
- 2024-07-07 Listed $47,000 BHMLS
- 2024-03-05 Sold (MLS) $43,000 MRAOR
- 2024-03-05 Sold (MLS) $43,000 BHMLS
- 2024-03-01 Contingent — MRAOR
- 2024-02-22 Listed $47,500 MRAOR
- 2024-02-22 Listed $47,500 BHMLS
- 2023-09-01 Sold (MLS) $30,500 MRAOR
- 2023-08-23 Pending — MRAOR
- 2023-08-08 Price Changed $39,900 MRAOR
- 2023-07-16 Listed $54,900 MRAOR
- 2009-04-10 Sold (Public Records) $7,012,000 Public Records
Property tax history
-4.9%/yrLatest (2025): $18,349 · -8.1% YoY. Source: county tax records.
Cash-flow waterfall
monthlySold comps — $/sqft
last 12 mo · ≤1 miLoading sold comps…