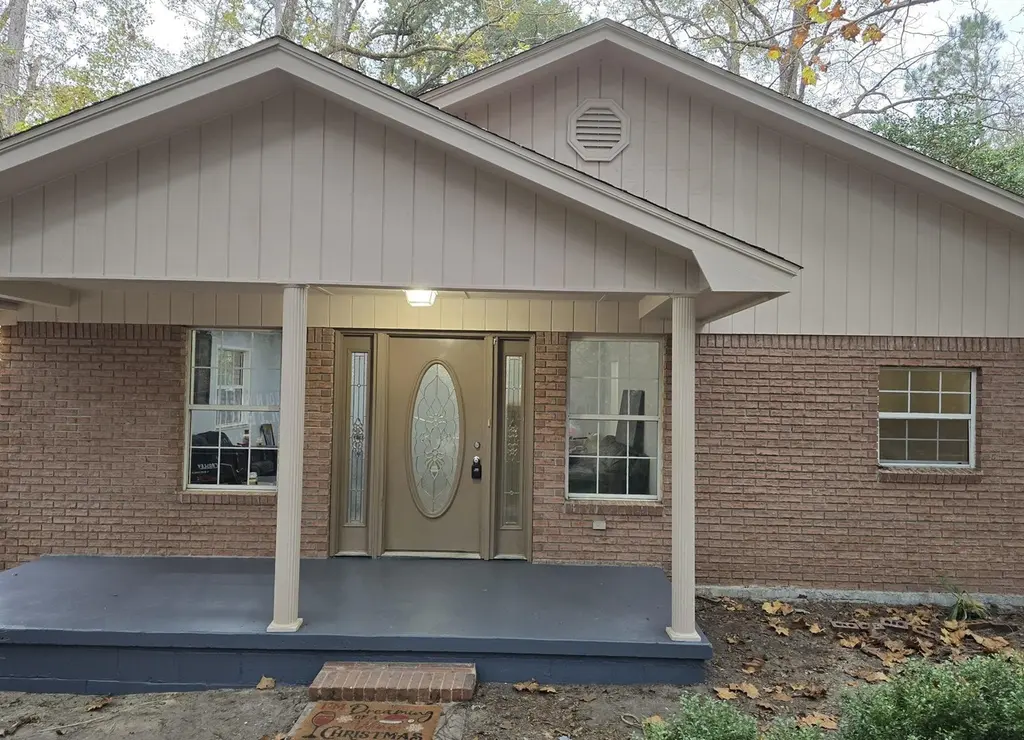
668 M L King Blvd · Midway, FL
Flood risk 1/10 · Minimal
- FEMA flood zone
- X (unshaded)
- Chance of flooding over 30 yrs
- 0.0%
- Est. flood insurance / yr
- $507 – $1,088
Fire risk 5/10 · Moderate
- Est. fire insurance / yr
- $947 – $1,759
Heat risk 8/10 · Major
- Hot days now (above 108°F)
- 7 days/yr
- Hot days in 30 yrs
- 21 days/yr
Wind risk 9/10 · Severe
- Chance of severe wind over 30 yrs
- 99.0%
Air-quality risk 4/10 · Minor
- Unhealthy air days now
- 5 days/yr
- Unhealthy air days in 30 yrs
- 7 days/yr
Risk factors via First Street. Map © Google.
Why this score? — see what drove the C- grade
The composite is a weighted blend of 9 inputs, each scored 0–100. Each bar is that input's sub-score; the figure is the points it added to the 100-point composite (weight × sub-score).
- ARV discount +15.0/15.0
- Cash flow +13.6/30.0
- Appreciation +4.6/10.0
- DSCR +4.1/10.0
- 1% rule +2.9/10.0
- Schools +2.6/10.0
- Rent growth +2.5/5.0
- Livability +2.5/5.0
- Condition / age +2.5/5.0
$219,900
🖨 Deal sheet (PDF) 📄 Offer letter ✓ Due diligence
Listing remarks MLS
Discover this beautifully updated 3-bedroom, 2-bath home tucked away in a serene and private setting in Midway, FL. Boasting a classic brick exterior, this home combines timeless appeal with modern upgrades, making it truly move-in ready.
Key facts
- 0.29 acre lot
- Parking
- Built 1940
Neighborhood map
What this means for you Summary
Snapshot
- This is a 2-bed/1.0-bath single-family listed at $220k.
Deal economics
- At list price, monthly cash flow is $12 ($143/yr) — positive.
- The deal already cash-flows at list — no discount required.
- To meet the 1% rule (rent ≥ 1% of price), the offer needs to be $175k (20.5% below list).
- Recommended offer: $175k (20.5% below list) — sets the bar for 1% rule.
- Cap rate 6.4% vs local median 4.1% in Midway — top-decile yield for the area; either an underpriced asset or a hidden risk that comps aren't pricing in. Stress-test before assuming the spread holds.
Location & tenants
- Location reads: area grade C — affects rentability + tenant quality, not the cash-flow math above.
- Gadsden (rural): math 31% / reading 31% proficiency, ranked #70 of 73 in FL (top 96%) — families likely to look elsewhere, expect single-tenant / working-renter base with shorter leases; 83% free/reduced lunch — lower-income household profile, screen leases tightly.
- Market conditions: 20 active listings in the ZIP; 107 units permitted in Gadsden County in 2024 (36 in 5+ unit buildings).
Forward outlook
- Local home prices are declining (-0.9%/yr); year-one equity from $2k of loan paydown is wiped out by about $2k of value loss. Plan a longer hold.
- Gadsden County population projected at -27% by 2050 — secular population decline; favor cash flow + early exit over multi-decade hold.
Negotiation context
- It's been on market 223 days — a 12% lower offer ($194k) is reasonable based on typical stale-listing flexibility.
- 3 sale attempts since 4y ago with the ask held roughly flat each time — persistent listings suggest the price (not the market) is what's stuck; bring a comps-based counter.
- Current owner paid $90k; list at $220k implies a 144% gain — meaningful room to come down on a strong offer.
Risks & watch-outs
- Watch-outs: built in 1940 — expect roof / HVAC / electrical / plumbing capex.
- Climate carrying-cost: severe wind risk, 99% chance of damaging wind over 30y; moderate wildfire risk; extreme-heat days projected 7→21/yr by 2055 (HVAC capex compounding) — expect insurance premiums to compound above CPI over the hold.
Questions for the listing agent
- It's been on market 223 days. Have you received any prior offers? Is the seller open to a 21% concession, seller financing, or rate buy-down credit?
- Built in 1940 — when were the roof, HVAC, electrical panel, plumbing, and water heater last replaced?
- Why hasn't it sold? Are there any deal-killer items the seller is aware of (foundation, flood, title, zoning, code violations)?
- Is there a deadline driving the sale (1031 exchange, divorce, estate, relocation)? That informs how much negotiation room exists.
- What's the average days-on-market for RENTAL listings here right now (not sales)? A rising rental-DOM trend means longer vacancies and softer asking-rent achievability than the comps imply.
- What's the recent tenant-quality profile in this submarket — average credit score on applications, eviction rate, late-payment / NSF rate, and stable-employment percentage? A property-management company in the area should have these aggregated.
- How much new for-sale + rental construction is in the pipeline within 1–3 miles? Heavy new supply typically softens prices + rents 12–24 months out; constrained supply supports both.
Investment metrics
- 1% rule
- 0.79% ✗
- Cap rate
- 6.36%
- Cash-on-cash
- 0.23%
- DSCR
- 1.01
- GRM
- 10.5
CMA / ARV
- ARV (median comp)
- $264,020
- List price
- $219,900
- Delta
- -16.71%
- Verdict
- UNDERPRICED
- Comps
- 20 within 1.0 mi
Show comp detail 1 sale within ~0.75 mi
| Address | Dist | Beds/Ba | Sqft | Sold | Price | $/sf | Match |
|---|---|---|---|---|---|---|---|
| 381 Sand Pine Dr | 0.74mi | 3/2.0 (+1) | 1,424 (-5%) | 19mo | $252,000 | $177 | 32 |
Match score weights: distance 35% · size 25% · config 20% · recency 20%. Top-matched comps best support the ARV.
Projected returns pro-forma
-0.89% appreciation · 3.0% rent growth · sell at horizon
- IRR
- -5.5%
- Equity multiple
- 0.76×
- Total profit
- $-14,752
- Equity at exit
- $54,267
- IRR
- 1.2%
- Equity multiple
- 1.11×
- Total profit
- $6,927
- Equity at exit
- $58,001
Cash invested: $61,572 (down + closing). Projections, not guarantees.
Landlord ↔ Tenant lean methodology
- Overall (STATE)
- 87 Strongly Landlord-Friendly
- State Florida
- 87 Strongly Landlord-Friendly · R+3
- County
- — inherits STATE
- City
- — inherits STATE
ZIP-level market 32343
- Home prices YoY
- -0.5%
- Active inventory
- 20
- Price-to-rent
- 10.5×
Monthly cashflow live
- Estimated rent
- $1,747 medium interval (Pro) →
- Mortgage (P&I)
- −$1,153
- Tax from tax record
- −$124 /mo · $1,483/yr
- Insurance
- −$92
- HOA
- −$0
- Vacancy / Maint / Mgmt
- −$367
- Net cashflow
- $12
Break-even live
Sensitivity live
| Price | -10% $136 | -5% $74 | +0% $12 | +5% $-50 | +10% $-113 |
|---|---|---|---|---|---|
| Rent | -10% $-126 | -5% $-57 | +0% $12 | +5% $81 | +10% $150 |
| Rate | -1.0pp $123 | -0.5pp $68 | base $12 | +0.5pp $-45 | +1.0pp $-103 |
UW: 25.0% down · 7.5% · 30yr · 1.5% tax · 5.0% vac · 8.0% maint · 8.0% mgmt
Financing live
Cash to close
- Down payment
- $54,975
- Closing costs
- $6,597
- Reserves months
- —
- Total cash needed
- —
Loan-product check · same deal, 3 products live
Conventional
25% down · 7.5% · 30yr
- Down + closing
- —
- Monthly P&I
- —
- Monthly cashflow
- —
- DSCR
- —
- Eligible?
- —
Personal DTI + credit; lowest rate.
DSCR
20% down · 8.5% · 30yr
- Down + closing
- —
- Monthly P&I
- —
- Monthly cashflow
- —
- DSCR
- —
- Eligible?
- —
No personal income docs; deal must DSCR.
Hard money
10% down · 12.0% · 12mo
- Down + closing
- —
- Monthly P&I
- —
- Monthly cashflow
- —
- DSCR
- —
- Eligible?
- —
Short-term bridge; refi at stabilization.
Listing history 24 events
-
2026-06-18days on market $219,900 Active 223 DOM
-
2026-06-17days on market $219,900 Active 222 DOM
-
2026-06-16days on market $219,900 Active 221 DOM
-
2026-06-15days on market $219,900 Active 220 DOM
-
2026-06-14days on market $219,900 Active 218 DOM
-
2026-06-13days on market $219,900 Active 217 DOM
-
2026-06-10days on market $219,900 Active 215 DOM
-
2026-06-09days on market $219,900 Active 214 DOM
-
2026-06-08days on market $219,900 Active 213 DOM
-
2026-06-07days on market $219,900 Active 212 DOM
-
2026-06-05days on market $219,900 Active 209 DOM
-
2026-06-03days on market $219,900 Active 208 DOM
-
2026-06-02days on market $219,900 Active 207 DOM
-
2026-06-01days on market $219,900 Active 206 DOM
-
2026-05-31days on market $219,900 Active 205 DOM
-
2026-05-30days on market $219,900 Active 204 DOM
-
2025-11-07$219,900 Active 238-char remark
Show marketing remark (238 chars)
Discover this beautifully updated 3-bedroom, 2-bath home tucked away in a serene and private setting in Midway, FL. Boasting a classic brick exterior, this home combines timeless appeal with modern upgrades, making it truly move-in ready.
-
2025-06-14historical
-
2024-12-31historical Contingent
-
2024-12-16$219,900 Active
-
2024-11-27soldstatus $90,000
-
2023-02-04historical
-
2023-01-31historical Active Under Contract
-
2022-10-30$65,000 Active
ⓘ Source: listings_history table (triggers on properties + properties_extension) + one-shot
backfill from property_details.listing_events for pre-trigger history.
Tax reassessment forecast FL · Resets to sale price
- Current annual tax
- $1,483 · $124/mo
- Projected year-2 tax
- $1,825 · $152/mo
- Expected delta
- +$342/yr (+$28/mo · 23.1%)
ⓘ Screening estimate from a state-policy table — verify with the county assessor before closing.
Climate risk First Street
- Flood 1/10 Low FEMA zone X (unshaded) · 0% chance over 30 yrs
- Wildfire 5/10 Major
- Heat 8/10 Severe 7 d/yr ≥108°F today · 21 d/yr by 30 yrs out
- Wind 9/10 Extreme 99% chance of damaging wind over 30 yrs
- Air quality 4/10 Moderate 5 unhealthy d/yr today · 7 by 30 yrs out
Nearby sold comps map
Loading sold comps map…
Walkable amenities ~0.75 mi
Loading nearby amenities…
Taxation est. · year 1
- Rental income
- $20,967
- − Mortgage interest
- −$12,318
- − Property taxes
- −$1,483
- − Insurance
- −$1,100
- − Repairs & maintenance
- −$1,677
- − Management
- −$1,677
- − Depreciation
- −$6,397
- Taxable loss
- −$3,686
- Est. tax savings @ 24.0%
- +$885
- After-tax cash flow
- $1,027/yr
For passive investors: Depreciation is non-cash, so a rental often shows a tax loss while cash-flowing — sheltering income. Rental losses are passive: they offset passive income freely, and up to $25,000/yr can offset ordinary (W-2) income if you actively participate and your MAGI is under $100k (phasing out to $0 by $150k); unused losses carry forward. On sale, claimed depreciation is recaptured at up to 25%, and gains may owe capital-gains tax (a 1031 exchange can defer both). Figures are a year-1 estimate at your 24.0% rate — not tax advice; consult a CPA.
Schools (NCES district)
- District
- Gadsden
- NCES district ID
- 1200600
- Math proficiency
- 31% ▼ -16.00%
- Reading proficiency
- 31% ▼ -7.00%
- Median HH income
- $36,470
- Composite
- 25.75/100
- National rank
- #7373
- State rank
- #70 of 73 in FL
Livability — Midway
No livability data for this city. (Only ~50 U.S. cities are tracked.)
Census & demographics
- Census place
- Midway, FL
- Population (ZIP)
- 3,583
Population outlook (Gadsden County) Hauer SSP2
- Today (2025)
- 42,956 people
- By 2030
- 40,878 · -4.8%
- By 2040
- 36,218 · -15.7%
- By 2050
- 31,502 · -26.7%
- By 2075
- 21,828 · -49.2%
- By 2100
- 14,480 · -66.3%
Race, ethnicity, and origin ACS 2023
- Neighborhood character
- Predominantly Black (89%)
- Race & ethnicity
- Black 89% Hispanic / Latino 7% Two or more races 4% White 3%
- Hispanic origin (detail)
- Mexican 1% Puerto Rican 5%
- Common ancestry
- Lithuanian 1%
- Foreign-born
- 1% · Canada
- Languages at home
- 95% English-only · Spanish 5%
Political lean MEDSL · Gadsden
- 2024 margin
- Solid D (+30.7) · D 65.0% · R 34.3%
- 2008→2024 swing
- -8.3pp toward R · 2008: 39.0pp · 2024: 30.7pp
- All cycles
- 2024: D+30.7 2020: D+36.6 2016: D+37.5 2012: D+40.6 2008: D+39.0
Not yet ingested
- Civics
- —
Market trends
- HPI YoY
- ▼ -0.89%
- Current HPI
- 167.7351
- Rent YoY
- —
- Metro
- —
- State GDP YoY
- ▲ 3.28%
- F500 in state
- 36
Industry mix (Fortune 500 HQ in FL)
| Industry | F500 HQs | Revenue |
|---|---|---|
| Industrial Technology | 2 | $29B |
|
||
| Insurance | 2 | $17B |
|
||
| Retail | 1 | $60B |
|
||
| Technology Distribution | 1 | $58B |
|
||
| Homebuilding | 1 | $35B |
|
||
| Technology Manufacturing | 1 | $35B |
|
||
Price history
+238.3% since first listed8 events — show timeline
- 2025-11-07 Listed $219,900 CATRS
- 2025-06-14 Listing Removed — CATRS
- 2024-12-31 Contingent — CATRS
- 2024-12-16 Listed $219,900 CATRS
- 2024-11-27 Sold (Public Records) $90,000 Public Records
- 2023-02-04 Listing Removed — CATRS
- 2023-01-31 Contingent — CATRS
- 2022-10-30 Listed $65,000 CATRS
Property tax history
+9.8%/yrLatest (2025): $1,483 · +30.7% YoY. Source: county tax records.
Cash-flow waterfall
monthlySold comps — $/sqft
last 12 mo · ≤1 miLoading sold comps…