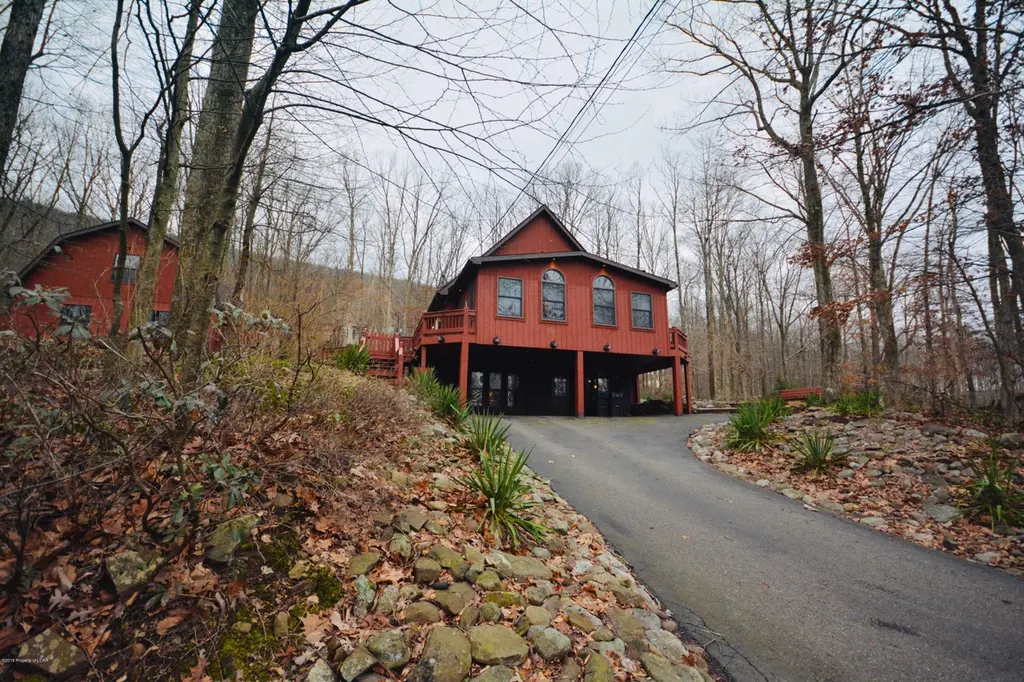
127 Grouse Ridge Ln · Beech Mountain Lakes, PA
Flood risk 1/10 · Minimal
- FEMA flood zone
- X (unshaded)
- Chance of flooding over 30 yrs
- 0.0%
- Est. flood insurance / yr
- $507 – $1,088
Fire risk 3/10 · Minor
- Est. fire insurance / yr
- $511 – $949
Heat risk 3/10 · Minor
- Hot days now (above 91°F)
- 7 days/yr
- Hot days in 30 yrs
- 17 days/yr
Wind risk 3/10 · Minor
- Chance of severe wind over 30 yrs
- 6.0%
Air-quality risk 2/10 · Minimal
- Unhealthy air days now
- 1 days/yr
- Unhealthy air days in 30 yrs
- 2 days/yr
Risk factors via First Street. Map © Google.
Why this score? — see what drove the C+ grade
The composite is a weighted blend of 9 inputs, each scored 0–100. Each bar is that input's sub-score; the figure is the points it added to the 100-point composite (weight × sub-score).
- Cash flow +15.2/30.0
- ARV discount +14.5/15.0
- Appreciation +10.0/10.0
- 1% rule +5.6/10.0
- DSCR +4.7/10.0
- Livability +3.6/5.0
- Rent growth +2.5/5.0
- Condition / age +2.5/5.0
- Schools +2.0/10.0
$199,999
🖨 Deal sheet (PDF) 📄 Offer letter ✓ Due diligence
Listing remarks
Christmas has come early for the outdoor-entertaining enthusiast! This unique Beech Mountain home boasts sprawling patios, multi-level outdoor entertainment spaces, and mature landscaping. The detached, heated, 2-story, garage holds untold hidden potential. Don't let your holiday plans cause you to miss the opportunity to preview these three floors of open living space!
Key facts
- 0.51 acre lot
- Garage
- Built 1991
Neighborhood map
What this means for you Summary
Snapshot
- This is a 3-bed/4.0-bath single-family listed at $200k.
Deal economics
- At list price, monthly cash flow is $70 ($835/yr) — positive.
- The deal already cash-flows at list — no discount required.
- Meets the 1% rule at list price ($2k rent vs $200k).
- Cap rate 6.7% vs local median 3.7% in Beech Mountain Lakes — top-decile yield for the area; either an underpriced asset or a hidden risk that comps aren't pricing in. Stress-test before assuming the spread holds.
Location & tenants
- Location reads 71/100 on livability (#698 in PA) — a middle-class / working-renter tenant base. Strengths: crime A+, employment A+, cost of living A+; Watch: amenities F, commute F, health & safety F.
- Hazleton Area SD (suburban): math 18% / reading 30% proficiency, ranked #476 of 539 in PA (top 88%) — low school quality limits family demand, transient renter base, plan for 1-2y turnover.
- Zoned schools: Drums El/Ms (math 17% / reading 53%, grade F, #1,042 of 1,518 statewide, top 69%, 784 students, 100% FRL); Hazleton Area Hs (math 53% / reading 8%, grade F, #347 of 437 statewide, top 79%, 3,795 students, 83% FRL) — zoned schools average 91% FRL vs 60% district-wide (32 pts higher); higher-poverty schools than district average — tighter screening recommended.
- Market conditions: 134 active listings in the ZIP; 349 units permitted in Luzerne County in 2024 (16 in 5+ unit buildings).
Forward outlook
- In year one you build about $21k of equity ($1k loan paydown + $20k appreciation (10.0% local appreciation)).
- Luzerne County population projected at +4% by 2050 — modest demand growth; plan on rents tracking national, not racing it.
- At projected returns (10.0% appreciation + 3.0% rent growth), your $56k cash investment doubles in ~3 years — after that, you're playing with house money.
- By year 2, paydown + projected appreciation supports a ~$34k cash-out refi (75% LTV) — recoverable capital for the next deal without selling this one.
Negotiation context
- Only 0 days on market — expect competitive offers; lowballing is unlikely to land.
Questions for the listing agent
- What does the HOA fee cover, when was the last increase, and are there any pending special assessments or reserve-fund shortfalls?
- Is there a deadline driving the sale (1031 exchange, divorce, estate, relocation)? That informs how much negotiation room exists.
- Schools are D-rated, which usually means shorter tenancies and higher turnover. Who's the typical renter profile here, and what's been the actual vacancy rate?
- What's the average days-on-market for RENTAL listings here right now (not sales)? A rising rental-DOM trend means longer vacancies and softer asking-rent achievability than the comps imply.
- What's the recent tenant-quality profile in this submarket — average credit score on applications, eviction rate, late-payment / NSF rate, and stable-employment percentage? A property-management company in the area should have these aggregated.
- How much new for-sale + rental construction is in the pipeline within 1–3 miles? Heavy new supply typically softens prices + rents 12–24 months out; constrained supply supports both.
Investment metrics
- 1% rule
- 1.06% ✓
- Cap rate
- 6.71%
- Cash-on-cash
- 1.49%
- DSCR
- 1.07
- GRM
- 7.9
CMA / ARV
- ARV (on-the-fly)
- $236,910
- Comps found
- 11
Show comp detail 11 sales within ~0.75 mi
| Address | Dist | Beds/Ba | Sqft | Sold | Price | $/sf | Match |
|---|---|---|---|---|---|---|---|
| 126 Buck Ridge Dr | 0.10mi | 3/2.0 | 1,606 (+8%) | 9mo | $259,000 | $161 | 67 |
| 40 Edge Rock Dr | 0.44mi | 3/2.0 | 1,540 (+3%) | 1mo | $245,000 | $159 | 65 |
| 106 Randy Ridge Ct | 0.57mi | 2/1.5 (-1) | 1,475 (-1%) | 2mo | $170,000 | $115 | 55 |
| 205 Snow Valley Dr | 0.48mi | 3/2.0 | 1,520 (+2%) | 16mo | $250,000 | $164 | 53 |
| 158 Buck Ridge Dr | 0.29mi | 3/1.0 | 1,388 (-7%) | 16mo | $217,000 | $156 | 49 |
| 154 Bear Run Dr | 0.49mi | 3/2.0 | 1,634 (+10%) | 11mo | $300,000 | $184 | 44 |
| 213 Shingle Mill Dr | 0.67mi | 3/2.0 | 1,310 (-12%) | 9mo | $256,000 | $195 | 33 |
| 17 Tommys Ct | 0.72mi | 3/1.5 | 1,701 (+14%) | 4mo | $195,000 | $115 | 29 |
| 241 Snow Valley Dr | 0.61mi | 3/2.0 | 1,700 (+14%) | 17mo | $260,000 | $153 | 26 |
| 226 Avalanche Ln | 0.72mi | 2/1.5 (-1) | 1,557 (+4%) | 22mo | $200,000 | $128 | 26 |
| 231 Snow Valley Dr | 0.57mi | 3/2.0 | 1,706 (+14%) | 21mo | $310,000 | $182 | 24 |
Match score weights: distance 35% · size 25% · config 20% · recency 20%. Top-matched comps best support the ARV.
Projected returns pro-forma
10.0% appreciation · 3.0% rent growth · sell at horizon
- IRR
- 25.4%
- Equity multiple
- 3.03×
- Total profit
- $113,527
- Equity at exit
- $180,175
- IRR
- 22.4%
- Equity multiple
- 6.91×
- Total profit
- $331,167
- Equity at exit
- $388,554
Cash invested: $56,000 (down + closing). Projections, not guarantees.
Landlord ↔ Tenant lean methodology
- Overall (STATE)
- 62 Landlord-Friendly
- State Pennsylvania
- 62 Landlord-Friendly · EVEN
- County
- — inherits STATE
- City
- — inherits STATE
ZIP-level market 18222
- Home prices YoY
- 10.2%
- Active inventory
- 134
- Price-to-rent
- 7.9×
Monthly cashflow live
- Estimated rent
- $2,118 medium interval (Pro) →
- Mortgage (P&I)
- −$1,049
- Tax from tax record
- −$319 /mo · $3,825/yr
- Insurance
- −$83
- HOA
- −$153
- Vacancy / Maint / Mgmt
- −$445
- Net cashflow
- $70
Break-even live
Sensitivity live
| Price | -10% $183 | -5% $126 | +0% $70 | +5% $13 | +10% $-44 |
|---|---|---|---|---|---|
| Rent | -10% $-98 | -5% $-14 | +0% $70 | +5% $153 | +10% $237 |
| Rate | -1.0pp $170 | -0.5pp $120 | base $70 | +0.5pp $18 | +1.0pp $-35 |
UW: 25.0% down · 7.5% · 30yr · 1.5% tax · 5.0% vac · 8.0% maint · 8.0% mgmt
Financing live
Cash to close
- Down payment
- $50,000
- Closing costs
- $6,000
- Reserves months
- —
- Total cash needed
- —
Loan-product check · same deal, 3 products live
Conventional
25% down · 7.5% · 30yr
- Down + closing
- —
- Monthly P&I
- —
- Monthly cashflow
- —
- DSCR
- —
- Eligible?
- —
Personal DTI + credit; lowest rate.
DSCR
20% down · 8.5% · 30yr
- Down + closing
- —
- Monthly P&I
- —
- Monthly cashflow
- —
- DSCR
- —
- Eligible?
- —
No personal income docs; deal must DSCR.
Hard money
10% down · 12.0% · 12mo
- Down + closing
- —
- Monthly P&I
- —
- Monthly cashflow
- —
- DSCR
- —
- Eligible?
- —
Short-term bridge; refi at stabilization.
HOA detail
- Monthly dues
- $153 · $1,836/yr
- Likely covers
- landscaping
Listing history 5 events
-
2023-08-29status Pending
-
2023-08-20historical
-
2020-02-27soldstatus $200,000
-
2019-12-30historical
-
2019-12-16$199,999
ⓘ Source: listings_history table (triggers on properties + properties_extension) + one-shot
backfill from property_details.listing_events for pre-trigger history.
Tax reassessment forecast PA · Partial reset (capped growth)
- Current annual tax
- $3,825 · $319/mo
- Projected year-2 tax
- $3,825 · $319/mo
- Expected delta
- $0/yr ($0/mo · 0.0%)
ⓘ Screening estimate from a state-policy table — verify with the county assessor before closing.
Climate risk First Street
- Flood 1/10 Low FEMA zone X (unshaded) · 0% chance over 30 yrs
- Wildfire 3/10 Moderate
- Heat 3/10 Moderate 7 d/yr ≥91°F today · 17 d/yr by 30 yrs out
- Wind 3/10 Moderate 6% chance of damaging wind over 30 yrs
- Air quality 2/10 Low 1 unhealthy d/yr today · 2 by 30 yrs out
Nearby sold comps map
Loading sold comps map…
Walkable amenities ~0.75 mi
Loading nearby amenities…
Taxation est. · year 1
- Rental income
- $25,421
- − Mortgage interest
- −$11,203
- − Property taxes
- −$3,825
- − Insurance
- −$1,000
- − Repairs & maintenance
- −$2,034
- − Management
- −$2,034
- − HOA
- −$1,836
- − Depreciation
- −$5,818
- Taxable loss
- −$2,329
- Est. tax savings @ 24.0%
- +$559
- After-tax cash flow
- $1,394/yr
For passive investors: Depreciation is non-cash, so a rental often shows a tax loss while cash-flowing — sheltering income. Rental losses are passive: they offset passive income freely, and up to $25,000/yr can offset ordinary (W-2) income if you actively participate and your MAGI is under $100k (phasing out to $0 by $150k); unused losses carry forward. On sale, claimed depreciation is recaptured at up to 25%, and gains may owe capital-gains tax (a 1031 exchange can defer both). Figures are a year-1 estimate at your 24.0% rate — not tax advice; consult a CPA.
Schools (NCES district)
- District
- Hazleton Area SD
- NCES district ID
- 4211700
- Math proficiency
- 18% ▼ -3.00%
- Reading proficiency
- 30% ▼ -15.00%
- Median HH income
- $42,247
- Composite
- 20.44/100
- National rank
- #8582
- State rank
- #476 of 539 in PA
Livability — Beech Mountain Lakes
- Score
- 71/100
- State rank
- #698
- US rank
- #6837
Category grades
Schools grade is shown separately in the Schools card above.
Census & demographics
- Census place
- Beech Mountain Lakes, PA
- Population (ZIP)
- 9,946
Population outlook (Luzerne County) Hauer SSP2
- Today (2025)
- 319,505 people
- By 2030
- 319,943 · +0.1%
- By 2040
- 322,643 · +1.0%
- By 2050
- 330,817 · +3.5%
- By 2075
- 379,145 · +18.7%
- By 2100
- 431,908 · +35.2%
Race, ethnicity, and origin ACS 2023
- Neighborhood character
- Predominantly White (86%)
- Race & ethnicity
- White 86% Hispanic / Latino 7% Two or more races 7% Black 2%
- Hispanic origin (detail)
- Puerto Rican 2% Dominican 4%
- Common ancestry
- Romanian 10% Scotch-Irish 2% Iranian 2%
- Foreign-born
- 2% · Canada
- Languages at home
- 94% English-only · Spanish 3% Other Indo-European 1% Arabic 1%
Political lean MEDSL · Luzerne
- 2024 margin
- R (+19.2) · D 40.0% · R 59.2%
- 2008→2024 swing
- -27.6pp toward R · 2008: 8.4pp · 2024: -19.2pp
- All cycles
- 2024: R+19.2 2020: R+14.4 2016: R+19.6 2012: D+4.8 2008: D+8.4
Not yet ingested
- Civics
- —
Market trends
- HPI YoY
- ▲ 28.01%
- Current HPI
- 302.4923
- Rent YoY
- —
- Metro
- —
- State GDP YoY
- ▲ 1.68%
- F500 in state
- 34
Industry mix (Fortune 500 HQ in PA)
| Industry | F500 HQs | Revenue |
|---|---|---|
| Healthcare | 2 | $309B |
|
||
| Insurance | 2 | $27B |
|
||
| Telecommunications / Media | 1 | $124B |
|
||
| Industrial Distribution | 1 | $22B |
|
||
| Financial Services | 1 | $20B |
|
||
| Chemicals / Materials | 1 | $18B |
|
||
Price history
+0.0% since first listed5 events — show timeline
- 2023-08-29 Pending — LCAR
- 2023-08-20 Delisted — LCAR
- 2020-02-27 Sold (Public Records) $200,000 Public Records
- 2019-12-30 Delisted — LCAR
- 2019-12-16 Listed $199,999 LCAR
Property tax history
+2.6%/yrLatest (2026): $3,825 · +4.6% YoY. Source: county tax records.
Cash-flow waterfall
monthlySold comps — $/sqft
last 12 mo · ≤1 miLoading sold comps…