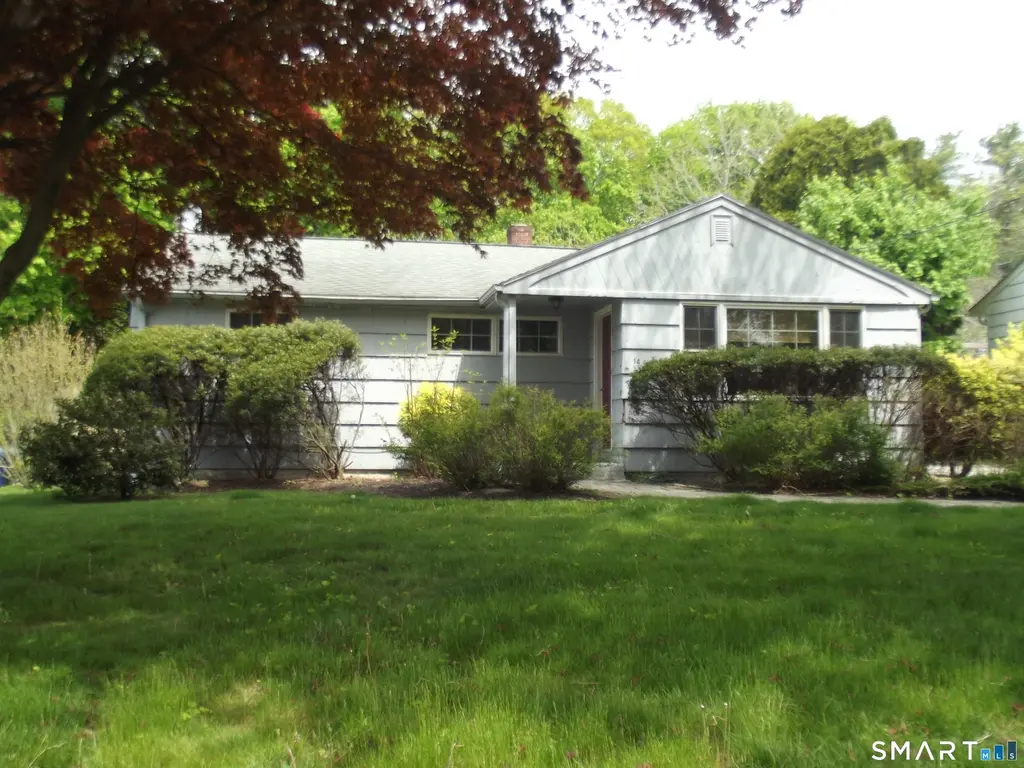
14 Overlook Ave · Mystic, CT
Flood risk No data
- FEMA flood zone
- —
- Chance of flooding over 30 yrs
- —
- Est. flood insurance / yr
- —
Fire risk No data
- Est. fire insurance / yr
- —
Heat risk No data
- Hot days now (above threshold)
- —
- Hot days in 30 yrs
- —
Wind risk No data
- Chance of severe wind over 30 yrs
- —
Air-quality risk No data
- Unhealthy air days now
- —
- Unhealthy air days in 30 yrs
- —
Risk factors via First Street. Map © Google.
Why this score? — see what drove the F grade
The composite is a weighted blend of 9 inputs, each scored 0–100. Each bar is that input's sub-score; the figure is the points it added to the 100-point composite (weight × sub-score).
- ARV discount +7.5/15.0
- Cash flow +5.2/30.0
- Livability +4.1/5.0
- Schools +3.6/10.0
- Rent growth +2.5/5.0
- Condition / age +2.5/5.0
- 1% rule +0.2/10.0
- DSCR +0.0/10.0
- Appreciation +0.0/10.0
$455,000
🖨 Deal sheet 📄 Offer letter ✓ Due diligence
Listing remarks MLS
Charming 3 br ranch. Walk to downtown.Large family/recreation room, hardwood floors, private rear yard. Open, bright kitchen, sliding door to patio, skylight in bath. Exterior recently painted. Move in condition. Call duane simonds.
Key facts
- Custom kitchen
- California closet
- Walk to dinner
Tags
Property features AI
Exterior
- Utilities: Public water connected; Public sewer connected; Fuel tank located in basement
- Home design: Single-family home
- Construction: Frame construction; Concrete foundation; Asphalt shingle roof; Shake siding
- Exterior features: Level lot; Walk to water
Interior
- Kitchen: Electric range; Microwave; Refrigerator; Dishwasher
- Bedrooms: 2 bedrooms
- Bathrooms: 2 full bathrooms
- Heating & cooling: Heat pump; Split system; Wall unit; Baseboard heat; Electric and oil fuel options; Thermopane windows (energy efficient)
- Interior features: Cable pre-wired; Full basement; Has attic with pull-down stairs; Workshop
- Laundry & utility: Laundry room on lower level (room of its own); Washer; Electric dryer; 50-gallon domestic oil hot water tank
Neighborhood map
What this means for you Summary
Snapshot
- This is a 2-bed/2.0-bath single-family listed at $455k.
Deal economics
- At list price, monthly cash flow is $-1k ($-12k/yr) — negative.
- To cash-flow at today's rent, offer at most $274k (39.7% below list).
- To meet the 1% rule (rent ≥ 1% of price), the offer needs to be $237k (48.0% below list).
- Recommended offer: $237k (48.0% below list) — sets the bar for 1% rule.
- Cap rate 3.6% vs local median 2.0% in Mystic — top-decile yield for the area; either an underpriced asset or a hidden risk that comps aren't pricing in. Stress-test before assuming the spread holds.
Location & tenants
- Location reads 82/100 on livability (#11 in CT, #1,266 nationally) — a professional / high-income tenant draw. Strengths: crime A+, employment A+, housing A+; Watch: commute F, cost of living F.
- Groton School District (suburban): math 32% / reading 50% proficiency, ranked #96 of 153 in CT (top 63%) — families likely to look elsewhere, expect single-tenant / working-renter base with shorter leases.
- Market conditions: 84 active listings in the ZIP; 8 comparable units currently listed for rent nearby; rentals at typical pace (median 21d on market — plan ~3-4 weeks tenant-placement turnaround); high-income renter base; 487 units permitted in Southeastern Connecticut Planning Region in 2024 (244 in 5+ unit buildings).
Forward outlook
- Local home prices are declining (-3.0%/yr); year-one equity from $3k of loan paydown is wiped out by about $14k of value loss. Plan a longer hold.
Negotiation context
- Only 7 days on market — expect competitive offers; lowballing is unlikely to land.
- 2 sale attempts since 28y ago with the ask held roughly flat each time — persistent listings suggest the price (not the market) is what's stuck; bring a comps-based counter.
- Current owner paid $266k; list at $455k implies a 71% gain — meaningful room to come down on a strong offer.
Risks & watch-outs
- Watch-outs: built in 1955 — expect roof / HVAC / electrical / plumbing capex.
Questions for the listing agent
- What do current leases actually rent for vs. the listed asking? Can we see a recent rent roll and the last 12 months of T-12 income?
- Built in 1955 — when were the roof, HVAC, electrical panel, plumbing, and water heater last replaced?
- Is there a deadline driving the sale (1031 exchange, divorce, estate, relocation)? That informs how much negotiation room exists.
- Schools are A-rated — typically a magnet for longer-tenancy family renters. What's the average tenant stay here, and is there a school-zone premium baked into asking?
- The area grade is low — what's the realistic commute time and amenity access for the typical tenant pool here? Any planned neighborhood developments (good or bad) we should know about?
- What's the average days-on-market for RENTAL listings here right now (not sales)? A rising rental-DOM trend means longer vacancies and softer asking-rent achievability than the comps imply.
- What's the recent tenant-quality profile in this submarket — average credit score on applications, eviction rate, late-payment / NSF rate, and stable-employment percentage? A property-management company in the area should have these aggregated.
- How much new for-sale + rental construction is in the pipeline within 1–3 miles? Heavy new supply typically softens prices + rents 12–24 months out; constrained supply supports both.
Investment metrics
- 1% rule
- 0.52% ✗
- Cap rate
- 3.59%
- Cash-on-cash
- -9.64%
- DSCR
- 0.57
- GRM
- 16.0
CMA / ARV
No comps found within radius.
Projected returns pro-forma
-3.0% appreciation · 3.0% rent growth · sell at horizon
- IRR
- -33.6%
- Equity multiple
- -0.09×
- Total profit
- $-139,025
- Equity at exit
- $67,842
- IRR
- -41.8%
- Equity multiple
- -0.61×
- Total profit
- $-205,468
- Equity at exit
- $39,340
Cash invested: $127,400 (down + closing). Projections, not guarantees.
Landlord ↔ Tenant lean methodology
- Overall (STATE)
- 27 Tenant-Leaning
- State Connecticut
- 27 Tenant-Leaning · D+7
- County
- — inherits STATE
- City
- — inherits STATE
ZIP-level market 06355
- Home prices YoY
- -17.8%
- Active inventory
- 84
- Price-to-rent
- 16.0×
Monthly cashflow live
- Estimated rent
- $2,367 high interval (Pro) →
- Mortgage (P&I)
- −$2,386
- Tax from tax record
- −$318 /mo · $3,816/yr
- Insurance
- −$190
- HOA
- −$0
- Vacancy / Maint / Mgmt
- −$497
- Net cashflow
- $-1,023
Break-even live
UW: 25.0% down · 7.5% · 30yr · 1.5% tax · 5.0% vac · 8.0% maint · 8.0% mgmt
Financing live
Cash to close
- Down payment
- $113,750
- Closing costs
- $13,650
- Reserves months
- —
- Total cash needed
- —
Loan-product check · same deal, 3 products live
Conventional
25% down · 7.5% · 30yr
- Down + closing
- —
- Monthly P&I
- —
- Monthly cashflow
- —
- DSCR
- —
- Eligible?
- —
Personal DTI + credit; lowest rate.
DSCR
20% down · 8.5% · 30yr
- Down + closing
- —
- Monthly P&I
- —
- Monthly cashflow
- —
- DSCR
- —
- Eligible?
- —
No personal income docs; deal must DSCR.
Hard money
10% down · 12.0% · 12mo
- Down + closing
- —
- Monthly P&I
- —
- Monthly cashflow
- —
- DSCR
- —
- Eligible?
- —
Short-term bridge; refi at stabilization.
Rent comps 8 comps
| Address | Beds | Baths | Sqft | Rent | $/sqft | DOM | Units | Dist |
|---|---|---|---|---|---|---|---|---|
| 12 Water St Mystic, CT | 1.0–2.0 | 1.0–2.0 | 912 | $2,800 | $3.07 | 13d | 3 | 0.62mi |
| 12 Water St Unit 311 Mystic, CT | 1.0 | 1.0 | 750 | $2,500 | $3.33 | 13d | 1 | 0.62mi |
| 12 Water St Unit 408 Mystic, CT | 2.0 | 1.0 | 1075 | $2,800 | $2.60 | 21d | 1 | 0.63mi |
| 45 W Main St Unit 2 Mystic, CT | 2.0 | 1.0 | 900 | $2,295 | $2.55 | 13d | 1 | 0.71mi |
| 75 Steamboat Wharf Bldg Res-38 Mystic, CT | 1.0 | 1.0 | 775 | $1,890 | $2.44 | 13d | 1 | 0.76mi |
| 212 Cedar Rd Mystic, CT | 2.0 | 1.0 | 660 | $2,000 | $3.03 | 21d | 1 | 1.10mi |
| 6 School St #20 Mystic, CT | 1.0 | 1.5 | 706 | $2,600 | $3.68 | 21d | 1 | 1.12mi |
| 2 Lincoln Ave Apt 3 Mystic, CT | 2.0 | 1.0 | 900 | $1,875 | $2.08 | 21d | 1 | 1.13mi |
Listing history 4 events
-
2026-05-18$455,000 Active
-
2004-10-21soldstatus $266,500
-
1998-06-30soldstatus $130,000 232-char remark
Show marketing remark (232 chars)
Charming 3 br ranch. Walk to downtown.Large family/recreation room, hardwood floors, private rear yard. Open, bright kitchen, sliding door to patio, skylight in bath. Exterior recently painted. Move in condition. Call duane simonds.
-
1998-03-02$138,500 232-char remark
Show marketing remark (232 chars)
Charming 3 br ranch. Walk to downtown.Large family/recreation room, hardwood floors, private rear yard. Open, bright kitchen, sliding door to patio, skylight in bath. Exterior recently painted. Move in condition. Call duane simonds.
ⓘ Source: listings_history table (triggers on properties + properties_extension) + one-shot
backfill from property_details.listing_events for pre-trigger history.
Tax reassessment forecast CT · Partial reset (capped growth)
- Current annual tax
- $3,816 · $318/mo
- Projected year-2 tax
- $6,776 · $565/mo
- Expected delta
- +$2,960/yr (+$247/mo · 77.6%)
ⓘ Screening estimate from a state-policy table — verify with the county assessor before closing.
Nearby sold comps map
Loading sold comps map…
Walkable amenities ~0.75 mi
Loading nearby amenities…
Taxation est. · year 1
- Rental income
- $28,410
- − Mortgage interest
- −$25,487
- − Property taxes
- −$3,816
- − Insurance
- −$2,275
- − Repairs & maintenance
- −$2,273
- − Management
- −$2,273
- − Depreciation
- −$13,236
- Taxable loss
- −$20,950
- Est. tax savings @ 24.0%
- +$5,028
- After-tax cash flow
- $-7,252/yr
For passive investors: Depreciation is non-cash, so a rental often shows a tax loss while cash-flowing — sheltering income. Rental losses are passive: they offset passive income freely, and up to $25,000/yr can offset ordinary (W-2) income if you actively participate and your MAGI is under $100k (phasing out to $0 by $150k); unused losses carry forward. On sale, claimed depreciation is recaptured at up to 25%, and gains may owe capital-gains tax (a 1031 exchange can defer both). Figures are a year-1 estimate at your 24.0% rate — not tax advice; consult a CPA.
Schools (NCES district)
- District
- Groton School District
- NCES district ID
- 0901770
- Math proficiency
- 32% ▼ -16.00%
- Reading proficiency
- 50% ▼ -10.00%
- Median HH income
- $60,709
- Composite
- 36.28/100
- National rank
- #4702
- State rank
- #96 of 153 in CT
Livability — Mystic
- Score
- 82/100
- State rank
- #11
- US rank
- #1266
Category grades
Schools grade is shown separately in the Schools card above.
Census & demographics
- County
- New London County · 147,197 people
- Metro
- Norwich-New London, CT
- Population (ZIP)
- 12,173
- Household income
- $137,425
- Rent vs Own
- Severe rent burden
- 197.0
Population outlook (Southeastern Connecticut County) Hauer SSP2
- By 2040
- 293,442
Race, ethnicity, and origin ACS 2023
- Neighborhood character
- Predominantly White (83%)
- Race & ethnicity
- White 83% Two or more races 9% Asian 4% Hispanic / Latino 2% Black 2%
- Common ancestry
- Lithuanian 6% Romanian 6% Slovak 5%
- Foreign-born
- 7% · Canada, China
- Languages at home
- 94% English-only · Other Indo-European 2% Spanish 1% French/Haitian/Cajun 1%
Political lean MEDSL · Southeastern Connecticut
- 2024 margin
- D (+13.0) · D 55.6% · R 42.6% · Other 1.8%
- All cycles
- 2024: D+13.0
Not yet ingested
- Civics
- —
Market trends
- HPI YoY
- ▼ -62.46%
- Current HPI
- 287.7568
- Rent YoY
- —
- Metro
- Norwich-New London, CT
- State GDP YoY
- ▲ 1.06%
- F500 in state
- 38
Industry mix (Fortune 500 HQ in CT)
| Industry | F500 HQs | Revenue |
|---|---|---|
| Industrial Machinery | 4 | $38B |
|
||
| Insurance | 3 | $71B |
|
||
| Financial Services | 2 | $25B |
|
||
| Transportation / Logistics | 2 | $18B |
|
||
| Healthcare | 1 | $247B |
|
||
| Telecommunications | 1 | $55B |
|
||
Price history
+228.5% since first listed4 events — show timeline
- 2026-05-18 Listed $455,000 Smart MLS
- 2004-10-21 Sold (Public Records) $266,500 Public Records
- 1998-06-30 Sold (MLS) $130,000 Smart MLS
- 1998-03-02 Listed $138,500 Smart MLS
Property tax history
+0.3%/yrLatest (2022): $3,816 · -12.6% YoY. Source: county tax records.
Cash-flow waterfall
monthlySold comps — $/sqft
last 12 mo · ≤1 miLoading sold comps…