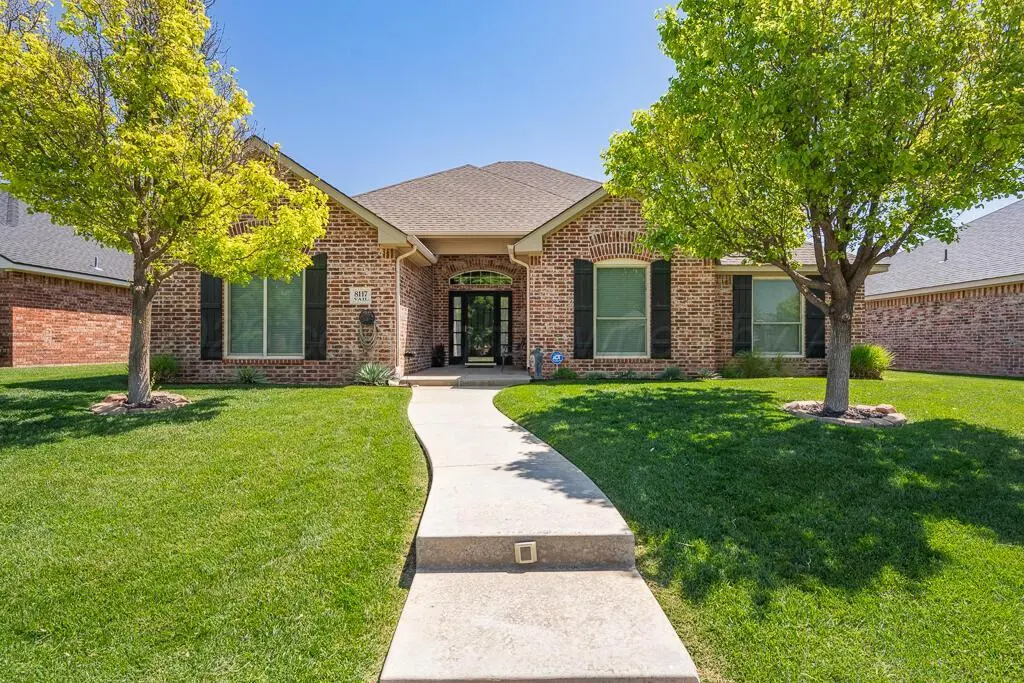
8117 Vail Dr · Amarillo, TX
Flood risk 1/10 · Minimal
- FEMA flood zone
- X (unshaded)
- Chance of flooding over 30 yrs
- 0.0%
- Est. flood insurance / yr
- $507 – $1,088
Fire risk 9/10 · Severe
- Est. fire insurance / yr
- $1,222 – $2,270
Heat risk 4/10 · Minor
- Hot days now (above 97°F)
- 7 days/yr
- Hot days in 30 yrs
- 20 days/yr
Wind risk 2/10 · Minimal
- Chance of severe wind over 30 yrs
- —
Air-quality risk 2/10 · Minimal
- Unhealthy air days now
- 2 days/yr
- Unhealthy air days in 30 yrs
- 2 days/yr
Risk factors via First Street. Map © Google.
Why this score? — see what drove the D- grade
The composite is a weighted blend of 9 inputs, each scored 0–100. Each bar is that input's sub-score; the figure is the points it added to the 100-point composite (weight × sub-score).
- Cash flow +10.6/30.0
- ARV discount +7.5/15.0
- Schools +5.0/10.0
- Rent growth +3.9/5.0
- 1% rule +3.4/10.0
- Livability +3.3/5.0
- DSCR +3.1/10.0
- Condition / age +2.5/5.0
- Appreciation +0.0/10.0
$307,000
🖨 Deal sheet 📄 Offer letter ✓ Due diligence
Listing remarks
Immaculate property in City View. Three bedrooms and two bath home that is ready for a new owner. Large kitchen open to the living area that has a fireplace and a view of the backyard. There is a beautiful covered patio that looks out to the east backyard. Plantation shutters in the living area, replacement windows were installed in 2023. Tile flooring, granite and countertops have all been updated. Beautiful pergola in the back yard.
Key facts
- View of the backyard
- Large kitchen
- Covered patio
Tags
Property features AI
Exterior
- Parking: Attached 2-car garage with rear-facing garage and automatic opener
- Utilities: Public water; Public sewer
- Home design: Single-family residence; One-level home; Faces west
- Construction: Brick / brick veneer exterior; Slab foundation; Built with composition roofing
- Exterior features: Wood fencing; Composition roof; No other structures noted; Lot approximately 0.17 acres
Interior
- Kitchen: Range; Dishwasher; Microwave
- Bathrooms: 2 full bathrooms
- Heating & cooling: Central heating (natural gas); Central air conditioning; Ceiling fans
- Interior features: Fireplace in the living room; Range, Dishwasher, Microwave
Neighborhood map
What this means for you Summary
Snapshot
- This is a 3-bed/2.0-bath single-family listed at $307k.
Deal economics
- At list price, monthly cash flow is $-150 ($-2k/yr) — negative.
- To cash-flow at today's rent, offer at most $281k (8.6% below list).
- To meet the 1% rule (rent ≥ 1% of price), the offer needs to be $259k (15.7% below list).
- Recommended offer: $259k (15.7% below list) — sets the bar for 1% rule.
Location & tenants
- Location reads 66/100 on livability (#624 in TX) — a middle-class / working-renter tenant base. Strengths: cost of living A+, housing A+; Watch: amenities C-, crime F, commute F.
- Canyon ISD (town): math 60% / reading 54% proficiency, ranked #78 of 826 in TX (top 9%) — acceptable for families but not a draw, mixed tenant base, ~2y average lease.
- Zoned schools: City View El (math 43% / reading 39%, grade F, #1,462 of 4,322 statewide, top 34%, 628 students, 44% FRL); West Plains J H (math 59% / reading 58%, grade B, #185 of 1,662 statewide, top 12%, 615 students, 33% FRL); West Plains H S (910 students, 31% FRL).
- Market conditions: Rents rising fast (+5.5%/yr); 276 active listings in the ZIP; 4 comparable units currently listed for rent nearby; rentals at typical pace (median 21d on market — plan ~3-4 weeks tenant-placement turnaround); solid renter incomes; 45 units permitted in Randall County in 2024 (0 in 5+ unit buildings).
- This rent runs 35% of the median local income ($88k/yr) — at the standard rent-burdened threshold; future hikes will face affordability resistance.
Forward outlook
- Local home prices are declining (-3.0%/yr); year-one equity from $2k of loan paydown is wiped out by about $9k of value loss. Plan a longer hold.
- Randall County population projected at +36% by 2050 — long-run rental-demand tailwind backs the buy-and-hold thesis.
Negotiation context
- It's been on market 28 days — a 2% lower offer ($302k) is reasonable based on typical stale-listing flexibility.
Risks & watch-outs
- Climate carrying-cost: severe wildfire risk — expect insurance premiums to compound above CPI over the hold.
Questions for the listing agent
- What do current leases actually rent for vs. the listed asking? Can we see a recent rent roll and the last 12 months of T-12 income?
- Is there a deadline driving the sale (1031 exchange, divorce, estate, relocation)? That informs how much negotiation room exists.
- Schools are D-rated, which usually means shorter tenancies and higher turnover. Who's the typical renter profile here, and what's been the actual vacancy rate?
- Crime grade is F in this area — have there been break-ins, vandalism, or insurance claims at this property in the last 3 years? What carrier currently insures it and at what premium?
- The area grade is low — what's the realistic commute time and amenity access for the typical tenant pool here? Any planned neighborhood developments (good or bad) we should know about?
- What's the average days-on-market for RENTAL listings here right now (not sales)? A rising rental-DOM trend means longer vacancies and softer asking-rent achievability than the comps imply.
- What's the recent tenant-quality profile in this submarket — average credit score on applications, eviction rate, late-payment / NSF rate, and stable-employment percentage? A property-management company in the area should have these aggregated.
- How much new for-sale + rental construction is in the pipeline within 1–3 miles? Heavy new supply typically softens prices + rents 12–24 months out; constrained supply supports both.
Investment metrics
- 1% rule
- 0.84% ✗
- Cap rate
- 5.71%
- Cash-on-cash
- -2.09%
- DSCR
- 0.91
- GRM
- 9.9
CMA / ARV
No comps found within radius.
Projected returns pro-forma
-3.0% appreciation · 5.52% rent growth · sell at horizon
- IRR
- -16.9%
- Equity multiple
- 0.39×
- Total profit
- $-52,479
- Equity at exit
- $45,775
- IRR
- -4.5%
- Equity multiple
- 0.67×
- Total profit
- $-28,585
- Equity at exit
- $26,544
Cash invested: $85,960 (down + closing). Projections, not guarantees.
Landlord ↔ Tenant lean methodology
- Overall (STATE)
- 87 Strongly Landlord-Friendly
- State Texas
- 87 Strongly Landlord-Friendly · R+5
- County
- — inherits STATE
- City
- — inherits STATE
ZIP-level market 79118
- Rents YoY
- 5.5%
- Active inventory
- 276
- Price-to-rent
- 9.9×
Monthly cashflow live
- Estimated rent
- $2,587 medium interval (Pro) →
- Mortgage (P&I)
- −$1,610
- Tax from tax record
- −$456 /mo · $5,469/yr
- Insurance
- −$128
- HOA
- −$0
- Vacancy / Maint / Mgmt
- −$543
- Net cashflow
- $-150
Break-even live
UW: 25.0% down · 7.5% · 30yr · 1.5% tax · 5.0% vac · 8.0% maint · 8.0% mgmt
Financing live
Cash to close
- Down payment
- $76,750
- Closing costs
- $9,210
- Reserves months
- —
- Total cash needed
- —
Loan-product check · same deal, 3 products live
Conventional
25% down · 7.5% · 30yr
- Down + closing
- —
- Monthly P&I
- —
- Monthly cashflow
- —
- DSCR
- —
- Eligible?
- —
Personal DTI + credit; lowest rate.
DSCR
20% down · 8.5% · 30yr
- Down + closing
- —
- Monthly P&I
- —
- Monthly cashflow
- —
- DSCR
- —
- Eligible?
- —
No personal income docs; deal must DSCR.
Hard money
10% down · 12.0% · 12mo
- Down + closing
- —
- Monthly P&I
- —
- Monthly cashflow
- —
- DSCR
- —
- Eligible?
- —
Short-term bridge; refi at stabilization.
Rent comps 4 comps
| Address | Beds | Baths | Sqft | Rent | $/sqft | DOM | Units | Dist |
|---|---|---|---|---|---|---|---|---|
| 8401 San Antonio Dr Amarillo, TX | 3.0 | 2.0 | 2003 | $2,895 | $1.45 | 21d | 1 | 0.26mi |
| 7303 Rochester Amarillo, TX | 4.0 | 2.0 | 1965 | $2,500 | $1.27 | 43d | 1 | 0.84mi |
| 7207 Mercury Trl Amarillo, TX | 3.0 | 2.0 | 1663 | $2,350 | $1.41 | 21d | 1 | 1.38mi |
| 6904 Mercury Trl Amarillo, TX | 3.0 | 2.0 | 1480 | $2,100 | $1.42 | 21d | 1 | 1.49mi |
Listing history 19 events
-
2026-06-18days on market $307,000 Active 28 DOM
-
2026-06-17days on market $307,000 Active 27 DOM
-
2026-06-16days on market $307,000 Active 26 DOM
-
2026-06-15days on market $307,000 Active 25 DOM
-
2026-06-14days on market $307,000 Active 23 DOM
-
2026-06-13days on market $307,000 Active 22 DOM
-
2026-06-10days on market $307,000 Active 20 DOM
-
2026-06-09days on market $307,000 Active 19 DOM
-
2026-06-08days on market $307,000 Active 18 DOM
-
2026-06-07days on market $307,000 Active 17 DOM
-
2026-06-05days on market $307,000 Active 14 DOM
-
2026-06-03days on market $307,000 Active 13 DOM
-
2026-06-02days on market $307,000 Active 12 DOM
-
2026-06-01days on market $307,000 Active 11 DOM
-
2026-05-31days on market $307,000 Active 10 DOM
-
2026-05-30days on market $307,000 Active 9 DOM
-
2026-05-21$307,000 Active
-
2013-05-06soldstatus
-
2005-09-06soldstatus
ⓘ Source: listings_history table (triggers on properties + properties_extension) + one-shot
backfill from property_details.listing_events for pre-trigger history.
Tax reassessment forecast TX · Resets to sale price
- Current annual tax
- $5,469 · $456/mo
- Projected year-2 tax
- $5,618 · $468/mo
- Expected delta
- +$149/yr (+$12/mo · 2.7%)
ⓘ Screening estimate from a state-policy table — verify with the county assessor before closing.
Climate risk First Street
- Flood 1/10 Low FEMA zone X (unshaded) · 0% chance over 30 yrs
- Wildfire 9/10 Extreme
- Heat 4/10 Moderate 7 d/yr ≥97°F today · 20 d/yr by 30 yrs out
- Wind 2/10 Low
- Air quality 2/10 Low 2 unhealthy d/yr today · 2 by 30 yrs out
Nearby sold comps map
Loading sold comps map…
Walkable amenities ~0.75 mi
Loading nearby amenities…
Taxation est. · year 1
- Rental income
- $31,045
- − Mortgage interest
- −$17,197
- − Property taxes
- −$5,469
- − Insurance
- −$1,535
- − Repairs & maintenance
- −$2,484
- − Management
- −$2,484
- − Depreciation
- −$8,931
- Taxable loss
- −$7,053
- Est. tax savings @ 24.0%
- +$1,693
- After-tax cash flow
- $-105/yr
For passive investors: Depreciation is non-cash, so a rental often shows a tax loss while cash-flowing — sheltering income. Rental losses are passive: they offset passive income freely, and up to $25,000/yr can offset ordinary (W-2) income if you actively participate and your MAGI is under $100k (phasing out to $0 by $150k); unused losses carry forward. On sale, claimed depreciation is recaptured at up to 25%, and gains may owe capital-gains tax (a 1031 exchange can defer both). Figures are a year-1 estimate at your 24.0% rate — not tax advice; consult a CPA.
Schools (NCES district)
- District
- Canyon ISD
- NCES district ID
- 4812810
- Math proficiency
- 60% ▼ -1.00%
- Reading proficiency
- 54% ▼ -1.00%
- Median HH income
- $65,177
- Composite
- 50.07/100
- National rank
- #1912
- State rank
- #78 of 826 in TX
Livability — Amarillo
- Score
- 66/100
- State rank
- #624
- US rank
- #11876
Category grades
Schools grade is shown separately in the Schools card above.
Census & demographics
- Census place
- Amarillo, TX
- County
- Randall County · 137,351 people
- City population
- 185,802
- Metro
- Amarillo, TX
- Population (ZIP)
- 28,107
- Household income
- $87,810
- Rent vs Own
- Severe rent burden
- 367.0
Population outlook (Randall County) Hauer SSP2
- Today (2025)
- 152,140 people
- By 2030
- 163,107 · +7.2%
- By 2040
- 184,999 · +21.6%
- By 2050
- 206,948 · +36.0%
- By 2075
- 260,204 · +71.0%
- By 2100
- 294,980 · +93.9%
Race, ethnicity, and origin ACS 2023
- Neighborhood character
- Majority White (57%)
- Race & ethnicity
- White 57% Hispanic / Latino 35% Two or more races 18% Black 2% Asian 2% Native American 1%
- Hispanic origin (detail)
- Mexican 31%
- Common ancestry
- Lithuanian 2% Italian 2% Slovak 2%
- Foreign-born
- 6% · Canada, Vietnam
- Languages at home
- 84% English-only · Spanish 14% Vietnamese 1% French/Haitian/Cajun 1%
Political lean MEDSL · Randall
- 2024 margin
- Solid R (+60.4) · D 19.4% · R 79.8%
- 2008→2024 swing
- +2.3pp toward D · 2008: -62.7pp · 2024: -60.4pp
- All cycles
- 2024: R+60.4 2020: R+58.8 2016: R+65.1 2012: R+68.2 2008: R+62.7
Not yet ingested
- Civics
- —
Market trends
- HPI YoY
- ▼ -111.59%
- Current HPI
- 162.5206
- Rent YoY
- ▲ 5.52%
- Metro
- Amarillo, TX
- State GDP YoY
- ▲ 3.95%
- F500 in state
- 110
Industry mix (Fortune 500 HQ in TX)
| Industry | F500 HQs | Revenue |
|---|---|---|
| Energy | 16 | $1,198B |
|
||
| Technology | 5 | $198B |
|
||
| Engineering / Construction | 4 | $72B |
|
||
| Energy Services | 3 | $60B |
|
||
| Utilities | 3 | $41B |
|
||
| Healthcare | 2 | $330B |
|
||
Price history
3 events — show timeline
- 2026-05-21 Listed $307,000 AARMLS
- 2013-05-06 Sold (Public Records) — Public Records
- 2005-09-06 Sold (Public Records) — Public Records
Property tax history
+3.4%/yrLatest (2025): $5,469 · +4.5% YoY. Source: county tax records.
Cash-flow waterfall
monthlySold comps — $/sqft
last 12 mo · ≤1 miLoading sold comps…