 Fourplex
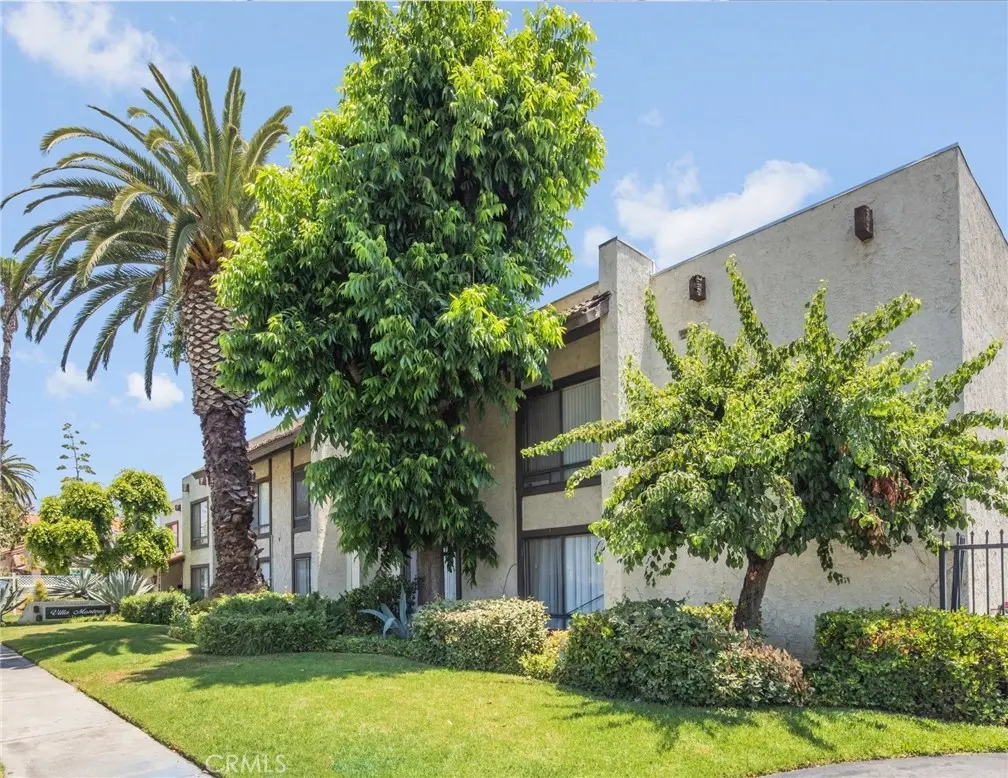
3108 Vineland · Baldwin Park, CA
Flood risk 1/10 · Minimal
- FEMA flood zone
- X (unshaded)
- Chance of flooding over 30 yrs
- 0.0%
- Est. flood insurance / yr
- $507 – $1,088
Fire risk 1/10 · Minimal
- Est. fire insurance / yr
- $659 – $1,223
Heat risk 6/10 · Moderate
- Hot days now (above 101°F)
- 7 days/yr
- Hot days in 30 yrs
- 20 days/yr
Wind risk 1/10 · Minimal
- Chance of severe wind over 30 yrs
- —
Air-quality risk 7/10 · Major
- Unhealthy air days now
- 12 days/yr
- Unhealthy air days in 30 yrs
- 14 days/yr
Risk factors via First Street. Map © Google.
Why this score? — see what drove the F grade
The composite is a weighted blend of 9 inputs, each scored 0–100. Each bar is that input's sub-score; the figure is the points it added to the 100-point composite (weight × sub-score).
- ARV discount +7.5/15.0
- Livability +3.3/5.0
- Rent growth +2.5/5.0
- Schools +2.5/10.0
- Condition / age +2.5/5.0
- Cash flow +0.0/30.0
- 1% rule +0.0/10.0
- DSCR +0.0/10.0
- Appreciation +0.0/10.0
$10,800,000
🖨 Deal sheet (PDF) 📄 Offer letter ✓ Due diligence
Multi-family units
County records classify this as Multi-Family (5+ Unit). Listing-text estimate: 4 units. estimate disagrees with records
5+ unit building — per-unit beds/baths from public records are typically unavailable; the breakdown below (if shown) is an estimate from the listing text.
Listing remarks MLS
We are proud to present Villa Monterey, a Well-Maintained 41-Unit Asset Located at 3108 Vineland Avenue in the city of Baldwin Park. Situated one block from the 10 Freeway, this pride-of-ownership property benefits from a high-demand rental pocket, proximity to major retail hubs, and consistent occupancy levels. Baldwin Park’s central location and the property’s historical stability make this an ideal investment choice for steady rental income and long-term appreciation in the heart of the San Gabriel Valley. Villa Monterey is a 41-unit community featuring a total building size of ±35,954 SF situated on an expansive ±71,546 SF lot (±1.64 Acres). The property features an excellent unit mix consisting of (20) 1-bedroom/1-bathroom, (10) 2-bedroom/1-bathroom, and (11) 2-bedroom/2-bathroom floor plans with an impressive average unit size of ±879 SF. Meticulously cared for, the asset features an open garden-style layout with amenities that include a swimming pool, ample covered parking, secured access, storage space, and two on-site laundry facilities. Units are well-appointed with high-speed internet access, AC & heating, ceiling fans, and full kitchen appliances including dishwashers. This opportunity features an assumable loan at a 2.95% interest-only rate until June 2030. This rare financing allows a new investor to realize a 6.84% Cash-on-Cash return on current income, with the potential to reach a 11.05% return on pro forma income. The property currently operates at a 4.84% Cap Rate, with a clear path to a 6.90% Cap Rate at market rents. The City of Baldwin Park is ideally located within Southern California, offering exceptional “hub” access to the 10 and 605 freeways. Its prime location is within walking distance to major retail centers featuring Walmart, Home Depot, Target, Food 4 Less, Starbucks, and LA Fitness. Significant employment and entertainment hubs within a 20-mile radius include Downtown Los Angeles, the City of Commerce, the City of Industry, Pasadena, and Dodger Stadium. Villa Monterey represents a premier income-producing asset in a high-rental-demand location, presenting a stable and lucrative opportunity for 1031 exchange buyers and seasoned investors seeking a large-scale footprint with significant 30% financial upside.
Key facts
- Central location
- Swimming pool
- 1.64 acre lot
Tags
Neighborhood map
What this means for you Summary
Snapshot
- This is a 4 × 2-bed/1-bath units multifamily listed at $10.80M.
Deal economics
- At list price, monthly cash flow is $-58k ($-698k/yr) — negative. Per door: $-15k/mo.
- To cash-flow at today's rent, offer at most $1.16M (89.3% below list).
- To meet the 1% rule (rent ≥ 1% of price), the offer needs to be $1.01M (90.6% below list).
- Recommended offer: $1.01M (90.6% below list) — sets the bar for 1% rule.
- Cap rate -0.2% vs local median 2.8% in Baldwin Park — below-typical yield; the buyer is paying a premium for something (appreciation thesis, condition, location) that the cap rate doesn't capture.
Location & tenants
- Location reads 66/100 on livability (#357 in CA) — a middle-class / working-renter tenant base. Strengths: commute A+, employment B+; Watch: crime C-, cost of living F, health & safety F.
- Baldwin Park Unified (suburban): math 20% / reading 37% proficiency, ranked #359 of 517 in CA (top 69%) — low school quality limits family demand, transient renter base, plan for 1-2y turnover; 74% free/reduced lunch — lower-income household profile, screen leases tightly.
- Zoned schools: Foster Elementary (math 16% / reading 32%, grade F, #1,150 of 1,571 statewide, top 74%, 425 students, 85% FRL); Charles D. Jones Middle (math 15% / reading 36%, grade F, #260 of 498 statewide, top 54%, 468 students, 93% FRL); Baldwin Park High (math 27% / reading 72%, grade D, #352 of 1,170 statewide, top 31%, 1,414 students, 85% FRL).
- Market conditions: 53 active listings in the ZIP; solid renter incomes; 19,697 units permitted in Los Angeles County in 2024 (9,426 in 5+ unit buildings).
- At $10,127/mo this rent would consume 150% of the median local household income ($81k/yr) (locally 1946% of renters already pay >50% of income on rent) — very limited rent-growth headroom before tenants either downsize or default.
Forward outlook
- Local home prices are declining (-3.0%/yr); year-one equity from $75k of loan paydown is wiped out by about $324k of value loss. Plan a longer hold.
- Los Angeles County population projected at +9% by 2050 — modest demand growth; plan on rents tracking national, not racing it.
Negotiation context
- It's been on market 132 days — a 12% lower offer ($9.50M) is reasonable based on typical stale-listing flexibility.
- 3 sale attempts since 2y ago with the ask held roughly flat each time — persistent listings suggest the price (not the market) is what's stuck; bring a comps-based counter.
- Current owner paid $2.00M; list at $10.80M implies a 440% gain — meaningful room to come down on a strong offer.
Risks & watch-outs
- Climate carrying-cost: extreme-heat days projected 7→20/yr by 2055 (HVAC capex compounding) — expect insurance premiums to compound above CPI over the hold.
Questions for the listing agent
- What do current leases actually rent for vs. the listed asking? Can we see a recent rent roll and the last 12 months of T-12 income?
- It's been on market 132 days. Have you received any prior offers? Is the seller open to a 91% concession, seller financing, or rate buy-down credit?
- Can we see the unit-by-unit rent roll, current vacancy, and any below-market leases? What's the average tenancy length?
- What capital expenditures (roof, boiler, parking lot, exteriors) have been made in the last 5 years, and what's planned in the next 2?
- Built in 1978 — when were the roof, HVAC, electrical panel, plumbing, and water heater last replaced?
- Why hasn't it sold? Are there any deal-killer items the seller is aware of (foundation, flood, title, zoning, code violations)?
- Is there a deadline driving the sale (1031 exchange, divorce, estate, relocation)? That informs how much negotiation room exists.
- Schools are D-rated, which usually means shorter tenancies and higher turnover. Who's the typical renter profile here, and what's been the actual vacancy rate?
- The area grade is low — what's the realistic commute time and amenity access for the typical tenant pool here? Any planned neighborhood developments (good or bad) we should know about?
- What's the average days-on-market for RENTAL listings here right now (not sales)? A rising rental-DOM trend means longer vacancies and softer asking-rent achievability than the comps imply.
- What's the recent tenant-quality profile in this submarket — average credit score on applications, eviction rate, late-payment / NSF rate, and stable-employment percentage? A property-management company in the area should have these aggregated.
- How much new apartment / multifamily construction is in the pipeline within 1–3 miles? Heavy new supply (>2% of stock underway) typically softens rents 12–24 months out; light construction supports rent growth.
Investment metrics
- 1% rule
- 0.09% ✗
- Cap rate
- -0.17%
- Cash-on-cash
- -23.08%
- DSCR
- -0.03
- GRM
- 88.9
CMA / ARV
No comps found within radius.
Projected returns pro-forma
-3.0% appreciation · 3.0% rent growth · sell at horizon
- IRR
- -66.7%
- Equity multiple
- -0.81×
- Total profit
- $-5,458,756
- Equity at exit
- $1,610,315
- IRR
- —
- Equity multiple
- -2.16×
- Total profit
- $-9,542,967
- Equity at exit
- $933,787
Cash invested: $3,024,000 (down + closing). Projections, not guarantees.
Landlord ↔ Tenant lean methodology
- Overall (STATE)
- 18 Strongly Tenant-Friendly
- State California
- 18 Strongly Tenant-Friendly · D+13
- County
- — inherits STATE
- City
- — inherits STATE
ZIP-level market 91706
- Active inventory
- 53
- Price-to-rent
- 355.5×
Monthly cashflow live
- Estimated rent
- $10,127 medium interval (Pro) →
- Mortgage (P&I)
- −$56,636
- Tax from tax record
- −$5,014 /mo · $60,172/yr
- Insurance
- −$4,500
- HOA
- −$0
- Vacancy / Maint / Mgmt
- −$2,127
- Net cashflow
- $-58,150
Break-even live
Sensitivity live
| Price | -10% $-52,037 | -5% $-55,094 | +0% $-58,150 | +5% $-61,207 | +10% $-64,264 |
|---|---|---|---|---|---|
| Rent | -10% $-58,950 | -5% $-58,550 | +0% $-58,150 | +5% $-57,750 | +10% $-57,350 |
| Rate | -1.0pp $-52,712 | -0.5pp $-55,404 | base $-58,150 | +0.5pp $-60,949 | +1.0pp $-63,796 |
4-unit breakdown (identical units grouped — click to expand)
| Units | Beds | Baths | Est. rent |
|---|---|---|---|
| 4× units | 2 | 1 | $10,128 |
| #1 | 2 | 1 | $2,532 |
| #2 | 2 | 1 | $2,532 |
| #3 | 2 | 1 | $2,532 |
| #4 | 2 | 1 | $2,532 |
| Total (4 units) | $10,127 | ||
UW: 25.0% down · 7.5% · 30yr · 1.5% tax · 5.0% vac · 8.0% maint · 8.0% mgmt
Financing live
Cash to close
- Down payment
- $2,700,000
- Closing costs
- $324,000
- Reserves months
- —
- Total cash needed
- —
Loan-product check · same deal, 3 products live
Conventional
25% down · 7.5% · 30yr
- Down + closing
- —
- Monthly P&I
- —
- Monthly cashflow
- —
- DSCR
- —
- Eligible?
- —
Personal DTI + credit; lowest rate.
DSCR
20% down · 8.5% · 30yr
- Down + closing
- —
- Monthly P&I
- —
- Monthly cashflow
- —
- DSCR
- —
- Eligible?
- —
No personal income docs; deal must DSCR.
Hard money
10% down · 12.0% · 12mo
- Down + closing
- —
- Monthly P&I
- —
- Monthly cashflow
- —
- DSCR
- —
- Eligible?
- —
Short-term bridge; refi at stabilization.
Listing history 24 events
-
2026-06-21days on market $10,800,000 Active 132 DOM
-
2026-06-18days on market $10,800,000 Active 129 DOM
-
2026-06-17days on market $10,800,000 Active 128 DOM
-
2026-06-16days on market $10,800,000 Active 127 DOM
-
2026-06-15days on market $10,800,000 Active 126 DOM
-
2026-06-13days on market $10,800,000 Active 124 DOM
-
2026-06-13days on market $10,800,000 Active 123 DOM
-
2026-06-09days on market $10,800,000 Active 120 DOM
-
2026-06-08days on market $10,800,000 Active 119 DOM
-
2026-06-07days on market $10,800,000 Active 118 DOM
-
2026-06-04days on market $10,800,000 Active 115 DOM
-
2026-06-03days on market $10,800,000 Active 114 DOM
-
2026-06-02days on market $10,800,000 Active 113 DOM
-
2026-06-01days on market $10,800,000 Active 112 DOM
-
2026-05-31days on market $10,800,000 Active 111 DOM
-
2026-02-09$10,800,000 Active 2336-char remark
Show marketing remark (2336 chars)
We are proud to present Villa Monterey, a Well-Maintained 41-Unit Asset Located at 3108 Vineland Avenue in the city of Baldwin Park. Situated one block from the 10 Freeway, this pride-of-ownership property benefits from a high-demand rental pocket, proximity to major retail hubs, and consistent occupancy levels. Baldwin Park’s central location and the property’s historical stability make this an ideal investment choice for steady rental income and long-term appreciation in the heart of the San Gabriel Valley. Villa Monterey is a 41-unit community featuring a total building size of ±35,954 SF situated on an expansive ±71,546 SF lot (±1.64 Acres). The property features an excellent unit mix consisting of (20) 1-bedroom/1-bathroom, (10) 2-bedroom/1-bathroom, and (11) 2-bedroom/2-bathroom floor plans with an impressive average unit size of ±879 SF. Meticulously cared for, the asset features an open garden-style layout with amenities that include a swimming pool, ample covered parking, secured access, storage space, and two on-site laundry facilities. Units are well-appointed with high-speed internet access, AC & heating, ceiling fans, and full kitchen appliances including dishwashers. This opportunity features an assumable loan at a 2.95% interest-only rate until June 2030. This rare financing allows a new investor to realize a 6.84% Cash-on-Cash return on current income, with the potential to reach a 11.05% return on pro forma income. The property currently operates at a 4.84% Cap Rate, with a clear path to a 6.90% Cap Rate at market rents. The City of Baldwin Park is ideally located within Southern California, offering exceptional “hub” access to the 10 and 605 freeways. Its prime location is within walking distance to major retail centers featuring Walmart, Home Depot, Target, Food 4 Less, Starbucks, and LA Fitness. Significant employment and entertainment hubs within a 20-mile radius include Downtown Los Angeles, the City of Commerce, the City of Industry, Pasadena, and Dodger Stadium. Villa Monterey represents a premier income-producing asset in a high-rental-demand location, presenting a stable and lucrative opportunity for 1031 exchange buyers and seasoned investors seeking a large-scale footprint with significant 30% financial upside.
-
2025-04-30historical $2,195
-
2025-04-26price $2,195
-
2025-04-12price $2,295
-
2025-03-08$2,295
-
2024-11-04historical $1,795
-
2024-10-26$1,795
-
2022-06-22price $1,895
-
1986-07-15soldstatus $2,000,000
ⓘ Source: listings_history table (triggers on properties + properties_extension) + one-shot
backfill from property_details.listing_events for pre-trigger history.
Tax reassessment forecast CA · Resets to sale price
- Current annual tax
- $60,172 · $5,014/mo
- Projected year-2 tax
- $82,080 · $6,840/mo
- Expected delta
- +$21,908/yr (+$1,826/mo · 36.4%)
ⓘ Screening estimate from a state-policy table — verify with the county assessor before closing.
Climate risk First Street
- Flood 1/10 Low FEMA zone X (unshaded) · 0% chance over 30 yrs
- Wildfire 1/10 Low
- Heat 6/10 Major 7 d/yr ≥101°F today · 20 d/yr by 30 yrs out
- Wind 1/10 Low
- Air quality 7/10 Severe 12 unhealthy d/yr today · 14 by 30 yrs out
Nearby sold comps map
Loading sold comps map…
Walkable amenities ~0.75 mi
Loading nearby amenities…
Taxation est. · year 1
- Rental income
- $121,524
- − Mortgage interest
- −$604,968
- − Property taxes
- −$60,172
- − Insurance
- −$54,000
- − Repairs & maintenance
- −$9,722
- − Management
- −$9,722
- − Depreciation
- −$314,182
- Taxable loss
- −$931,242
- Est. tax savings @ 24.0%
- +$223,498
- After-tax cash flow
- $-474,307/yr
For passive investors: Depreciation is non-cash, so a rental often shows a tax loss while cash-flowing — sheltering income. Rental losses are passive: they offset passive income freely, and up to $25,000/yr can offset ordinary (W-2) income if you actively participate and your MAGI is under $100k (phasing out to $0 by $150k); unused losses carry forward. On sale, claimed depreciation is recaptured at up to 25%, and gains may owe capital-gains tax (a 1031 exchange can defer both). Figures are a year-1 estimate at your 24.0% rate — not tax advice; consult a CPA.
Schools (NCES district)
- District
- Baldwin Park Unified
- NCES district ID
- 0603690
- Math proficiency
- 20% ▼ -9.00%
- Reading proficiency
- 37% ▼ -7.00%
- Median HH income
- $53,156
- Composite
- 25.2/100
- National rank
- #7510
- State rank
- #359 of 517 in CA
Livability — Baldwin Park
- Score
- 66/100
- State rank
- #357
- US rank
- #12192
Category grades
Schools grade is shown separately in the Schools card above.
Census & demographics
- Census place
- Baldwin Park, CA
- County
- Los Angeles County · 9,444,647 people
- City population
- 71,082
- Metro
- Los Angeles-Long Beach-Anaheim, CA
- Population (ZIP)
- 71,082
- Household income
- $81,122
- Rent vs Own
- Severe rent burden
- 1946.0
Population outlook (Los Angeles County) Hauer SSP2
- Today (2025)
- 10,940,515 people
- By 2030
- 11,256,481 · +2.9%
- By 2040
- 11,729,929 · +7.2%
- By 2050
- 11,948,407 · +9.2%
- By 2075
- 11,818,114 · +8.0%
- By 2100
- 10,842,928 · -0.9%
Race, ethnicity, and origin ACS 2023
- Neighborhood character
- Predominantly Hispanic (73%)
- Race & ethnicity
- Hispanic / Latino 73% Two or more races 24% Asian 22% Native American 3% White 3%
- Hispanic origin (detail)
- Mexican 63%
- Foreign-born
- 44% · Canada, China, Vietnam
- Languages at home
- 21% English-only · Spanish 60% Chinese 10% Vietnamese 4%
Political lean MEDSL · Los Angeles
- 2024 margin
- Solid D (+32.9) · D 64.8% · R 31.9% · Other 3.3%
- 2008→2024 swing
- -7.4pp toward R · 2008: 40.4pp · 2024: 32.9pp
- All cycles
- 2024: D+32.9 2020: D+44.2 2016: D+48.0 2012: D+40.0 2008: D+40.4
Not yet ingested
- Civics
- —
Market trends
- HPI YoY
- ▼ -1031.00%
- Current HPI
- 458.8227
- Rent YoY
- —
- Metro
- Los Angeles-Long Beach-Anaheim, CA
- State GDP YoY
- ▲ 3.21%
- F500 in state
- 116
Industry mix (Fortune 500 HQ in CA)
| Industry | F500 HQs | Revenue |
|---|---|---|
| Technology | 27 | $1,492B |
|
||
| Financial Services | 3 | $174B |
|
||
| Retail | 3 | $44B |
|
||
| Insurance | 3 | $26B |
|
||
| Media / Entertainment | 2 | $115B |
|
||
| Pharmaceuticals / Biotech | 2 | $62B |
|
||
Price history
+440.0% since first listed9 events — show timeline
- 2026-02-09 Listed $10,800,000 CRMLS
- 2025-04-30 Rental Removed $2,195 RENTALBEAST
- 2025-04-26 Price Changed $2,195 RENTALBEAST
- 2025-04-12 Price Changed $2,295 RENTALBEAST
- 2025-03-08 Listed for Rent $2,295 RENTALBEAST
- 2024-11-04 Rental Removed $1,795 RENTALBEAST
- 2024-10-26 Listed for Rent $1,795 RENTALBEAST
- 2022-06-22 Price Changed $1,895 RENT.
- 1986-07-15 Sold (Public Records) $2,000,000 Public Records
Property tax history
+2.2%/yrLatest (2025): $60,172 · +9.9% YoY. Source: county tax records.
Cash-flow waterfall
monthlySold comps — $/sqft
last 12 mo · ≤1 miLoading sold comps…