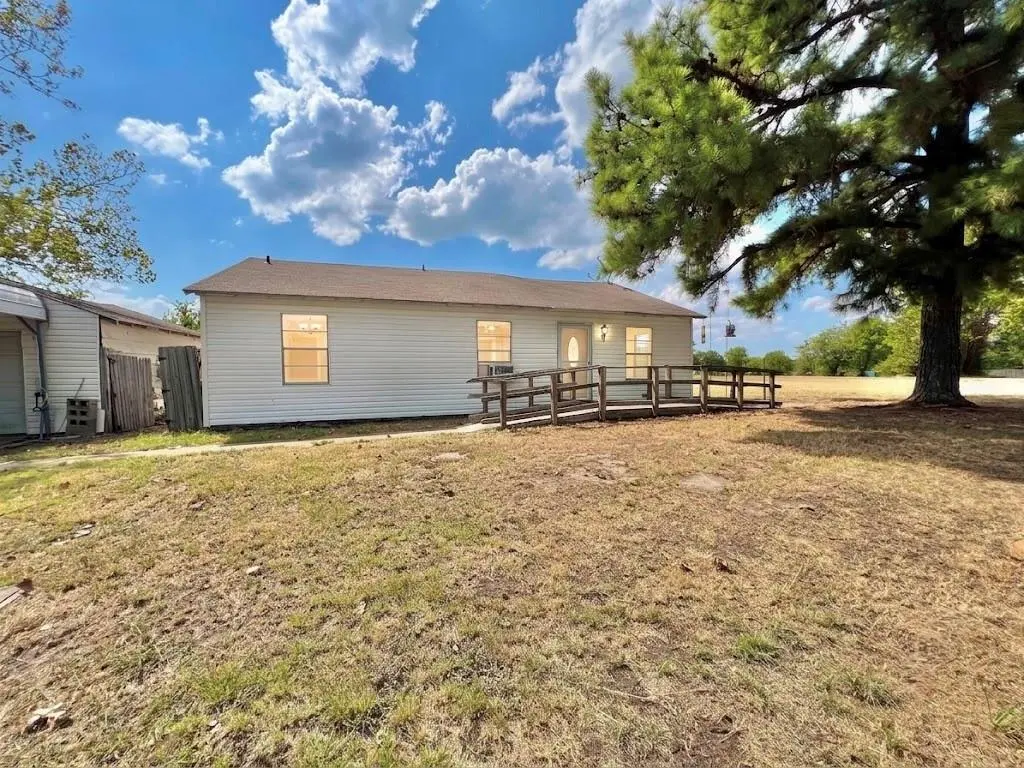
130 Calhoun Cv · East Tawakoni, TX
Flood risk 1/10 · Minimal
- FEMA flood zone
- X (unshaded)
- Chance of flooding over 30 yrs
- 0.0%
- Est. flood insurance / yr
- $507 – $1,088
Fire risk 3/10 · Minor
- Est. fire insurance / yr
- $1,222 – $2,270
Heat risk 7/10 · Major
- Hot days now (above 110°F)
- 7 days/yr
- Hot days in 30 yrs
- 24 days/yr
Wind risk 6/10 · Moderate
- Chance of severe wind over 30 yrs
- 27.0%
Air-quality risk 2/10 · Minimal
- Unhealthy air days now
- 0 days/yr
- Unhealthy air days in 30 yrs
- 1 days/yr
Risk factors via First Street. Map © Google.
Why this score? — see what drove the B- grade
The composite is a weighted blend of 9 inputs, each scored 0–100. Each bar is that input's sub-score; the figure is the points it added to the 100-point composite (weight × sub-score).
- Cash flow +25.7/30.0
- ARV discount +15.0/15.0
- DSCR +8.6/10.0
- 1% rule +6.3/10.0
- Livability +2.6/5.0
- Rent growth +2.5/5.0
- Condition / age +2.5/5.0
- Schools +2.2/10.0
- Appreciation +0.0/10.0
$149,400
🖨 Deal sheet 📄 Offer letter ✓ Due diligence
Listing remarks
* CASH PREFERRED * Enjoy the lake breeze! FREEDOM AT THE LAKE! Developing neighborhood off the lake! NO RESTRICTIONS, NO HOA - BUILD BARNDOMINIUM - CUSTOM HOME, Bring your work trucks, RV, & animals. Long lot, Home offers shop & carport. Rebuild for quick flip or teardown to rebuild. 11 miles to Quinlan & Emory. Quick drive to Emergency Medical, 10 miles from Rains County Veterans Services. Lake Tawakoni offers 376 acres of oak forest, more than five miles of lakeshore, and the lake itself. Mature trees, flat lot. Point area is receiving a massive push due to state-level funding allocations coming online. The Texas Broadband Development Office has begun to bring fiber-to-
Key facts
- Long lot
- No restrictions
- Build barndominium
Tags
Property features AI
Finance
- Other: No known restrictions; mobile homes not allowed
- Financial info: Acceptable financing: Cash, Conventional, 1031 Exchange, Other; Treat as clear loan type; No second mortgage
- HOA & community: No association
Exterior
- Parking: 2-car garage (inside entrance, garage faces front, oversized, includes storage); 2 carport spaces; 4 covered parking spaces; Additional parking available
- Utilities: City water (individual water meter); City sewer (sewer available); Electricity available and connected; Cable available; Individual gas meter; Propane available; Other utilities
- Home design: Single family residence; Residential property; Property attached: yes; Subdivided parcel (multi-parcel); Year built 1960; Accessible approach with ramp
- Construction: Metal siding and vinyl siding; Pillar/post/pier foundation
- Exterior features: Lakefront view with common area lake frontage; Cleared and grassed yard; Few trees and pine on lot; Level lot; Chain link and wood fencing; Other outside structures (storage, workshop); Lake pump present
Interior
- Kitchen: Gas cooktop; Refrigerator
- Bedrooms: 3 bedrooms (all on main level; primary bedroom on main level)
- Bathrooms: 1 full bathroom
- Heating & cooling: Central heating; Electric heating; Natural gas heating; Propane heating; Central air; Electric cooling; Window unit(s)
- Interior features: One-level home; 6 total rooms; Living area approximately 1515; Solarium / Sunroom; Accessible approach with ramp; Other interior features
- Laundry & utility: Workshop with electric; Storage
Neighborhood map
What this means for you Summary
Snapshot
- This is a 3-bed/1.0-bath single-family listed at $149k.
Deal economics
- At list price, monthly cash flow is $357 ($4k/yr) — positive.
- The deal already cash-flows at list — no discount required.
- Meets the 1% rule at list price ($2k rent vs $149k).
- Recommended offer: $145k (3.0% below list) — sets the bar for market timing.
- Cap rate 9.2% vs local median 4.5% in East Tawakoni — top-decile yield for the area; either an underpriced asset or a hidden risk that comps aren't pricing in. Stress-test before assuming the spread holds.
Location & tenants
- Location reads 52/100 on livability (#1,455 in TX) — a working-class tenant base; expect higher turnover. Strengths: cost of living A+, housing A+; Watch: crime D, amenities F, commute F.
- Rains ISD (rural): math 22% / reading 30% proficiency, ranked #697 of 826 in TX (top 84%) — low school quality limits family demand, transient renter base, plan for 1-2y turnover.
- Zoned schools: Rains El (437 students, 68% FRL) — zoned schools average 68% FRL vs 48% district-wide (19 pts higher); higher-poverty schools than district average — tighter screening recommended.
- Market conditions: 137 active listings in the ZIP; 21 units permitted in Rains County in 2024 (0 in 5+ unit buildings).
Forward outlook
- Local home prices are declining (-3.0%/yr); year-one equity from $1k of loan paydown is wiped out by about $4k of value loss. Plan a longer hold.
Negotiation context
- It's been on market 31 days — a 3% lower offer ($145k) is reasonable based on typical stale-listing flexibility.
- 2 sale attempts since 3y ago with the ask held roughly flat each time — persistent listings suggest the price (not the market) is what's stuck; bring a comps-based counter.
Risks & watch-outs
- Climate carrying-cost: major wind risk, 27% chance of damaging wind over 30y; extreme-heat days projected 7→24/yr by 2055 (HVAC capex compounding) — expect insurance premiums to compound above CPI over the hold.
Questions for the listing agent
- It's been on market 31 days. Have you received any prior offers? Is the seller open to a 3% concession, seller financing, or rate buy-down credit?
- Built in 1960 — when were the roof, HVAC, electrical panel, plumbing, and water heater last replaced?
- Is there a deadline driving the sale (1031 exchange, divorce, estate, relocation)? That informs how much negotiation room exists.
- Schools are F-rated, which usually means shorter tenancies and higher turnover. Who's the typical renter profile here, and what's been the actual vacancy rate?
- Crime grade is D in this area — have there been break-ins, vandalism, or insurance claims at this property in the last 3 years? What carrier currently insures it and at what premium?
- What's the average days-on-market for RENTAL listings here right now (not sales)? A rising rental-DOM trend means longer vacancies and softer asking-rent achievability than the comps imply.
- What's the recent tenant-quality profile in this submarket — average credit score on applications, eviction rate, late-payment / NSF rate, and stable-employment percentage? A property-management company in the area should have these aggregated.
- How much new for-sale + rental construction is in the pipeline within 1–3 miles? Heavy new supply typically softens prices + rents 12–24 months out; constrained supply supports both.
Investment metrics
- 1% rule
- 1.13% ✓
- Cap rate
- 9.16%
- Cash-on-cash
- 10.24%
- DSCR
- 1.46
- GRM
- 7.4
CMA / ARV
- ARV (on-the-fly)
- $245,680
- Comps found
- 2
Show comp detail 2 sales within ~0.75 mi
| Address | Dist | Beds/Ba | Sqft | Sold | Price | $/sf | Match |
|---|---|---|---|---|---|---|---|
| 697 Tawakoni Dr | 0.57mi | 3/1.0 | 1,262 (-15%) | 0mo | $209,900 | $166 | 49 |
| 333 Egret Cir | 0.33mi | 4/2.0 (+1) | 1,408 (-5%) | 24mo | $215,000 | $153 | 48 |
Match score weights: distance 35% · size 25% · config 20% · recency 20%. Top-matched comps best support the ARV.
Projected returns pro-forma
-3.0% appreciation · 3.0% rent growth · sell at horizon
- IRR
- -0.9%
- Equity multiple
- 0.96×
- Total profit
- $-1,480
- Equity at exit
- $22,276
- IRR
- 8.7%
- Equity multiple
- 1.67×
- Total profit
- $27,944
- Equity at exit
- $12,917
Cash invested: $41,832 (down + closing). Projections, not guarantees.
Landlord ↔ Tenant lean methodology
- Overall (STATE)
- 87 Strongly Landlord-Friendly
- State Texas
- 87 Strongly Landlord-Friendly · R+5
- County
- — inherits STATE
- City
- — inherits STATE
ZIP-level market 75472
- Home prices YoY
- -6.4%
- Active inventory
- 137
- Price-to-rent
- 7.4×
Monthly cashflow live
- Estimated rent
- $1,682 medium interval (Pro) →
- Mortgage (P&I)
- −$783
- Tax from tax record
- −$126 /mo · $1,509/yr
- Insurance
- −$62
- HOA
- −$0
- Vacancy / Maint / Mgmt
- −$353
- Net cashflow
- $357
Break-even live
UW: 25.0% down · 7.5% · 30yr · 1.5% tax · 5.0% vac · 8.0% maint · 8.0% mgmt
Financing live
Cash to close
- Down payment
- $37,350
- Closing costs
- $4,482
- Reserves months
- —
- Total cash needed
- —
Loan-product check · same deal, 3 products live
Conventional
25% down · 7.5% · 30yr
- Down + closing
- —
- Monthly P&I
- —
- Monthly cashflow
- —
- DSCR
- —
- Eligible?
- —
Personal DTI + credit; lowest rate.
DSCR
20% down · 8.5% · 30yr
- Down + closing
- —
- Monthly P&I
- —
- Monthly cashflow
- —
- DSCR
- —
- Eligible?
- —
No personal income docs; deal must DSCR.
Hard money
10% down · 12.0% · 12mo
- Down + closing
- —
- Monthly P&I
- —
- Monthly cashflow
- —
- DSCR
- —
- Eligible?
- —
Short-term bridge; refi at stabilization.
Listing history 19 events
-
2026-06-19days on market $149,400 Active 31 DOM
-
2026-06-18days on market $149,400 Active 30 DOM
-
2026-06-17days on market $149,400 Active 29 DOM
-
2026-06-16days on market $149,400 Active 28 DOM
-
2026-06-15days on market $149,400 Active 27 DOM
-
2026-06-14days on market $149,400 Active 25 DOM
-
2026-06-12days on market $149,400 Active 24 DOM
-
2026-06-09days on market $149,400 Active 21 DOM
-
2026-06-08days on market $149,400 Active 20 DOM
-
2026-06-07days on market $149,400 Active 19 DOM
-
2026-06-07days on market $149,400 Active 18 DOM
-
2026-06-03days on market $149,400 Active 15 DOM
-
2026-06-02days on market $149,400 Active 14 DOM
-
2026-06-01days on market $149,400 Active 13 DOM
-
2026-05-31days on market $149,400 Active 12 DOM
-
2026-05-30days on market $149,400 Active 11 DOM
-
2026-05-19$149,400 Active
-
2023-10-10price $140,000
-
2023-08-30$159,000 Active
ⓘ Source: listings_history table (triggers on properties + properties_extension) + one-shot
backfill from property_details.listing_events for pre-trigger history.
Tax reassessment forecast TX · Resets to sale price
- Current annual tax
- $1,509 · $126/mo
- Projected year-2 tax
- $2,734 · $228/mo
- Expected delta
- +$1,225/yr (+$102/mo · 81.2%)
ⓘ Screening estimate from a state-policy table — verify with the county assessor before closing.
Climate risk First Street
- Flood 1/10 Low FEMA zone X (unshaded) · 0% chance over 30 yrs
- Wildfire 3/10 Moderate
- Heat 7/10 Severe 7 d/yr ≥110°F today · 24 d/yr by 30 yrs out
- Wind 6/10 Major 27% chance of damaging wind over 30 yrs
- Air quality 2/10 Low 0 unhealthy d/yr today · 1 by 30 yrs out
Nearby sold comps map
Loading sold comps map…
Walkable amenities ~0.75 mi
Loading nearby amenities…
Taxation est. · year 1
- Rental income
- $20,180
- − Mortgage interest
- −$8,369
- − Property taxes
- −$1,509
- − Insurance
- −$747
- − Repairs & maintenance
- −$1,614
- − Management
- −$1,614
- − Depreciation
- −$4,346
- Taxable income
- $1,980
- Est. tax owed @ 24.0%
- −$475
- After-tax cash flow
- $3,809/yr
For passive investors: Depreciation is non-cash, so a rental often shows a tax loss while cash-flowing — sheltering income. Rental losses are passive: they offset passive income freely, and up to $25,000/yr can offset ordinary (W-2) income if you actively participate and your MAGI is under $100k (phasing out to $0 by $150k); unused losses carry forward. On sale, claimed depreciation is recaptured at up to 25%, and gains may owe capital-gains tax (a 1031 exchange can defer both). Figures are a year-1 estimate at your 24.0% rate — not tax advice; consult a CPA.
Schools (NCES district)
- District
- Rains ISD
- NCES district ID
- 4836360
- Math proficiency
- 22% ▼ -20.00%
- Reading proficiency
- 30% ▼ -10.00%
- Median HH income
- $45,836
- Composite
- 22.46/100
- National rank
- #8106
- State rank
- #697 of 826 in TX
Livability — East Tawakoni
- Score
- 52/100
- State rank
- #1455
- US rank
- #24873
Category grades
Schools grade is shown separately in the Schools card above.
Census & demographics
- Census place
- East Tawakoni, TX
- Population (ZIP)
- 4,290
Population outlook (Rains County) Hauer SSP2
- Today (2025)
- 11,516 people
- By 2030
- 11,610 · +0.8%
- By 2040
- 11,622 · +0.9%
- By 2050
- 11,329 · -1.6%
- By 2075
- 10,390 · -9.8%
- By 2100
- 8,809 · -23.5%
Race, ethnicity, and origin ACS 2023
- Neighborhood character
- Predominantly White (80%)
- Race & ethnicity
- White 80% Hispanic / Latino 13% Two or more races 11% Black 3%
- Hispanic origin (detail)
- Mexican 12%
- Common ancestry
- Iranian 3% Lithuanian 2% Slovak 1%
- Foreign-born
- 1% · Canada
- Languages at home
- 96% English-only · Spanish 3%
Political lean MEDSL · Rains
- 2024 margin
- Solid R (+72.9) · D 13.3% · R 86.2%
- 2008→2024 swing
- -23.4pp toward R · 2008: -49.5pp · 2024: -72.9pp
- All cycles
- 2024: R+72.9 2020: R+71.2 2016: R+71.3 2012: R+61.8 2008: R+49.5
Not yet ingested
- Civics
- —
Market trends
- HPI YoY
- ▼ -10.57%
- Current HPI
- 153.54
- Rent YoY
- —
- Metro
- —
- State GDP YoY
- ▲ 3.95%
- F500 in state
- 110
Industry mix (Fortune 500 HQ in TX)
| Industry | F500 HQs | Revenue |
|---|---|---|
| Energy | 16 | $1,198B |
|
||
| Technology | 5 | $198B |
|
||
| Engineering / Construction | 4 | $72B |
|
||
| Energy Services | 3 | $60B |
|
||
| Utilities | 3 | $41B |
|
||
| Healthcare | 2 | $330B |
|
||
Price history
-6.0% since first listed3 events — show timeline
- 2026-05-19 Listed $149,400 NTREIS
- 2023-10-10 Price Changed $140,000 NTREIS
- 2023-08-30 Listed $159,000 NTREIS
Property tax history
+3.7%/yrLatest (2025): $1,509 · +17.7% YoY. Source: county tax records.
Cash-flow waterfall
monthlySold comps — $/sqft
last 12 mo · ≤1 miLoading sold comps…