1101 Forest Ln · Columbus, MI
Flood risk 1/10 · Minimal
- FEMA flood zone
- X (unshaded)
- Chance of flooding over 30 yrs
- 0.0%
- Est. flood insurance / yr
- $507 – $1,088
Fire risk 3/10 · Minor
- Est. fire insurance / yr
- $784 – $1,456
Heat risk 3/10 · Minor
- Hot days now (above 96°F)
- 7 days/yr
- Hot days in 30 yrs
- 14 days/yr
Wind risk 1/10 · Minimal
- Chance of severe wind over 30 yrs
- —
Air-quality risk 4/10 · Minor
- Unhealthy air days now
- 3 days/yr
- Unhealthy air days in 30 yrs
- 5 days/yr
Risk factors via First Street. Map © Google.
Why this score? — see what drove the D- grade
The composite is a weighted blend of 9 inputs, each scored 0–100. Each bar is that input's sub-score; the figure is the points it added to the 100-point composite (weight × sub-score).
- 1% rule +10.0/10.0
- Cash flow +7.7/30.0
- ARV discount +7.5/15.0
- Condition / age +3.8/5.0
- Schools +3.4/10.0
- Rent growth +2.5/5.0
- Livability +2.5/5.0
- DSCR +1.8/10.0
- Appreciation +0.0/10.0
$85,000
🖨 Deal sheet 📄 Offer letter ✓ Due diligence
Listing remarks MLS
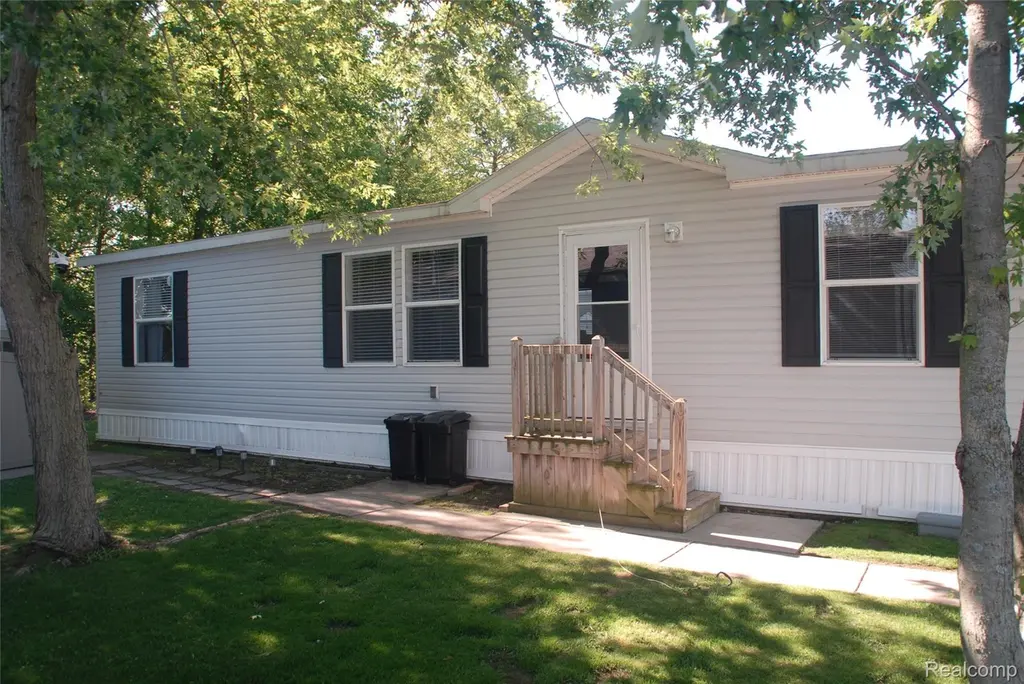
Welcome home to this well-maintained 3-bedroom, 2-bath manufactured home located in a quiet and friendly community park. Offering a spacious open-concept layout, this home features a bright living room, a functional kitchen with ample cabinet space, and a comfortable dining area perfect for family meals and entertaining. The primary suite includes a private full bath and generous closet space, while two additional bedrooms provide flexibility for family, guests, or a home office. A second full bathroom conveniently serves the remaining bedrooms and common areas. Outside, enjoy a low-maintenance yard, off-street parking, and the benefits of community living. Conveniently located near shopping, dining, schools, and major roadways, this affordable home offers comfort, convenience, and value. Don't miss the opportunity to make it your own!
Key facts
- Functional kitchen
- Low-maintenance yard
- Ample cabinet space
Tags
Property features AI
Finance
- Other: Directions: Turn off Gratiot onto Maple Lane, turn left onto Elmwood Lane, arrive at 1101 Forest Lane at the curve; Cross street: Elmwood Lane
- HOA & community: Homeowners association with a monthly fee of $655
Exterior
- Parking: Driveway, no garage
- Utilities: Private well water; Public sewer
- Home design: Single-family residence; One story; Entry at ground level with steps
- Construction: Vinyl siding; Pillar/post/pier foundation
- Exterior features: Paved road access; Lot approximately 0.15 acres (56 x 114)
Interior
- Bathrooms: Two full bathrooms
- Heating & cooling: Forced air heating (natural gas); No cooling
- Interior features: Six total rooms; Ground-level entry with steps
Neighborhood map
What this means for you Summary
Snapshot
- This is a 3-bed/2.0-bath single-family listed at $85k. Condition is rated good.
Deal economics
- At list price, monthly cash flow is $-98 ($-1k/yr) — negative.
- To cash-flow at today's rent, offer at most $71k (16.6% below list).
- Meets the 1% rule at list price ($1k rent vs $85k).
- Recommended offer: $71k (16.6% below list) — sets the bar for cash-flow.
Location & tenants
- Location reads: area grade D — affects rentability + tenant quality, not the cash-flow math above.
- East China School District (suburban): math 32% / reading 46% proficiency, ranked #208 of 540 in MI (top 38%) — families likely to look elsewhere, expect single-tenant / working-renter base with shorter leases.
- Market conditions: 41 active listings in the ZIP; 1 comparable units currently listed for rent nearby; 232 units permitted in St. Clair County in 2024 (0 in 5+ unit buildings).
Forward outlook
- Local home prices are declining (-3.0%/yr); year-one equity from $588 of loan paydown is wiped out by about $3k of value loss. Plan a longer hold.
- St. Clair County population projected at -20% by 2050 — secular population decline; favor cash flow + early exit over multi-decade hold.
Negotiation context
- It's been on market 18 days — a 2% lower offer ($84k) is reasonable based on typical stale-listing flexibility.
- 2 sale attempts; this cycle's ask has dropped $10k (11%) from the opening price — seller is motivated, your offer sets the floor, not the list.
Risks & watch-outs
- Watch-outs: HOA is 45% of rent.
Questions for the listing agent
- What do current leases actually rent for vs. the listed asking? Can we see a recent rent roll and the last 12 months of T-12 income?
- What does the HOA fee cover, when was the last increase, and are there any pending special assessments or reserve-fund shortfalls?
- Is there a deadline driving the sale (1031 exchange, divorce, estate, relocation)? That informs how much negotiation room exists.
- The area grade is low — what's the realistic commute time and amenity access for the typical tenant pool here? Any planned neighborhood developments (good or bad) we should know about?
- What's the average days-on-market for RENTAL listings here right now (not sales)? A rising rental-DOM trend means longer vacancies and softer asking-rent achievability than the comps imply.
- What's the recent tenant-quality profile in this submarket — average credit score on applications, eviction rate, late-payment / NSF rate, and stable-employment percentage? A property-management company in the area should have these aggregated.
- How much new for-sale + rental construction is in the pipeline within 1–3 miles? Heavy new supply typically softens prices + rents 12–24 months out; constrained supply supports both.
Investment metrics
- 1% rule
- 1.70% ✓
- Cap rate
- 4.91%
- Cash-on-cash
- -4.93%
- DSCR
- 0.78
- GRM
- 4.9
CMA / ARV
- ARV (on-the-fly)
- $291,648
- Comps found
- 1
Show comp detail 1 sale within ~0.75 mi
| Address | Dist | Beds/Ba | Sqft | Sold | Price | $/sf | Match |
|---|---|---|---|---|---|---|---|
| 1980 Hessen Rd | 0.30mi | 3/1.5 | 1,452 (+8%) | 19mo | $315,000 | $217 | 55 |
Match score weights: distance 35% · size 25% · config 20% · recency 20%. Top-matched comps best support the ARV.
Projected returns pro-forma
-3.0% appreciation · 3.0% rent growth · sell at horizon
- IRR
- -23.9%
- Equity multiple
- 0.18×
- Total profit
- $-19,572
- Equity at exit
- $12,674
- IRR
- -17.4%
- Equity multiple
- 0.02×
- Total profit
- $-23,332
- Equity at exit
- $7,349
Cash invested: $23,800 (down + closing). Projections, not guarantees.
Landlord ↔ Tenant lean methodology
- Overall (STATE)
- 62 Landlord-Friendly
- State Michigan
- 62 Landlord-Friendly · EVEN
- County
- — inherits STATE
- City
- — inherits STATE
ZIP-level market 48063
- Active inventory
- 41
- Price-to-rent
- 4.9×
Monthly cashflow live
- Estimated rent
- $1,449 medium interval (Pro) →
- Mortgage (P&I)
- −$446
- Tax est. 1.5%
- −$106 /mo · $1,275/yr
- Insurance
- −$35
- HOA
- −$655
- Vacancy / Maint / Mgmt
- −$304
- Net cashflow
- $-98
Break-even live
UW: 25.0% down · 7.5% · 30yr · 1.5% tax · 5.0% vac · 8.0% maint · 8.0% mgmt
Financing live
Cash to close
- Down payment
- $21,250
- Closing costs
- $2,550
- Reserves months
- —
- Total cash needed
- —
Loan-product check · same deal, 3 products live
Conventional
25% down · 7.5% · 30yr
- Down + closing
- —
- Monthly P&I
- —
- Monthly cashflow
- —
- DSCR
- —
- Eligible?
- —
Personal DTI + credit; lowest rate.
DSCR
20% down · 8.5% · 30yr
- Down + closing
- —
- Monthly P&I
- —
- Monthly cashflow
- —
- DSCR
- —
- Eligible?
- —
No personal income docs; deal must DSCR.
Hard money
10% down · 12.0% · 12mo
- Down + closing
- —
- Monthly P&I
- —
- Monthly cashflow
- —
- DSCR
- —
- Eligible?
- —
Short-term bridge; refi at stabilization.
Rent comps 1 comps
| Address | Beds | Baths | Sqft | Rent | $/sqft | DOM | Units | Dist |
|---|---|---|---|---|---|---|---|---|
| 2109 Redwood Ave Columbus, MI | 2.0–4.0 | 2.0 | 1320 | $1,449 | $1.10 | 1d | 1 | 0.19mi |
HOA detail
- Monthly dues
- $655 · $7,860/yr
Listing history 15 events
-
2026-06-18days on market $85,000 Active 18 DOM
-
2026-06-17days on market $85,000 Active 17 DOM
-
2026-06-16days on market $85,000 Active 16 DOM
-
2026-06-16price $85,000 Active 15 DOM
-
2026-06-15days on market $95,000 Active 15 DOM
-
2026-06-13days on market $95,000 Active 13 DOM
-
2026-06-12days on market $95,000 Active 12 DOM
-
2026-06-09days on market $95,000 Active 9 DOM
-
2026-06-08days on market $95,000 Active 8 DOM
-
2026-06-07days on market $95,000 Active 7 DOM
-
2026-06-07days on market $95,000 Active 6 DOM
-
2026-06-04days on market $95,000 Active 3 DOM
-
2026-06-02days on market $95,000 Active 2 DOM
-
2026-06-01remarks 699-char remark
-
2026-06-01$95,000 Active 1 DOM
ⓘ Source: listings_history table (triggers on properties + properties_extension) + one-shot
backfill from property_details.listing_events for pre-trigger history.
Climate risk First Street
- Flood 1/10 Low FEMA zone X (unshaded) · 0% chance over 30 yrs
- Wildfire 3/10 Moderate
- Heat 3/10 Moderate 7 d/yr ≥96°F today · 14 d/yr by 30 yrs out
- Wind 1/10 Low
- Air quality 4/10 Moderate 3 unhealthy d/yr today · 5 by 30 yrs out
Nearby sold comps map
Loading sold comps map…
Walkable amenities ~0.75 mi
Loading nearby amenities…
Taxation est. · year 1
- Rental income
- $17,388
- − Mortgage interest
- −$4,761
- − Property taxes
- −$1,275
- − Insurance
- −$425
- − Repairs & maintenance
- −$1,391
- − Management
- −$1,391
- − HOA
- −$7,860
- − Depreciation
- −$2,473
- Taxable loss
- −$2,188
- Est. tax savings @ 24.0%
- +$525
- After-tax cash flow
- $-647/yr
For passive investors: Depreciation is non-cash, so a rental often shows a tax loss while cash-flowing — sheltering income. Rental losses are passive: they offset passive income freely, and up to $25,000/yr can offset ordinary (W-2) income if you actively participate and your MAGI is under $100k (phasing out to $0 by $150k); unused losses carry forward. On sale, claimed depreciation is recaptured at up to 25%, and gains may owe capital-gains tax (a 1031 exchange can defer both). Figures are a year-1 estimate at your 24.0% rate — not tax advice; consult a CPA.
Condition & rehab AI · 1 photo
This well-maintained 3-bedroom, 2-bath manufactured home is ready for a fresh coat of paint and updated fixtures to enhance its curb appeal and resale value.
Repairs flagged
- Minor Kitchen cabinets — Aesthetic update needed
- Minor Bathroom fixtures — Update needed for style
Value-add opportunities
- Both Paint exterior — Enhances curb appeal and resale value
- Both Replace carpet — Improves comfort and aesthetics
- Resale Update kitchen cabinets — Modernizes the space and adds value
- Resale Update bathroom fixtures — Modernizes the space and adds value
Renovation cost estimate screening
| Repair item | Severity | Est. cost |
|---|---|---|
| Kitchen cabinets · Aesthetic update needed | Minor | $500–3,000 |
| Bathroom fixtures · Update needed for style | Minor | $500–3,000 |
| Total estimated repair cost · 2 items | $1,000–6,000 |
Value-add ROI direction
- Both Paint exterior — Enhances curb appeal and resale value ↑
- Both Replace carpet — Improves comfort and aesthetics ↑
- Resale Update kitchen cabinets — Modernizes the space and adds value ↑
- Resale Update bathroom fixtures — Modernizes the space and adds value ↑
ⓘ Cost ranges are severity-bucket heuristics (US national rule-of-thumb). Get contractor quotes + a written scope before underwriting a rehab budget.
Schools (NCES district)
- District
- East China School District
- NCES district ID
- 2612420
- Math proficiency
- 32% ▼ -9.00%
- Reading proficiency
- 46% ▼ -8.00%
- Median HH income
- $56,455
- Composite
- 34.23/100
- National rank
- #5260
- State rank
- #208 of 540 in MI
Livability — Columbus
No livability data for this city. (Only ~50 U.S. cities are tracked.)
Census & demographics
- Population (ZIP)
- 4,106
Population outlook (St. Clair County) Hauer SSP2
- Today (2025)
- 154,587 people
- By 2030
- 150,031 · -2.9%
- By 2040
- 138,177 · -10.6%
- By 2050
- 124,390 · -19.5%
- By 2075
- 95,825 · -38.0%
- By 2100
- 68,672 · -55.6%
Race, ethnicity, and origin ACS 2023
- Neighborhood character
- Predominantly White (92%)
- Race & ethnicity
- White 92% Two or more races 6% Black 1%
- Common ancestry
- Romanian 15% Lithuanian 4% Slovak 2%
- Foreign-born
- 1%
- Languages at home
- 96% English-only · Russian/Polish/Slavic 2% Arabic 1%
Political lean MEDSL · St. Clair
- 2024 margin
- Solid R (+34.6) · D 32.0% · R 66.6% · Other 1.4%
- 2008→2024 swing
- -37.3pp toward R · 2008: 2.6pp · 2024: -34.6pp
- All cycles
- 2024: R+34.6 2020: R+30.2 2016: R+31.4 2012: R+7.1 2008: D+2.6
Not yet ingested
- Civics
- —
Market trends
- HPI YoY
- ▼ -149.87%
- Current HPI
- 153.779
- Rent YoY
- —
- Metro
- —
- State GDP YoY
- ▲ 1.37%
- F500 in state
- 28
Industry mix (Fortune 500 HQ in MI)
| Industry | F500 HQs | Revenue |
|---|---|---|
| Automotive Parts | 3 | $48B |
|
||
| Automotive | 2 | $372B |
|
||
| Chemicals | 1 | $45B |
|
||
| Automotive Retail | 1 | $29B |
|
||
| Healthcare / Medical Devices | 1 | $23B |
|
||
| Automotive Technology | 1 | $20B |
|
||
Price history
+0.0% since first listed2 events — show timeline
- 2026-05-31 Listed $95,000 REALCOMP
- 2026-05-31 Listed $95,000 MiRealSource-MiMLS
Cash-flow waterfall
monthlySold comps — $/sqft
last 12 mo · ≤1 miLoading sold comps…