 Triplex
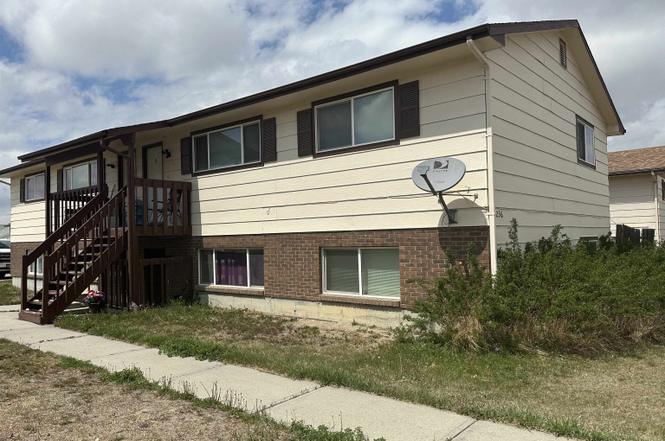
236 Curtis Ave · Evansville, WY
Flood risk 1/10 · Minimal
- FEMA flood zone
- X (shaded)
- Chance of flooding over 30 yrs
- 0.0%
- Est. flood insurance / yr
- $473 – $860
Fire risk 6/10 · Moderate
- Est. fire insurance / yr
- $564 – $1,046
Heat risk 3/10 · Minor
- Hot days now (above 92°F)
- 7 days/yr
- Hot days in 30 yrs
- 19 days/yr
Wind risk 1/10 · Minimal
- Chance of severe wind over 30 yrs
- —
Air-quality risk 2/10 · Minimal
- Unhealthy air days now
- 1 days/yr
- Unhealthy air days in 30 yrs
- 1 days/yr
Risk factors via First Street. Map © Google.
Why this score? — see what drove the D grade
The composite is a weighted blend of 9 inputs, each scored 0–100. Each bar is that input's sub-score; the figure is the points it added to the 100-point composite (weight × sub-score).
- Cash flow +12.5/30.0
- ARV discount +12.2/15.0
- Schools +4.2/10.0
- DSCR +3.7/10.0
- Livability +3.4/5.0
- 1% rule +2.5/10.0
- Rent growth +2.5/5.0
- Condition / age +2.5/5.0
- Appreciation +0.0/10.0
$400,000
🖨 Deal sheet 📄 Offer letter ✓ Due diligence
Multi-family units
County records classify this as Multi-Family (5+ Unit). Listing-text estimate: 3 units. estimate disagrees with records
5+ unit building — per-unit beds/baths from public records are typically unavailable; the breakdown below (if shown) is an estimate from the listing text.
Key facts
- Easy access
- One bathroom
- Two-bedroom
Tags
Property features AI
Finance
- Other: Listed by 5150 Realty, LLC
- Financial info: Annual tax amount reported
Exterior
- Utilities: Public water; Public sewer
- Home design: Residential income property; Quadruplex (four-unit building)
- Exterior features: Lot in Hollandswrt subdivision; Lot size approximately 0.15 acres
Interior
- Kitchen: Dishwasher; Range; Oven; Refrigerator
- Heating & cooling: Electric heating
- Interior features: Dishwasher; Refrigerator; Range; Oven; Electric heating
Neighborhood map
What this means for you Summary
Snapshot
- This is a 3 × 1-bed/?-bath units multifamily listed at $400k.
Deal economics
- At list price, monthly cash flow is $-61 ($-728/yr) — negative. Per door: $-20/mo.
- To cash-flow at today's rent, offer at most $389k (2.7% below list).
- To meet the 1% rule (rent ≥ 1% of price), the offer needs to be $300k (25.1% below list).
- Recommended offer: $300k (25.1% below list) — sets the bar for 1% rule.
- Cap rate 6.1% vs local median 10.1% in Evansville — below-typical yield; the buyer is paying a premium for something (appreciation thesis, condition, location) that the cap rate doesn't capture.
Location & tenants
- Location reads 68/100 on livability (#51 in WY) — a middle-class / working-renter tenant base. Strengths: crime A+, cost of living A+, housing A+; Watch: schools D, amenities F, commute F.
- Natrona County School District #1 (urban): math 44% / reading 52% proficiency, ranked #32 of 41 in WY (top 78%) — families likely to look elsewhere, expect single-tenant / working-renter base with shorter leases.
- Market conditions: 45 active listings in the ZIP; 310 units permitted in Natrona County in 2024 (104 in 5+ unit buildings).
Forward outlook
- Local home prices are declining (-3.0%/yr); year-one equity from $3k of loan paydown is wiped out by about $12k of value loss. Plan a longer hold.
- Natrona County population projected at +46% by 2050 — long-run rental-demand tailwind backs the buy-and-hold thesis.
Negotiation context
- It's been on market 29 days — a 2% lower offer ($394k) is reasonable based on typical stale-listing flexibility.
- 2 sale attempts with the ask held roughly flat each time — persistent listings suggest the price (not the market) is what's stuck; bring a comps-based counter.
Risks & watch-outs
- Climate carrying-cost: major wildfire risk — expect insurance premiums to compound above CPI over the hold.
Questions for the listing agent
- What do current leases actually rent for vs. the listed asking? Can we see a recent rent roll and the last 12 months of T-12 income?
- Can we see the unit-by-unit rent roll, current vacancy, and any below-market leases? What's the average tenancy length?
- What capital expenditures (roof, boiler, parking lot, exteriors) have been made in the last 5 years, and what's planned in the next 2?
- Built in 1979 — when were the roof, HVAC, electrical panel, plumbing, and water heater last replaced?
- Is there a deadline driving the sale (1031 exchange, divorce, estate, relocation)? That informs how much negotiation room exists.
- Schools are D-rated, which usually means shorter tenancies and higher turnover. Who's the typical renter profile here, and what's been the actual vacancy rate?
- The area grade is low — what's the realistic commute time and amenity access for the typical tenant pool here? Any planned neighborhood developments (good or bad) we should know about?
- What's the average days-on-market for RENTAL listings here right now (not sales)? A rising rental-DOM trend means longer vacancies and softer asking-rent achievability than the comps imply.
- What's the recent tenant-quality profile in this submarket — average credit score on applications, eviction rate, late-payment / NSF rate, and stable-employment percentage? A property-management company in the area should have these aggregated.
- How much new apartment / multifamily construction is in the pipeline within 1–3 miles? Heavy new supply (>2% of stock underway) typically softens rents 12–24 months out; light construction supports rent growth.
Investment metrics
- 1% rule
- 0.75% ✗
- Cap rate
- 6.11%
- Cash-on-cash
- -0.65%
- DSCR
- 0.97
- GRM
- 11.1
CMA / ARV
- ARV (median comp)
- $447,053
- List price
- $400,000
- Delta
- -10.53%
- Verdict
- UNDERPRICED
- Comps
- 2 within 1.0 mi
Projected returns pro-forma
-3.0% appreciation · 3.0% rent growth · sell at horizon
- IRR
- -17.4%
- Equity multiple
- 0.39×
- Total profit
- $-68,843
- Equity at exit
- $59,641
- IRR
- -9.5%
- Equity multiple
- 0.41×
- Total profit
- $-65,581
- Equity at exit
- $34,585
Cash invested: $112,000 (down + closing). Projections, not guarantees.
Landlord ↔ Tenant lean methodology
- Overall (STATE)
- 90 Strongly Landlord-Friendly
- State Wyoming
- 90 Strongly Landlord-Friendly · R+25
- County
- — inherits STATE
- City
- — inherits STATE
ZIP-level market 82636
- Home prices YoY
- -24.9%
- Active inventory
- 45
- Price-to-rent
- 33.4×
Monthly cashflow live
- Estimated rent
- $2,996 medium interval (Pro) →
- Mortgage (P&I)
- −$2,098
- Tax from tax record
- −$163 /mo · $1,958/yr
- Insurance
- −$167
- HOA
- −$0
- Vacancy / Maint / Mgmt
- −$629
- Net cashflow
- $-61
Break-even live
3-unit breakdown (identical units grouped — click to expand)
| Units | Beds | Baths | Est. rent |
|---|---|---|---|
| 3× units | 1 | — | $2,997 |
| #1 | 1 | — | $999 |
| #2 | 1 | — | $999 |
| #3 | 1 | — | $999 |
| Total (3 units) | $2,996 | ||
UW: 25.0% down · 7.5% · 30yr · 1.5% tax · 5.0% vac · 8.0% maint · 8.0% mgmt
Financing live
Cash to close
- Down payment
- $100,000
- Closing costs
- $12,000
- Reserves months
- —
- Total cash needed
- —
Loan-product check · same deal, 3 products live
Conventional
25% down · 7.5% · 30yr
- Down + closing
- —
- Monthly P&I
- —
- Monthly cashflow
- —
- DSCR
- —
- Eligible?
- —
Personal DTI + credit; lowest rate.
DSCR
20% down · 8.5% · 30yr
- Down + closing
- —
- Monthly P&I
- —
- Monthly cashflow
- —
- DSCR
- —
- Eligible?
- —
No personal income docs; deal must DSCR.
Hard money
10% down · 12.0% · 12mo
- Down + closing
- —
- Monthly P&I
- —
- Monthly cashflow
- —
- DSCR
- —
- Eligible?
- —
Short-term bridge; refi at stabilization.
Listing history 7 events
-
2026-06-19days on market $400,000 Active 29 DOM
-
2026-06-18days on market $400,000 Active 28 DOM
-
2026-06-17days on market $400,000 Active 27 DOM
-
2026-06-17days on market $400,000 Active 26 DOM
-
2026-06-15statusdays on market $400,000 Active 25 DOM
-
2026-04-23$400,000 Active 374-char remark
-
2009-09-18soldstatus
ⓘ Source: listings_history table (triggers on properties + properties_extension) + one-shot
backfill from property_details.listing_events for pre-trigger history.
Tax reassessment forecast WY · Resets to sale price
- Current annual tax
- $1,958 · $163/mo
- Projected year-2 tax
- $2,440 · $203/mo
- Expected delta
- +$482/yr (+$40/mo · 24.6%)
ⓘ Screening estimate from a state-policy table — verify with the county assessor before closing.
Climate risk First Street
- Flood 1/10 Low FEMA zone X (shaded) · 0% chance over 30 yrs
- Wildfire 6/10 Major
- Heat 3/10 Moderate 7 d/yr ≥92°F today · 19 d/yr by 30 yrs out
- Wind 1/10 Low
- Air quality 2/10 Low 1 unhealthy d/yr today · 1 by 30 yrs out
Nearby sold comps map
Loading sold comps map…
Walkable amenities ~0.75 mi
Loading nearby amenities…
Taxation est. · year 1
- Rental income
- $35,952
- − Mortgage interest
- −$22,406
- − Property taxes
- −$1,958
- − Insurance
- −$2,000
- − Repairs & maintenance
- −$2,876
- − Management
- −$2,876
- − Depreciation
- −$11,636
- Taxable loss
- −$7,801
- Est. tax savings @ 24.0%
- +$1,872
- After-tax cash flow
- $1,144/yr
For passive investors: Depreciation is non-cash, so a rental often shows a tax loss while cash-flowing — sheltering income. Rental losses are passive: they offset passive income freely, and up to $25,000/yr can offset ordinary (W-2) income if you actively participate and your MAGI is under $100k (phasing out to $0 by $150k); unused losses carry forward. On sale, claimed depreciation is recaptured at up to 25%, and gains may owe capital-gains tax (a 1031 exchange can defer both). Figures are a year-1 estimate at your 24.0% rate — not tax advice; consult a CPA.
Schools (NCES district)
- District
- Natrona County School District #1
- NCES district ID
- 5604510
- Math proficiency
- 44% ▼ -4.00%
- Reading proficiency
- 52% ▼ -2.00%
- Median HH income
- $55,217
- Composite
- 41.6/100
- National rank
- #3437
- State rank
- #32 of 41 in WY
Livability — Evansville
- Score
- 68/100
- State rank
- #51
- US rank
- #9711
Category grades
Schools grade is shown separately in the Schools card above.
Census & demographics
- Census place
- Evansville, WY
- Population (ZIP)
- 3,856
Population outlook (Natrona County) Hauer SSP2
- Today (2025)
- 98,530 people
- By 2030
- 107,084 · +8.7%
- By 2040
- 124,838 · +26.7%
- By 2050
- 143,617 · +45.8%
- By 2075
- 192,378 · +95.2%
- By 2100
- 228,435 · +131.8%
Race, ethnicity, and origin ACS 2023
- Neighborhood character
- Predominantly White (78%)
- Race & ethnicity
- White 78% Hispanic / Latino 15% Two or more races 10% Asian 2% Black 1%
- Hispanic origin (detail)
- Mexican 8%
- Common ancestry
- Portuguese 4% Slovak 2% Italian 1%
- Foreign-born
- 4% · Canada
- Languages at home
- 91% English-only · Spanish 6% Other Asian/Pacific 2%
Political lean MEDSL · Natrona
- 2024 margin
- Solid R (+48.6) · D 24.8% · R 73.5% · Other 1.7%
- 2008→2024 swing
- -14.3pp toward R · 2008: -34.4pp · 2024: -48.6pp
- All cycles
- 2024: R+48.6 2020: R+47.6 2016: R+52.2 2012: R+41.1 2008: R+34.4
Not yet ingested
- Civics
- —
Market trends
- HPI YoY
- ▼ -64.77%
- Current HPI
- 195.2252
- Rent YoY
- —
- Metro
- —
- State GDP YoY
- —
- F500 in state
- 0
Price history
3 events — show timeline
- 2026-06-14 Relisted — WMLS
- 2026-04-23 Listed $400,000 WMLS
- 2009-09-18 Sold (Public Records) — Public Records
Property tax history
+5.9%/yrLatest (2025): $1,958 · +1.6% YoY. Source: county tax records.
Cash-flow waterfall
monthlySold comps — $/sqft
last 12 mo · ≤1 miLoading sold comps…