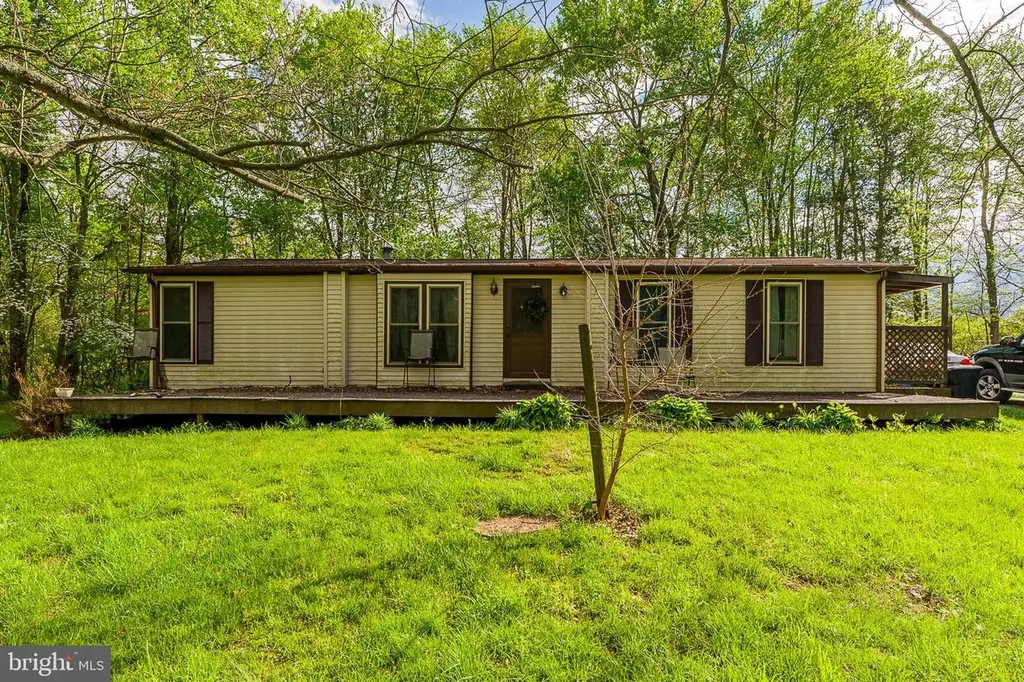
1310 Old Quaker Rd · Newberry, PA
Flood risk 1/10 · Minimal
- FEMA flood zone
- X (unshaded)
- Chance of flooding over 30 yrs
- 0.0%
- Est. flood insurance / yr
- $473 – $860
Fire risk 3/10 · Minor
- Est. fire insurance / yr
- $511 – $949
Heat risk 5/10 · Moderate
- Hot days now (above 100°F)
- 7 days/yr
- Hot days in 30 yrs
- 15 days/yr
Wind risk 3/10 · Minor
- Chance of severe wind over 30 yrs
- 6.0%
Air-quality risk 3/10 · Minor
- Unhealthy air days now
- 2 days/yr
- Unhealthy air days in 30 yrs
- 4 days/yr
Risk factors via First Street. Map © Google.
Why this score? — see what drove the F grade
The composite is a weighted blend of 9 inputs, each scored 0–100. Each bar is that input's sub-score; the figure is the points it added to the 100-point composite (weight × sub-score).
- ARV discount +7.5/15.0
- Cash flow +7.0/30.0
- Schools +4.1/10.0
- Rent growth +2.5/5.0
- Livability +2.5/5.0
- Condition / age +2.5/5.0
- 1% rule +2.0/10.0
- DSCR +1.2/10.0
- Appreciation +0.0/10.0
$199,000
🖨 Deal sheet 📄 Offer letter ✓ Due diligence
Listing remarks
SHORT NOTICE AUCTION June 3rd at 5:30 p. m. Single family detached Double wide home on 3.87 acres. The main floor has 1,300+ sq ft w/ primary Bedroom / en-suite bath, 2 guest Bedrooms, 1 guest bath, kitchen, open format dining / living room w/ wood burning fireplace and a laundry room. The basement has 1,291 sq ft and is partially refinished w/ kitchen / dining area, living / family room, 2BRs, bathroom and laundry room. There is also a storage / utility room with exterior stair access. 200 Amp electric, on-site water and on-site septic w/ sand mound, propane forced hot air, central air on main floor. Basement has electric baseboard heat. House needs interior and exterior renovations.
Key facts
- 3.78 acre lot
- 4 parking spots
- Built 1989
Property features AI
Finance
- Other: Year built source: Assessor
Exterior
- Parking: Driveway parking (4 spaces); Total garage and parking spaces: 4
- Utilities: Well water; On-site septic; Municipal trash service
- Home design: Detached property; Finished area above grade approximately 1,431; Finished below-grade area approximately 1,291; Total below-grade area approximately 2,582; Ownership: Fee simple; Property condition: Average
- Construction: Vinyl siding; Aluminum siding; Permanent foundation
- Exterior features: Deck(s); Shed; Partially finished basement; Not in a federal flood zone
Interior
- Kitchen: Built-in microwave; Dishwasher; Electric oven/range; Refrigerator
- Bedrooms: Three bedrooms on main level; Two bedrooms on lower level
- Flooring: Carpet; Vinyl
- Bathrooms: Three full bathrooms (two on main level, one on lower level)
- Heating & cooling: Central air conditioning (electric); Forced air heating; Electric baseboard heating; Propane (leased) heating; Electric hot water; 200+ amp electric service
- Interior features: Second kitchen; Combination dining/living area; Combination kitchen/dining area; Entry-level bedroom; Master bath(s); Sliding glass door
- Laundry & utility: Laundry on main floor; Laundry in basement
Neighborhood map
What this means for you Summary
Snapshot
- This is a 3-bed/2.0-bath manufactured listed at $199k.
Deal economics
- At list price, monthly cash flow is $-289 ($-3k/yr) — negative.
- To cash-flow at today's rent, offer at most $148k (25.7% below list).
- To meet the 1% rule (rent ≥ 1% of price), the offer needs to be $140k (29.6% below list).
- Recommended offer: $140k (29.6% below list) — sets the bar for 1% rule.
Location & tenants
- Location reads: area grade F — affects rentability + tenant quality, not the cash-flow math above.
- West Shore SD (suburban): math 37% / reading 56% proficiency, ranked #222 of 539 in PA (top 41%) — families likely to look elsewhere, expect single-tenant / working-renter base with shorter leases.
- Zoned schools: Newberry El Sch (math 32% / reading 47%, grade F, #947 of 1,518 statewide, top 65%, 262 students, 54% FRL); Allen Ms (math 29% / reading 59%, grade D, #202 of 512 statewide, top 40%, 477 students, 42% FRL); Red Land Shs (math 56% / reading 75%, grade B, #65 of 437 statewide, top 15%, 1,101 students, 27% FRL) — zoned schools average 41% FRL vs 25% district-wide (15 pts higher); higher-poverty schools than district average — tighter screening recommended.
- Market conditions: 45 active listings in the ZIP; 1 comparable units currently listed for rent nearby; 1,328 units permitted in York County in 2024 (338 in 5+ unit buildings).
Forward outlook
- Local home prices are declining (-3.0%/yr); year-one equity from $1k of loan paydown is wiped out by about $6k of value loss. Plan a longer hold.
Negotiation context
- It's been on market 37 days — a 3% lower offer ($193k) is reasonable based on typical stale-listing flexibility.
- Current owner paid $22k; list at $199k implies a 826% gain — meaningful room to come down on a strong offer.
Risks & watch-outs
- Climate carrying-cost: extreme-heat days projected 7→15/yr by 2055 (HVAC capex compounding) — expect insurance premiums to compound above CPI over the hold.
Questions for the listing agent
- What do current leases actually rent for vs. the listed asking? Can we see a recent rent roll and the last 12 months of T-12 income?
- It's been on market 37 days. Have you received any prior offers? Is the seller open to a 30% concession, seller financing, or rate buy-down credit?
- Is there a deadline driving the sale (1031 exchange, divorce, estate, relocation)? That informs how much negotiation room exists.
- The area grade is low — what's the realistic commute time and amenity access for the typical tenant pool here? Any planned neighborhood developments (good or bad) we should know about?
- What's the average days-on-market for RENTAL listings here right now (not sales)? A rising rental-DOM trend means longer vacancies and softer asking-rent achievability than the comps imply.
- What's the recent tenant-quality profile in this submarket — average credit score on applications, eviction rate, late-payment / NSF rate, and stable-employment percentage? A property-management company in the area should have these aggregated.
- How much new for-sale + rental construction is in the pipeline within 1–3 miles? Heavy new supply typically softens prices + rents 12–24 months out; constrained supply supports both.
Investment metrics
- 1% rule
- 0.70% ✗
- Cap rate
- 4.55%
- Cash-on-cash
- -6.23%
- DSCR
- 0.72
- GRM
- 11.8
CMA / ARV
- ARV (median comp)
- $439,660
- List price
- $199,000
- Delta
- -54.74%
- Verdict
- UNDERPRICED
- Comps
- 4 within 1.0 mi
Projected returns pro-forma
-3.0% appreciation · 3.0% rent growth · sell at horizon
- IRR
- -27.0%
- Equity multiple
- 0.09×
- Total profit
- $-50,629
- Equity at exit
- $29,672
- IRR
- -24.6%
- Equity multiple
- -0.21×
- Total profit
- $-67,664
- Equity at exit
- $17,206
Cash invested: $55,720 (down + closing). Projections, not guarantees.
Landlord ↔ Tenant lean methodology
- Overall (STATE)
- 62 Landlord-Friendly
- State Pennsylvania
- 62 Landlord-Friendly · EVEN
- County
- — inherits STATE
- City
- — inherits STATE
ZIP-level market 17319
- Home prices YoY
- -20.2%
- Active inventory
- 45
- Price-to-rent
- 11.8×
Monthly cashflow live
- Estimated rent
- $1,400 medium interval (Pro) →
- Mortgage (P&I)
- −$1,044
- Tax from tax record
- −$269 /mo · $3,224/yr
- Insurance
- −$83
- HOA
- −$0
- Vacancy / Maint / Mgmt
- −$294
- Net cashflow
- $-289
Break-even live
UW: 25.0% down · 7.5% · 30yr · 1.5% tax · 5.0% vac · 8.0% maint · 8.0% mgmt
Financing live
Cash to close
- Down payment
- $49,750
- Closing costs
- $5,970
- Reserves months
- —
- Total cash needed
- —
Loan-product check · same deal, 3 products live
Conventional
25% down · 7.5% · 30yr
- Down + closing
- —
- Monthly P&I
- —
- Monthly cashflow
- —
- DSCR
- —
- Eligible?
- —
Personal DTI + credit; lowest rate.
DSCR
20% down · 8.5% · 30yr
- Down + closing
- —
- Monthly P&I
- —
- Monthly cashflow
- —
- DSCR
- —
- Eligible?
- —
No personal income docs; deal must DSCR.
Hard money
10% down · 12.0% · 12mo
- Down + closing
- —
- Monthly P&I
- —
- Monthly cashflow
- —
- DSCR
- —
- Eligible?
- —
Short-term bridge; refi at stabilization.
Rent comps 1 comps
| Address | Beds | Baths | Sqft | Rent | $/sqft | DOM | Units | Dist |
|---|---|---|---|---|---|---|---|---|
| 1660 Bamberger Rd Etters, PA | 2.0 | 1.0 | 1100 | $1,400 | $1.27 | 14d | 1 | 1.46mi |
Listing history 18 events
-
2026-06-18days on market $199,000 Active 37 DOM
-
2026-06-17days on market $199,000 Active 36 DOM
-
2026-06-16days on market $199,000 Active 35 DOM
-
2026-06-15price $199,000 Active 34 DOM
-
2026-06-15days on market $245,000 Active 34 DOM
-
2026-06-14days on market $245,000 Active 32 DOM
-
2026-06-10days on market $245,000 Active 29 DOM
-
2026-06-09days on market $245,000 Active 28 DOM
-
2026-06-08days on market $245,000 Active 27 DOM
-
2026-06-07days on market $245,000 Active 26 DOM
-
2026-06-05pricedays on market $245,000 Active 23 DOM
-
2026-06-03days on market $225,000 Active 22 DOM
-
2026-06-02days on market $225,000 Active 21 DOM
-
2026-06-01pricedays on market $225,000 Active 20 DOM
-
2026-05-31days on market $275,000 Active 19 DOM
-
2026-05-31days on market $275,000 Active 18 DOM
-
2026-05-12$315,000 Active 694-char remark
-
1988-08-09soldstatus $21,500
ⓘ Source: listings_history table (triggers on properties + properties_extension) + one-shot
backfill from property_details.listing_events for pre-trigger history.
Tax reassessment forecast PA · Partial reset (capped growth)
- Current annual tax
- $3,224 · $269/mo
- Projected year-2 tax
- $3,224 · $269/mo
- Expected delta
- $0/yr ($0/mo · 0.0%)
ⓘ Screening estimate from a state-policy table — verify with the county assessor before closing.
Climate risk First Street
- Flood 1/10 Low FEMA zone X (unshaded) · 0% chance over 30 yrs
- Wildfire 3/10 Moderate
- Heat 5/10 Major 7 d/yr ≥100°F today · 15 d/yr by 30 yrs out
- Wind 3/10 Moderate 6% chance of damaging wind over 30 yrs
- Air quality 3/10 Moderate 2 unhealthy d/yr today · 4 by 30 yrs out
Nearby sold comps map
Loading sold comps map…
Walkable amenities ~0.75 mi
Loading nearby amenities…
Taxation est. · year 1
- Rental income
- $16,800
- − Mortgage interest
- −$11,147
- − Property taxes
- −$3,224
- − Insurance
- −$995
- − Repairs & maintenance
- −$1,344
- − Management
- −$1,344
- − Depreciation
- −$5,789
- Taxable loss
- −$7,043
- Est. tax savings @ 24.0%
- +$1,690
- After-tax cash flow
- $-1,779/yr
For passive investors: Depreciation is non-cash, so a rental often shows a tax loss while cash-flowing — sheltering income. Rental losses are passive: they offset passive income freely, and up to $25,000/yr can offset ordinary (W-2) income if you actively participate and your MAGI is under $100k (phasing out to $0 by $150k); unused losses carry forward. On sale, claimed depreciation is recaptured at up to 25%, and gains may owe capital-gains tax (a 1031 exchange can defer both). Figures are a year-1 estimate at your 24.0% rate — not tax advice; consult a CPA.
Schools (NCES district)
- District
- West Shore SD
- NCES district ID
- 4225830
- Math proficiency
- 37% ▼ -12.00%
- Reading proficiency
- 56% ▼ -10.00%
- Median HH income
- $61,398
- Composite
- 40.9/100
- National rank
- #3617
- State rank
- #222 of 539 in PA
Livability — Newberry
No livability data for this city. (Only ~50 U.S. cities are tracked.)
Census & demographics
- Population (ZIP)
- 10,990
Population outlook (York County) Hauer SSP2
- Today (2025)
- 454,205 people
- By 2030
- 457,407 · +0.7%
- By 2040
- 457,529 · +0.7%
- By 2050
- 448,261 · -1.3%
- By 2075
- 427,388 · -5.9%
- By 2100
- 384,218 · -15.4%
Race, ethnicity, and origin ACS 2023
- Neighborhood character
- Predominantly White (94%)
- Race & ethnicity
- White 94% Two or more races 3% Hispanic / Latino 2%
- Common ancestry
- Romanian 6% Polish 5% Lithuanian 2%
- Foreign-born
- 1% · Canada
- Languages at home
- 98% English-only · Spanish 1%
Political lean MEDSL · York
- 2024 margin
- Strong R (+25.3) · D 36.9% · R 62.1%
- 2008→2024 swing
- -11.7pp toward R · 2008: -13.6pp · 2024: -25.3pp
- All cycles
- 2024: R+25.3 2020: R+24.6 2016: R+29.3 2012: R+21.2 2008: R+13.6
Not yet ingested
- Civics
- —
Market trends
- HPI YoY
- ▼ -68.02%
- Current HPI
- 268.9557
- Rent YoY
- —
- Metro
- —
- State GDP YoY
- ▲ 1.68%
- F500 in state
- 34
Industry mix (Fortune 500 HQ in PA)
| Industry | F500 HQs | Revenue |
|---|---|---|
| Healthcare | 2 | $309B |
|
||
| Insurance | 2 | $27B |
|
||
| Telecommunications / Media | 1 | $124B |
|
||
| Industrial Distribution | 1 | $22B |
|
||
| Financial Services | 1 | $20B |
|
||
| Chemicals / Materials | 1 | $18B |
|
||
Price history
+825.6% since first listed7 events — show timeline
- 2026-06-15 Price Changed $199,000 BRIGHT MLS
- 2026-06-15 Price Changed $225,000 BRIGHT MLS
- 2026-06-04 Price Changed $245,000 BRIGHT MLS
- 2026-06-01 Price Changed $225,000 BRIGHT MLS
- 2026-05-26 Price Changed $275,000 BRIGHT MLS
- 2026-05-12 Listed $315,000 BRIGHT MLS
- 1988-08-09 Sold (Public Records) $21,500 Public Records
Property tax history
+3.7%/yrLatest (2026): $3,224 · +5.8% YoY. Source: county tax records.
Cash-flow waterfall
monthlySold comps — $/sqft
last 12 mo · ≤1 miLoading sold comps…