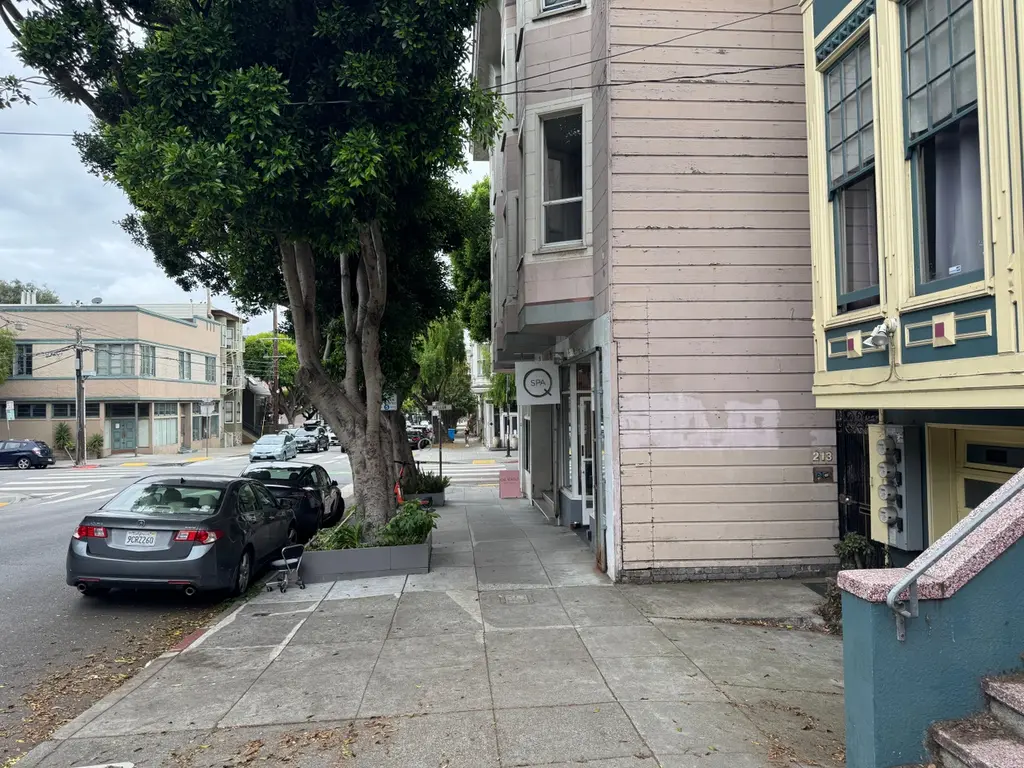
211 Steiner St · San Francisco, CA
Flood risk No data
- FEMA flood zone
- —
- Chance of flooding over 30 yrs
- —
- Est. flood insurance / yr
- —
Fire risk No data
- Est. fire insurance / yr
- —
Heat risk No data
- Hot days now (above threshold)
- —
- Hot days in 30 yrs
- —
Wind risk No data
- Chance of severe wind over 30 yrs
- —
Air-quality risk No data
- Unhealthy air days now
- —
- Unhealthy air days in 30 yrs
- —
Risk factors via First Street. Map © Google.
Why this score? — see what drove the A- grade
The composite is a weighted blend of 9 inputs, each scored 0–100. Each bar is that input's sub-score; the figure is the points it added to the 100-point composite (weight × sub-score).
- Cash flow +30.0/30.0
- 1% rule +10.0/10.0
- DSCR +10.0/10.0
- Appreciation +9.6/10.0
- ARV discount +7.5/15.0
- Rent growth +5.0/5.0
- Schools +5.0/10.0
- Condition / age +4.0/5.0
- Livability +3.8/5.0
$213,000
🖨 Deal sheet (PDF) 📄 Offer letter ✓ Due diligence
Listing remarks
Business For Sale – Turnkey Salon in Prime Location This well-established and vibrant salon offers a rare turnkey opportunity for entrepreneurs and beauty professionals alike. Time-honored and highly regarded in the community, this business is ideally positioned for someone ready to continue its success or introduce a fresh new concept. Services offered include, but are not limited to: Nails Waxing Massage Skin treatments The salon has been expertly managed and benefits from affordable lease terms, making it an excellent opportunity for both experienced operators and first-time owners. With a strong foundation already in place, the business presents significant potential for growth an
Neighborhood map
What this means for you Summary
Snapshot
- This is a condo listed at $213k. Condition is rated good.
Deal economics
- At list price, monthly cash flow is $3k ($36k/yr) — positive.
- The deal already cash-flows at list — no discount required.
- Meets the 1% rule at list price ($6k rent vs $213k).
- Recommended offer: $194k (9.0% below list) — sets the bar for market timing.
- Cap rate 23.2% vs local median 2.1% in San Francisco — top-decile yield for the area; either an underpriced asset or a hidden risk that comps aren't pricing in. Stress-test before assuming the spread holds.
Location & tenants
- Location reads 76/100 on livability (#90 in CA, #3,143 nationally) — a middle-class / working-renter tenant base. Strengths: amenities A+, commute A+, employment A+; Watch: crime F, cost of living F.
- San Francisco Unified (urban): math 50% / reading 56% proficiency, ranked #322 of 1,400 in CA (top 23%) — acceptable for families but not a draw, mixed tenant base, ~2y average lease.
- Zoned schools: Lilienthal (Claire) Elementary (669 students, 19% FRL); Giannini (A.P.) Middle (1,192 students, 34% FRL); Lowell High (2,632 students, 37% FRL) — zoned schools average 30% FRL vs 49% district-wide (19 pts lower); this property's tenant base skews higher-income than the district average.
- Market conditions: Rents rising fast (+18.2%/yr); 74 active listings in the ZIP; 40 comparable units currently listed for rent nearby; rentals at typical pace (median 16d on market — plan ~3-4 weeks tenant-placement turnaround); high-income renter base; 750 units permitted in San Francisco County in 2024 (688 in 5+ unit buildings).
- This rent runs 45% of the median local income ($167k/yr) — at the standard rent-burdened threshold; future hikes will face affordability resistance.
Forward outlook
- In year one you build about $21k of equity ($1k loan paydown + $20k appreciation (9.3% local appreciation)).
- San Francisco County population projected at +39% by 2050 — long-run rental-demand tailwind backs the buy-and-hold thesis.
- At projected returns (9.3% appreciation + 8.0% rent growth), your $60k cash investment doubles in ~2 years — after that, you're playing with house money.
- By year 2, paydown + projected appreciation supports a ~$34k cash-out refi (75% LTV) — recoverable capital for the next deal without selling this one.
Negotiation context
- It's been on market 97 days — a 9% lower offer ($194k) is reasonable based on typical stale-listing flexibility.
Questions for the listing agent
- It's been on market 97 days. Have you received any prior offers? Is the seller open to a 9% concession, seller financing, or rate buy-down credit?
- What does the HOA fee cover, when was the last increase, and are there any pending special assessments or reserve-fund shortfalls?
- Any open or pending special assessments — roof, HVAC, plumbing, elevator, façade? What's the per-unit balance and payoff schedule, and is the seller paying it off at close or rolling it to the buyer?
- Why hasn't it sold? Are there any deal-killer items the seller is aware of (foundation, flood, title, zoning, code violations)?
- Is there a deadline driving the sale (1031 exchange, divorce, estate, relocation)? That informs how much negotiation room exists.
- Schools are B-rated — typically a magnet for longer-tenancy family renters. What's the average tenant stay here, and is there a school-zone premium baked into asking?
- Crime grade is F in this area — have there been break-ins, vandalism, or insurance claims at this property in the last 3 years? What carrier currently insures it and at what premium?
- What's the average days-on-market for RENTAL listings here right now (not sales)? A rising rental-DOM trend means longer vacancies and softer asking-rent achievability than the comps imply.
- What's the recent tenant-quality profile in this submarket — average credit score on applications, eviction rate, late-payment / NSF rate, and stable-employment percentage? A property-management company in the area should have these aggregated.
- How much new apartment / multifamily construction is in the pipeline within 1–3 miles? Heavy new supply (>2% of stock underway) typically softens rents 12–24 months out; light construction supports rent growth.
Investment metrics
- 1% rule
- 2.93% ✓
- Cap rate
- 23.23%
- Cash-on-cash
- 60.49%
- DSCR
- 3.69
- GRM
- 2.8
CMA / ARV
- ARV (median comp)
- $968,888
- List price
- $213,000
- Delta
- -78.02%
- Verdict
- UNDERPRICED
- Comps
- 1 within 2.0 mi
Projected returns pro-forma
9.27% appreciation · 8.0% rent growth · sell at horizon
- IRR
- 76.5%
- Equity multiple
- 6.54×
- Total profit
- $330,366
- Equity at exit
- $180,688
- IRR
- 73.1%
- Equity multiple
- 16.13×
- Total profit
- $902,514
- Equity at exit
- $378,328
Cash invested: $59,640 (down + closing). Projections, not guarantees.
Landlord ↔ Tenant lean methodology
- Overall (CITY)
- 0 Strongly Tenant-Friendly
- State California
- 18 Strongly Tenant-Friendly · D+13
- County
- — inherits STATE
- City San Francisco
- 0 Strongly Tenant-Friendly · D+57
ZIP-level market 94117
- Home prices YoY
- 4.2%
- Rents YoY
- 18.2%
- Active inventory
- 74
- Price-to-rent
- 2.8×
Monthly cashflow live
- Estimated rent
- $6,250 high interval (Pro) →
- Mortgage (P&I)
- −$1,117
- Tax est. 1.5%
- −$266 /mo · $3,195/yr
- Insurance
- −$89
- HOA est. from 2 same-building comps
- −$459
- Vacancy / Maint / Mgmt
- −$1,312
- Net cashflow
- $3,006
Break-even live
Sensitivity live
| Price | -10% $3,154 | -5% $3,080 | +0% $3,006 | +5% $2,933 | +10% $2,859 |
|---|---|---|---|---|---|
| Rent | -10% $2,513 | -5% $2,760 | +0% $3,006 | +5% $3,253 | +10% $3,500 |
| Rate | -1.0pp $3,114 | -0.5pp $3,061 | base $3,006 | +0.5pp $2,951 | +1.0pp $2,895 |
UW: 25.0% down · 7.5% · 30yr · 1.5% tax · 5.0% vac · 8.0% maint · 8.0% mgmt
Financing live
Cash to close
- Down payment
- $53,250
- Closing costs
- $6,390
- Reserves months
- —
- Total cash needed
- —
Loan-product check · same deal, 3 products live
Conventional
25% down · 7.5% · 30yr
- Down + closing
- —
- Monthly P&I
- —
- Monthly cashflow
- —
- DSCR
- —
- Eligible?
- —
Personal DTI + credit; lowest rate.
DSCR
20% down · 8.5% · 30yr
- Down + closing
- —
- Monthly P&I
- —
- Monthly cashflow
- —
- DSCR
- —
- Eligible?
- —
No personal income docs; deal must DSCR.
Hard money
10% down · 12.0% · 12mo
- Down + closing
- —
- Monthly P&I
- —
- Monthly cashflow
- —
- DSCR
- —
- Eligible?
- —
Short-term bridge; refi at stabilization.
Rent comps 40 comps
| Address | Beds | Baths | Sqft | Rent | $/sqft | DOM | Units | Dist |
|---|---|---|---|---|---|---|---|---|
| 400 Duboce Ave San Francisco, CA | 2.0 | 1.0 | 923 | $7,475 | $8.10 | 25d | 1 | 0.16mi |
| 200 Buchanan St San Francisco, CA | 1.0–2.0 | 1.0–2.0 | 1015 | $9,680 | $9.53 | 0d | 10 | 0.30mi |
| 8 Buchanan St #609 San Francisco, CA | 2.0 | 2.0 | 990 | $6,950 | $7.02 | 9d | 1 | 0.31mi |
| 257 Church St San Francisco, CA | 2.0 | 1.0 | 1100 | $5,995 | $5.45 | 45d | 1 | 0.35mi |
| 801 Fillmore St Apt 1 San Francisco, CA | 2.0 | 1.0 | 970 | $6,195 | $6.39 | 45d | 1 | 0.41mi |
| 616 Hayes St San Francisco, CA | 2.0 | 1.0 | 983 | $5,895 | $6.00 | 23d | 1 | 0.48mi |
| 25 Baker St Unit STREET1 San Francisco, CA | 3.0 | 2.0 | 1300 | $6,500 | $5.00 | 6d | 1 | 0.49mi |
| 25 Baker St San Francisco, CA | 3.0 | 2.0 | 1300 | $6,500 | $5.00 | 4d | 1 | 0.49mi |
| 325 Octavia St San Francisco, CA | 2.0 | 1.0–2.0 | 811 | $7,563 | $9.33 | 0d | 1 | 0.50mi |
| 1543 McAllister St #3 San Francisco, CA | 1.0 | 1.0 | 1016 | $4,200 | $4.13 | 0d | 1 | 0.55mi |
| 1306 Page St San Francisco, CA | 3.0 | 2.0 | 1500 | $11,995 | $8.00 | 45d | 1 | 0.58mi |
| 1460 Golden Gate Ave Unit 10 San Francisco, CA | 2.0 | 1.0 | 900 | $5,395 | $5.99 | 45d | 1 | 0.60mi |
| 258 Dorland St Unit 7 San Francisco, CA | 2.0 | 2.0 | 1500 | $5,500 | $3.67 | 45d | 1 | 0.61mi |
| 4058 17th St #4062 San Francisco, CA | 2.0 | 2.0 | 1300 | $5,895 | $4.53 | 20d | 1 | 0.63mi |
| 47 Ford St San Francisco, CA | 2.0 | 1.5 | 1401 | $6,500 | $4.64 | 21d | 1 | 0.64mi |
| 165 States St San Francisco, CA | 2.0 | 2.0 | 1100 | $6,000 | $5.45 | 45d | 1 | 0.65mi |
| 1 Brady St San Francisco, CA | 2.0 | 1.0–2.0 | 889 | $7,373 | $8.29 | 0d | 26 | 0.65mi |
| 1600 15th St San Francisco, CA | 1.0–2.0 | 1.0–2.0 | 931 | $6,066 | $6.52 | 0d | 6 | 0.70mi |
| 542 Valencia St Unit A San Francisco, CA | 2.0 | 1.0 | 1600 | $5,000 | $3.12 | 26d | 1 | 0.72mi |
| 30 Otis St San Francisco, CA | 2.0 | 1.0–2.0 | 874 | $10,000 | $11.44 | 0d | 15 | 0.72mi |
| 140 S Van Ness Ave #1679 San Francisco, CA | 2.0 | 2.0 | 1250 | $5,760 | $4.61 | 0d | 1 | 0.74mi |
| 724 Central Ave San Francisco, CA | 2.0 | 1.0 | 1307 | $5,795 | $4.43 | 15d | 1 | 0.79mi |
| 100 Van Ness Ave #1477 San Francisco, CA | 1.0–2.0 | 1.0–2.0 | 865 | $7,990 | $9.24 | 0d | 2 | 0.80mi |
| 1475 Fillmore St San Francisco, CA | 2.0 | 1.0–2.0 | 749 | $7,483 | $9.98 | 0d | 18 | 0.81mi |
| 826 Central Ave San Francisco, CA | 3.0 | 1.0 | 1100 | $4,989 | $4.54 | 45d | 1 | 0.83mi |
| 750 Golden Gate Ave San Francisco, CA | 3.0 | 1.0–2.5 | 681 | $2,280 | $3.35 | 45d | 1 | 0.85mi |
| 2001 McAllister St San Francisco, CA | 1.0–2.0 | 1.0–2.0 | 815 | $5,500 | $6.74 | 23d | 1 | 0.86mi |
| 1436 Waller St Unit 1436 San Francisco, CA | 3.0 | 2.0 | 1800 | $6,890 | $3.83 | 45d | 1 | 0.86mi |
| 170 Eureka St San Francisco, CA | 2.0 | 1.5 | 1200 | $8,995 | $7.50 | 5d | 1 | 0.86mi |
| 8 10th St San Francisco, CA | 2.0 | 1.0–2.0 | 919 | $8,790 | $9.56 | 0d | 26 | 0.87mi |
| 4058 20th St San Francisco, CA | 3.0 | 2.0 | 1794 | $13,975 | $7.79 | 26d | 1 | 0.89mi |
| 1927-1929 Grove St Unit 1927-A San Francisco, CA | 1.0 | 1.0 | 885 | $3,995 | $4.51 | 45d | 1 | 0.92mi |
| 600 S Van Ness Ave San Francisco, CA | 2.0 | 2.0 | 1200 | $6,500 | $5.42 | 4d | 1 | 0.95mi |
| 783 Guerrero St #779 San Francisco, CA | 2.0 | 1.0 | 1008 | $4,500 | $4.46 | 9d | 1 | 0.97mi |
| 3436 19th St Unit A San Francisco, CA | 3.0 | 2.0 | 1250 | $7,225 | $5.78 | 21d | 1 | 0.98mi |
| 179 Caselli Ave Unit 2 San Francisco, CA | 3.0 | 1.0 | 950 | $3,750 | $3.95 | 7d | 1 | 0.98mi |
| 30 Washburn St San Francisco, CA | 2.0 | 2.0 | 1576 | $5,995 | $3.80 | 26d | 1 | 1.00mi |
| 30 Washburn St Unit 3 San Francisco, CA | 2.0 | 2.0 | 1576 | $5,995 | $3.80 | 9d | 1 | 1.00mi |
| 55 9th St San Francisco, CA | 2.0 | 1.0–2.0 | 833 | $5,625 | $6.75 | 0d | 1 | 1.00mi |
| 2000 Post St San Francisco, CA | 2.0 | 1.0–2.0 | 700 | $6,219 | $8.88 | 0d | 12 | 1.00mi |
HOA detail condo
- Monthly dues
- $0 · $0/yr
- Assessments
- None detected in remarks — confirm with the listing agent.
Listing history 15 events
-
2026-06-21days on market $213,000 Coming Soon 97 DOM
-
2026-06-18days on market $213,000 Coming Soon 94 DOM
-
2026-06-17days on market $213,000 Coming Soon 93 DOM
-
2026-06-16days on market $213,000 Coming Soon 92 DOM
-
2026-06-15days on market $213,000 Coming Soon 91 DOM
-
2026-06-13days on market $213,000 Coming Soon 89 DOM
-
2026-06-13days on market $213,000 Coming Soon 88 DOM
-
2026-06-09days on market $213,000 Coming Soon 85 DOM
-
2026-06-08days on market $213,000 Coming Soon 84 DOM
-
2026-06-07days on market $213,000 Coming Soon 83 DOM
-
2026-06-04days on market $213,000 Coming Soon 80 DOM
-
2026-06-03days on market $213,000 Coming Soon 79 DOM
-
2026-06-02days on market $213,000 Coming Soon 78 DOM
-
2026-06-01days on market $213,000 Coming Soon 77 DOM
-
2026-05-31days on market $213,000 Coming Soon 76 DOM
ⓘ Source: listings_history table (triggers on properties + properties_extension) + one-shot
backfill from property_details.listing_events for pre-trigger history.
Nearby sold comps map
Loading sold comps map…
Walkable amenities ~0.75 mi
Loading nearby amenities…
Taxation est. · year 1
- Rental income
- $74,999
- − Mortgage interest
- −$11,931
- − Property taxes
- −$3,195
- − Insurance
- −$1,065
- − Repairs & maintenance
- −$6,000
- − Management
- −$6,000
- − HOA
- −$5,508
- − Depreciation
- −$6,196
- Taxable income
- $35,104
- Est. tax owed @ 24.0%
- −$8,425
- After-tax cash flow
- $27,653/yr
For passive investors: Depreciation is non-cash, so a rental often shows a tax loss while cash-flowing — sheltering income. Rental losses are passive: they offset passive income freely, and up to $25,000/yr can offset ordinary (W-2) income if you actively participate and your MAGI is under $100k (phasing out to $0 by $150k); unused losses carry forward. On sale, claimed depreciation is recaptured at up to 25%, and gains may owe capital-gains tax (a 1031 exchange can defer both). Figures are a year-1 estimate at your 24.0% rate — not tax advice; consult a CPA.
Condition & rehab AI · 12 photos
This property is in good condition with minimal repairs needed. It offers a turnkey opportunity for entrepreneurs and beauty professionals, with significant potential for growth and value appreciation.
Value-add opportunities
- Resale Paint exterior siding — Fresh paint can enhance the curb appeal and make the property more attractive to potential buyers.
- Resale Clean windows — Clean windows can improve the overall appearance and make the property more attractive to potential buyers.
- Rental Update flooring — Fresh flooring can make the property more appealing to renters and improve the overall rental experience.
- Both Upgrade lighting — Upgrading lighting can improve the ambiance and make the property more attractive to both buyers and renters.
- Both Add landscaping — Adding landscaping can improve the curb appeal and make the property more attractive to both buyers and renters.
Renovation cost estimate screening
Value-add ROI direction
- Resale Paint exterior siding — Fresh paint can enhance the curb appeal and make the property more attractive to potential buyers. ↑
- Resale Clean windows — Clean windows can improve the overall appearance and make the property more attractive to potential buyers. ↑
- Rental Update flooring — Fresh flooring can make the property more appealing to renters and improve the overall rental experience. ↑
- Both Upgrade lighting — Upgrading lighting can improve the ambiance and make the property more attractive to both buyers and renters. ↑
- Both Add landscaping — Adding landscaping can improve the curb appeal and make the property more attractive to both buyers and renters. ↑
ⓘ Cost ranges are severity-bucket heuristics (US national rule-of-thumb). Get contractor quotes + a written scope before underwriting a rehab budget.
Schools (NCES district)
- District
- San Francisco Unified
- NCES district ID
- 0634410
- Math proficiency
- 50% ▬ 0.00%
- Reading proficiency
- 56% ▲ 1.00%
- Median HH income
- $81,249
- Composite
- 50.14/100
- National rank
- #4088
- State rank
- #322 of 1400 in CA
Livability — San Francisco
- Score
- 76/100
- State rank
- #90
- US rank
- #3143
Category grades
Schools grade is shown separately in the Schools card above.
Census & demographics
- Census place
- San Francisco, CA
- County
- San Francisco County · 827,552 people
- City population
- 827,552
- Metro
- San Francisco-Oakland-Berkeley, CA
- Population (ZIP)
- 36,198
- Household income
- $167,066
- Rent vs Own
- Severe rent burden
- 1811.0
Population outlook (San Francisco County) Hauer SSP2
- Today (2025)
- 1,030,936 people
- By 2030
- 1,110,409 · +7.7%
- By 2040
- 1,270,010 · +23.2%
- By 2050
- 1,435,001 · +39.2%
- By 2075
- 1,779,074 · +72.6%
- By 2100
- 1,966,767 · +90.8%
Race, ethnicity, and origin ACS 2023
- Neighborhood character
- Diverse neighborhood (Simpson 0.55)
- Race & ethnicity
- White 65% Asian 14% Two or more races 10% Hispanic / Latino 9% Black 4%
- Hispanic origin (detail)
- Mexican 5%
- Common ancestry
- Italian 5% Lithuanian 5% Romanian 3%
- Foreign-born
- 18% · Canada, China, Vietnam
- Languages at home
- 80% English-only · Spanish 5% Chinese 4% French/Haitian/Cajun 4%
Political lean MEDSL · San Francisco
- 2024 margin
- Solid D (+64.8) · D 80.3% · R 15.5% · Other 4.1%
- 2008→2024 swing
- -5.7pp toward R · 2008: 70.5pp · 2024: 64.8pp
- All cycles
- 2024: D+64.8 2020: D+72.5 2016: D+76.1 2012: D+70.2 2008: D+70.5
Not yet ingested
- Civics
- —
Market trends
- HPI YoY
- ▲ 9.27%
- Current HPI
- 228.7304
- Rent YoY
- ▲ 18.24%
- Metro
- San Francisco-Oakland-Berkeley, CA
- State GDP YoY
- ▲ 3.21%
- F500 in state
- 116
Industry mix (Fortune 500 HQ in CA)
| Industry | F500 HQs | Revenue |
|---|---|---|
| Technology | 27 | $1,492B |
|
||
| Financial Services | 3 | $174B |
|
||
| Retail | 3 | $44B |
|
||
| Insurance | 3 | $26B |
|
||
| Media / Entertainment | 2 | $115B |
|
||
| Pharmaceuticals / Biotech | 2 | $62B |
|
||
Cash-flow waterfall
monthlySold comps — $/sqft
last 12 mo · ≤1 miLoading sold comps…