18365 Hwy 52 · Kinston, AL
Flood risk 1/10 · Minimal
- FEMA flood zone
- X (unshaded)
- Chance of flooding over 30 yrs
- 0.0%
- Est. flood insurance / yr
- $507 – $1,088
Fire risk 4/10 · Minor
- Est. fire insurance / yr
- $916 – $1,700
Heat risk 8/10 · Major
- Hot days now (above 106°F)
- 7 days/yr
- Hot days in 30 yrs
- 19 days/yr
Wind risk 8/10 · Major
- Chance of severe wind over 30 yrs
- 99.0%
Air-quality risk 1/10 · Minimal
- Unhealthy air days now
- 0 days/yr
- Unhealthy air days in 30 yrs
- 0 days/yr
Risk factors via First Street. Map © Google.
Why this score? — see what drove the D+ grade
The composite is a weighted blend of 9 inputs, each scored 0–100. Each bar is that input's sub-score; the figure is the points it added to the 100-point composite (weight × sub-score).
- Cash flow +12.8/30.0
- Appreciation +7.6/10.0
- ARV discount +7.5/15.0
- DSCR +3.8/10.0
- Schools +3.0/10.0
- Livability +2.9/5.0
- 1% rule +2.5/10.0
- Rent growth +2.5/5.0
- Condition / age +2.5/5.0
$156,325
🖨 Deal sheet 📄 Offer letter ✓ Due diligence
Listing remarks MLS
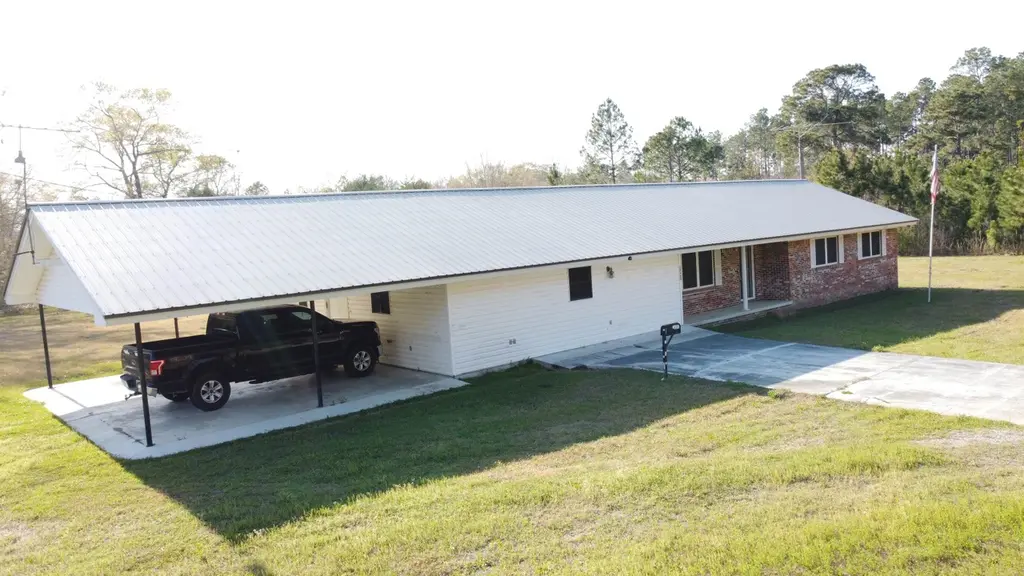
Welcome to this home situated on approximately 2.2 acres in Geneva County, within the Samson School District. Constructed with a combination of brick and vinyl siding, this property offers durability and low-maintenance living. The main residence features 3 bedrooms and 2 full bathrooms. In addition, the home includes an additional living area complete with a full bathroom, kitchen space, storage, and an open sleeping nook—suitable for guests or extended living arrangements . A 2-car attached garage features a concrete floor, and the home includes a concrete driveway for added convenience and functionality. The spacious acreage provides room for outdoor activities, gardening, or other uses.
Key facts
- Full bathroom
- Kitchen space
- 2.2 acres
Tags
Neighborhood map
What this means for you Summary
Snapshot
- This is a 3-bed/2.0-bath single-family listed at $156k.
Deal economics
- At list price, monthly cash flow is $-15 ($-184/yr) — negative.
- To cash-flow at today's rent, offer at most $154k (1.7% below list).
- To meet the 1% rule (rent ≥ 1% of price), the offer needs to be $117k (25.0% below list).
- Recommended offer: $117k (25.0% below list) — sets the bar for 1% rule.
Location & tenants
- Location reads 57/100 on livability (#382 in AL) — a working-class tenant base; expect higher turnover. Strengths: cost of living A+, housing B; Watch: schools D+, health & safety D, crime F.
- Geneva County (rural): math 22% / reading 51% proficiency, ranked #39 of 129 in AL (top 30%) — families likely to look elsewhere, expect single-tenant / working-renter base with shorter leases.
- Market conditions: 24 active listings in the ZIP; 39 units permitted in Geneva County in 2024 (0 in 5+ unit buildings).
Forward outlook
- In year one you build about $9k of equity ($1k loan paydown + $8k appreciation (5.2% local appreciation)).
- Geneva County population projected to shrink 9% by 2050 — rents likely to lag national; underwrite the cash flow, not the appreciation.
- At projected returns (5.2% appreciation + 3.0% rent growth), your $44k cash investment doubles in ~5 years — after that, you're playing with house money.
- By year 4, paydown + projected appreciation supports a ~$31k cash-out refi (75% LTV) — recoverable capital for the next deal without selling this one.
Negotiation context
- It's been on market 92 days — a 9% lower offer ($142k) is reasonable based on typical stale-listing flexibility.
- 2 sale attempts; this cycle's ask has dropped $14k (8%) from the opening price — seller is motivated, your offer sets the floor, not the list.
Risks & watch-outs
- Climate carrying-cost: severe wind risk, 99% chance of damaging wind over 30y; extreme-heat days projected 7→19/yr by 2055 (HVAC capex compounding) — expect insurance premiums to compound above CPI over the hold.
Questions for the listing agent
- What do current leases actually rent for vs. the listed asking? Can we see a recent rent roll and the last 12 months of T-12 income?
- It's been on market 92 days. Have you received any prior offers? Is the seller open to a 25% concession, seller financing, or rate buy-down credit?
- Built in 1967 — when were the roof, HVAC, electrical panel, plumbing, and water heater last replaced?
- Why hasn't it sold? Are there any deal-killer items the seller is aware of (foundation, flood, title, zoning, code violations)?
- Is there a deadline driving the sale (1031 exchange, divorce, estate, relocation)? That informs how much negotiation room exists.
- Schools are D-rated, which usually means shorter tenancies and higher turnover. Who's the typical renter profile here, and what's been the actual vacancy rate?
- Crime grade is F in this area — have there been break-ins, vandalism, or insurance claims at this property in the last 3 years? What carrier currently insures it and at what premium?
- The area grade is low — what's the realistic commute time and amenity access for the typical tenant pool here? Any planned neighborhood developments (good or bad) we should know about?
- What's the average days-on-market for RENTAL listings here right now (not sales)? A rising rental-DOM trend means longer vacancies and softer asking-rent achievability than the comps imply.
- What's the recent tenant-quality profile in this submarket — average credit score on applications, eviction rate, late-payment / NSF rate, and stable-employment percentage? A property-management company in the area should have these aggregated.
- How much new for-sale + rental construction is in the pipeline within 1–3 miles? Heavy new supply typically softens prices + rents 12–24 months out; constrained supply supports both.
Investment metrics
- 1% rule
- 0.75% ✗
- Cap rate
- 6.18%
- Cash-on-cash
- -0.42%
- DSCR
- 0.98
- GRM
- 11.1
CMA / ARV
- ARV (median comp)
- $410,264
- List price
- $156,325
- Delta
- -61.90%
- Verdict
- UNDERPRICED
- Comps
- 2 within 1.0 mi
Projected returns pro-forma
5.22% appreciation · 3.0% rent growth · sell at horizon
- IRR
- 13.1%
- Equity multiple
- 1.85×
- Total profit
- $37,001
- Equity at exit
- $90,729
- IRR
- 13.9%
- Equity multiple
- 3.55×
- Total profit
- $111,681
- Equity at exit
- $158,385
Cash invested: $43,771 (down + closing). Projections, not guarantees.
Landlord ↔ Tenant lean methodology
- Overall (STATE)
- 90 Strongly Landlord-Friendly
- State Alabama
- 90 Strongly Landlord-Friendly · R+15
- County
- — inherits STATE
- City
- — inherits STATE
ZIP-level market 36477
- Home prices YoY
- 4.2%
- Active inventory
- 24
- Price-to-rent
- 11.1×
Monthly cashflow live
- Estimated rent
- $1,172 medium interval (Pro) →
- Mortgage (P&I)
- −$820
- Tax from tax record
- −$57 /mo · $679/yr
- Insurance
- −$65
- HOA
- −$0
- Vacancy / Maint / Mgmt
- −$246
- Net cashflow
- $-15
Break-even live
UW: 25.0% down · 7.5% · 30yr · 1.5% tax · 5.0% vac · 8.0% maint · 8.0% mgmt
Financing live
Cash to close
- Down payment
- $39,081
- Closing costs
- $4,690
- Reserves months
- —
- Total cash needed
- —
Loan-product check · same deal, 3 products live
Conventional
25% down · 7.5% · 30yr
- Down + closing
- —
- Monthly P&I
- —
- Monthly cashflow
- —
- DSCR
- —
- Eligible?
- —
Personal DTI + credit; lowest rate.
DSCR
20% down · 8.5% · 30yr
- Down + closing
- —
- Monthly P&I
- —
- Monthly cashflow
- —
- DSCR
- —
- Eligible?
- —
No personal income docs; deal must DSCR.
Hard money
10% down · 12.0% · 12mo
- Down + closing
- —
- Monthly P&I
- —
- Monthly cashflow
- —
- DSCR
- —
- Eligible?
- —
Short-term bridge; refi at stabilization.
Listing history 20 events
-
2026-06-19days on market $156,325 Active 92 DOM
-
2026-06-18days on market $156,325 Active 91 DOM
-
2026-06-17days on market $156,325 Active 90 DOM
-
2026-06-16days on market $156,325 Active 89 DOM
-
2026-06-15days on market $156,325 Active 88 DOM
-
2026-06-14days on market $156,325 Active 86 DOM
-
2026-06-12days on market $156,325 Active 85 DOM
-
2026-06-09days on market $156,325 Active 82 DOM
-
2026-06-08days on market $156,325 Active 81 DOM
-
2026-06-07days on market $156,325 Active 80 DOM
-
2026-06-05days on market $156,325 Active 77 DOM
-
2026-06-03days on market $156,325 Active 76 DOM
-
2026-06-02days on market $156,325 Active 75 DOM
-
2026-06-01days on market $156,325 Active 74 DOM
-
2026-05-31price $156,325 Active 73 DOM
-
2026-05-31days on market $169,900 Active 73 DOM
-
2026-05-30days on market $169,900 Active 72 DOM
-
2026-03-19$169,900 Active 705-char remark
Show marketing remark (705 chars)
Welcome to this home situated on approximately 2.2 acres in Geneva County, within the Samson School District. Constructed with a combination of brick and vinyl siding, this property offers durability and low-maintenance living. The main residence features 3 bedrooms and 2 full bathrooms. In addition, the home includes an additional living area complete with a full bathroom, kitchen space, storage, and an open sleeping nook—suitable for guests or extended living arrangements . A 2-car attached garage features a concrete floor, and the home includes a concrete driveway for added convenience and functionality. The spacious acreage provides room for outdoor activities, gardening, or other uses.
-
2025-09-20price $169,500
-
2025-08-12$175,000 Active
ⓘ Source: listings_history table (triggers on properties + properties_extension) + one-shot
backfill from property_details.listing_events for pre-trigger history.
Tax reassessment forecast AL · Resets to sale price
- Current annual tax
- $679 · $57/mo
- Projected year-2 tax
- $679 · $57/mo
- Expected delta
- $0/yr ($0/mo · 0.0%)
ⓘ Screening estimate from a state-policy table — verify with the county assessor before closing.
Climate risk First Street
- Flood 1/10 Low FEMA zone X (unshaded) · 0% chance over 30 yrs
- Wildfire 4/10 Moderate
- Heat 8/10 Severe 7 d/yr ≥106°F today · 19 d/yr by 30 yrs out
- Wind 8/10 Severe 99% chance of damaging wind over 30 yrs
- Air quality 1/10 Low 0 unhealthy d/yr today · 0 by 30 yrs out
Nearby sold comps map
Loading sold comps map…
Walkable amenities ~0.75 mi
Loading nearby amenities…
Taxation est. · year 1
- Rental income
- $14,068
- − Mortgage interest
- −$8,757
- − Property taxes
- −$679
- − Insurance
- −$782
- − Repairs & maintenance
- −$1,125
- − Management
- −$1,125
- − Depreciation
- −$4,548
- Taxable loss
- −$2,947
- Est. tax savings @ 24.0%
- +$707
- After-tax cash flow
- $524/yr
For passive investors: Depreciation is non-cash, so a rental often shows a tax loss while cash-flowing — sheltering income. Rental losses are passive: they offset passive income freely, and up to $25,000/yr can offset ordinary (W-2) income if you actively participate and your MAGI is under $100k (phasing out to $0 by $150k); unused losses carry forward. On sale, claimed depreciation is recaptured at up to 25%, and gains may owe capital-gains tax (a 1031 exchange can defer both). Figures are a year-1 estimate at your 24.0% rate — not tax advice; consult a CPA.
Schools (NCES district)
- District
- Geneva County
- NCES district ID
- 0101660
- Math proficiency
- 22% ▼ -32.00%
- Reading proficiency
- 51% ▲ 4.00%
- Median HH income
- $36,144
- Composite
- 30.15/100
- National rank
- #6325
- State rank
- #39 of 129 in AL
Livability — Kinston
- Score
- 57/100
- State rank
- #382
- US rank
- #21820
Category grades
Schools grade is shown separately in the Schools card above.
Census & demographics
- Population (ZIP)
- 4,363
Population outlook (Geneva County) Hauer SSP2
- Today (2025)
- 26,614 people
- By 2030
- 26,346 · -1.0%
- By 2040
- 25,491 · -4.2%
- By 2050
- 24,280 · -8.8%
- By 2075
- 20,914 · -21.4%
- By 2100
- 16,830 · -36.8%
Race, ethnicity, and origin ACS 2023
- Neighborhood character
- Predominantly White (80%)
- Race & ethnicity
- White 80% Hispanic / Latino 10% Black 6% Two or more races 4%
- Hispanic origin (detail)
- Mexican 9%
- Common ancestry
- Slovak 2% Serbian 2% Lithuanian 2%
- Foreign-born
- 2% · Canada
- Languages at home
- 92% English-only · Spanish 7%
Political lean MEDSL · Geneva
- 2024 margin
- Solid R (+77.0) · D 11.2% · R 88.2%
- 2008→2024 swing
- -14.5pp toward R · 2008: -62.5pp · 2024: -77.0pp
- All cycles
- 2024: R+77.0 2020: R+73.8 2016: R+72.4 2012: R+63.0 2008: R+62.5
Not yet ingested
- Civics
- —
Market trends
- HPI YoY
- ▲ 5.22%
- Current HPI
- 130.3062
- Rent YoY
- —
- Metro
- —
- State GDP YoY
- ▲ 2.94%
- F500 in state
- 4
Industry mix (Fortune 500 HQ in AL)
| Industry | F500 HQs | Revenue |
|---|---|---|
| Financial Services | 1 | $8B |
|
||
| Healthcare | 1 | $5B |
|
||
Price history
-2.9% since first listed3 events — show timeline
- 2026-03-19 Listed $169,900 CAOR
- 2025-09-20 Price Changed $169,500 SAMLS
- 2025-08-12 Listed $175,000 SAMLS
Cash-flow waterfall
monthlySold comps — $/sqft
last 12 mo · ≤1 miLoading sold comps…