 🏷️ Likely Rental
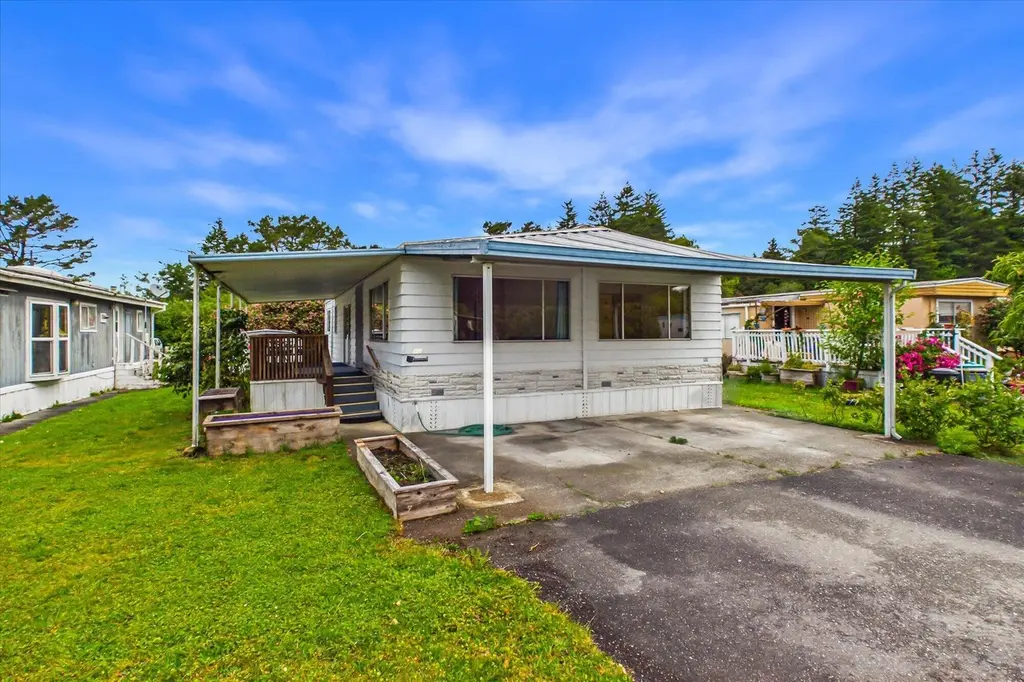
1021 Glendale Dr #12 · Blue Lake, CA
Flood risk 1/10 · Minimal
- FEMA flood zone
- X (unshaded)
- Chance of flooding over 30 yrs
- 0.0%
- Est. flood insurance / yr
- $507 – $1,088
Fire risk 1/10 · Minimal
- Est. fire insurance / yr
- $659 – $1,223
Heat risk 2/10 · Minimal
- Hot days now (above 73°F)
- 10 days/yr
- Hot days in 30 yrs
- 24 days/yr
Wind risk 1/10 · Minimal
- Chance of severe wind over 30 yrs
- —
Air-quality risk 10/10 · Severe
- Unhealthy air days now
- 21 days/yr
- Unhealthy air days in 30 yrs
- 22 days/yr
Risk factors via First Street. Map © Google.
Why this score? — see what drove the B grade
The composite is a weighted blend of 9 inputs, each scored 0–100. Each bar is that input's sub-score; the figure is the points it added to the 100-point composite (weight × sub-score).
- Cash flow +30.0/30.0
- 1% rule +10.0/10.0
- DSCR +10.0/10.0
- ARV discount +7.5/15.0
- Schools +4.2/10.0
- Appreciation +3.7/10.0
- Rent growth +2.5/5.0
- Livability +2.5/5.0
- Condition / age +2.2/5.0
$99,000
🖨 Deal sheet (PDF) 📄 Offer letter ✓ Due diligence
Listing remarks
Affordable opportunity in sunny Blue Lake! This 1974 manufactured home offers approximately 1,300 sq. ft. with 3 bedrooms and 2 bathrooms. Features include laminate wood flooring throughout, a spacious dining room with built-in hutch, gas cooktop, separate wall oven, and all appliances included, including washer and dryer. Outside you'll find a covered carport, large covered deck and storage shed. The home does need some repairs and updating, including a potential roof leak in the front bedroom, and is priced accordingly. Space rent is $568/month and includes water and sewer. All prospective buyers must be approved by park management prior to purchase. Great potential for the right buyer!
Key facts
- Gas cooktop
- Separate wall oven
- Spacious dining room
Tags
Property features AI
Finance
- Other: Located in Glendale Mobile park
Exterior
- Parking: 2-car garage
- Utilities: Public water; Public sewer; Electricity connected; Natural gas connected/available; Underground utilities; Phone available
- Home design: Residential single-family home; Single-story (mobile/manufactured unit in Glendale Mobile park); Facing direction not specified
- Construction: Aluminum siding; Block foundation; Membrane roof; Manufactured home make: Silvercrest
- Exterior features: Deck; Outbuilding; Level lot; Asphalt/paved road access
Interior
- Kitchen: Cooktop; Dishwasher; Range hood
- Flooring: Carpet; Laminate
- Heating & cooling: Forced air heating; Natural gas heating
- Interior features: Built-in features; Breakfast bar; Six total rooms
- Laundry & utility: Washer hookup
Neighborhood map
What this means for you Summary
Snapshot
- This is a 3-bed/2.0-bath single-family listed at $99k. Condition is rated fair.
Deal economics
- At list price, monthly cash flow is $545 ($7k/yr) — positive.
- The deal already cash-flows at list — no discount required.
- Meets the 1% rule at list price ($2k rent vs $99k).
Location & tenants
- Location reads 49/100 on livability (#1,163 in CA) — a working-class tenant base; expect higher turnover. Watch: health & safety C-, crime F, amenities F.
- Northern Humboldt Union High (town): math 32% / reading 65% proficiency, ranked #529 of 1,400 in CA (top 38%) — families likely to look elsewhere, expect single-tenant / working-renter base with shorter leases; only 10% free/reduced lunch — higher-income household profile.
- Zoned schools: Arcata Elementary (math 37% / reading 37%, grade F, #671 of 1,571 statewide, top 44%, 262 students, 76% FRL); Sunny Brae Middle (math 32% / reading 52%, grade D-, #144 of 498 statewide, top 29%, 220 students, 60% FRL); Arcata High (math 47% / reading 72%, grade C+, #205 of 1,170 statewide, top 19%, 1,052 students, 39% FRL) — zoned schools average 58% FRL vs 10% district-wide (48 pts higher); higher-poverty schools than district average — tighter screening recommended.
- Market conditions: 29 active listings in the ZIP; 188 units permitted in Humboldt County in 2024 (17 in 5+ unit buildings).
Forward outlook
- Local home prices are declining (-2.5%/yr); year-one equity from $684 of loan paydown is wiped out by about $2k of value loss. Plan a longer hold.
- Humboldt County population projected to shrink 4% by 2050 — rents likely to lag national; underwrite the cash flow, not the appreciation.
- At projected returns (-2.5% appreciation + 3.0% rent growth), your $28k cash investment doubles in ~5 years — after that, you're playing with house money.
Negotiation context
- Only 9 days on market — expect competitive offers; lowballing is unlikely to land.
Questions for the listing agent
- Have any recent inspections been done? Can we get a copy of the seller's disclosures and any deferred-maintenance estimates?
- Built in 1974 — when were the roof, HVAC, electrical panel, plumbing, and water heater last replaced?
- Is there a deadline driving the sale (1031 exchange, divorce, estate, relocation)? That informs how much negotiation room exists.
- Crime grade is F in this area — have there been break-ins, vandalism, or insurance claims at this property in the last 3 years? What carrier currently insures it and at what premium?
- What's the average days-on-market for RENTAL listings here right now (not sales)? A rising rental-DOM trend means longer vacancies and softer asking-rent achievability than the comps imply.
- What's the recent tenant-quality profile in this submarket — average credit score on applications, eviction rate, late-payment / NSF rate, and stable-employment percentage? A property-management company in the area should have these aggregated.
- How much new for-sale + rental construction is in the pipeline within 1–3 miles? Heavy new supply typically softens prices + rents 12–24 months out; constrained supply supports both.
Investment metrics
- 1% rule
- 1.57% ✓
- Cap rate
- 12.90%
- Cash-on-cash
- 23.61%
- DSCR
- 2.05
- GRM
- 5.3
CMA / ARV
- ARV (on-the-fly)
- $419,900
- Comps found
- 5
Show comp detail 5 sales within ~0.75 mi
| Address | Dist | Beds/Ba | Sqft | Sold | Price | $/sf | Match |
|---|---|---|---|---|---|---|---|
| 1131 Glendale Dr | 0.07mi | 3/2.0 | 1,464 (+13%) | 13mo | $60,000 | $41 | 65 |
| 691 Fieldbrook Rd | 0.60mi | 2/2.0 (-1) | 1,248 (-4%) | 9mo | $410,000 | $329 | 53 |
| 221 Glenwood Ln | 0.51mi | 4/2.0 (+1) | 1,364 (+5%) | 23mo | $255,000 | $187 | 44 |
| 52 Sunkist Ln | 0.71mi | 2/2.5 (-1) | 1,256 (-3%) | 22mo | $650,000 | $518 | 36 |
| 160 Blackberry Ln | 0.61mi | 2/1.0 (-1) | 1,440 (+11%) | 20mo | $465,000 | $323 | 28 |
Match score weights: distance 35% · size 25% · config 20% · recency 20%. Top-matched comps best support the ARV.
Projected returns pro-forma
-2.5% appreciation · 3.0% rent growth · sell at horizon
- IRR
- 18.0%
- Equity multiple
- 1.75×
- Total profit
- $20,782
- Equity at exit
- $16,961
- IRR
- 25.7%
- Equity multiple
- 3.33×
- Total profit
- $64,713
- Equity at exit
- $12,386
Cash invested: $27,720 (down + closing). Projections, not guarantees.
Landlord ↔ Tenant lean methodology
- Overall (STATE)
- 18 Strongly Tenant-Friendly
- State California
- 18 Strongly Tenant-Friendly · D+13
- County
- — inherits STATE
- City
- — inherits STATE
ZIP-level market 95525
- Home prices YoY
- -1.7%
- Active inventory
- 29
- Price-to-rent
- 5.3×
Monthly cashflow live
- Estimated rent
- $1,556 medium interval (Pro) →
- Mortgage (P&I)
- −$519
- Tax est. 1.5%
- −$124 /mo · $1,485/yr
- Insurance
- −$41
- HOA
- −$0
- Vacancy / Maint / Mgmt
- −$327
- Net cashflow
- $545
Break-even live
Sensitivity live
| Price | -10% $614 | -5% $580 | +0% $545 | +5% $511 | +10% $477 |
|---|---|---|---|---|---|
| Rent | -10% $422 | -5% $484 | +0% $545 | +5% $607 | +10% $668 |
| Rate | -1.0pp $595 | -0.5pp $571 | base $545 | +0.5pp $520 | +1.0pp $494 |
UW: 25.0% down · 7.5% · 30yr · 1.5% tax · 5.0% vac · 8.0% maint · 8.0% mgmt
Financing live
Cash to close
- Down payment
- $24,750
- Closing costs
- $2,970
- Reserves months
- —
- Total cash needed
- —
Loan-product check · same deal, 3 products live
Conventional
25% down · 7.5% · 30yr
- Down + closing
- —
- Monthly P&I
- —
- Monthly cashflow
- —
- DSCR
- —
- Eligible?
- —
Personal DTI + credit; lowest rate.
DSCR
20% down · 8.5% · 30yr
- Down + closing
- —
- Monthly P&I
- —
- Monthly cashflow
- —
- DSCR
- —
- Eligible?
- —
No personal income docs; deal must DSCR.
Hard money
10% down · 12.0% · 12mo
- Down + closing
- —
- Monthly P&I
- —
- Monthly cashflow
- —
- DSCR
- —
- Eligible?
- —
Short-term bridge; refi at stabilization.
Listing history 8 events
-
2026-06-21days on market $99,000 Active 9 DOM
-
2026-06-19days on market $99,000 Active 7 DOM
-
2026-06-18days on market $99,000 Active 6 DOM
-
2026-06-17days on market $99,000 Active 5 DOM
-
2026-06-16days on market $99,000 Active 4 DOM
-
2026-06-15days on market $99,000 Active 3 DOM
-
2026-06-13remarks 697-char remark
-
2026-06-13$99,000 Active 1 DOM
ⓘ Source: listings_history table (triggers on properties + properties_extension) + one-shot
backfill from property_details.listing_events for pre-trigger history.
Climate risk First Street
- Flood 1/10 Low FEMA zone X (unshaded) · 0% chance over 30 yrs
- Wildfire 1/10 Low
- Heat 2/10 Low 10 d/yr ≥73°F today · 24 d/yr by 30 yrs out
- Wind 1/10 Low
- Air quality 10/10 Extreme 21 unhealthy d/yr today · 22 by 30 yrs out
Nearby sold comps map
Loading sold comps map…
Walkable amenities ~0.75 mi
Loading nearby amenities…
Taxation est. · year 1
- Rental income
- $18,676
- − Mortgage interest
- −$5,546
- − Property taxes
- −$1,485
- − Insurance
- −$495
- − Repairs & maintenance
- −$1,494
- − Management
- −$1,494
- − Depreciation
- −$2,880
- Taxable income
- $5,282
- Est. tax owed @ 24.0%
- −$1,268
- After-tax cash flow
- $5,276/yr
For passive investors: Depreciation is non-cash, so a rental often shows a tax loss while cash-flowing — sheltering income. Rental losses are passive: they offset passive income freely, and up to $25,000/yr can offset ordinary (W-2) income if you actively participate and your MAGI is under $100k (phasing out to $0 by $150k); unused losses carry forward. On sale, claimed depreciation is recaptured at up to 25%, and gains may owe capital-gains tax (a 1031 exchange can defer both). Figures are a year-1 estimate at your 24.0% rate — not tax advice; consult a CPA.
Condition & rehab AI · 12 photos
This 1974 manufactured home requires moderate repairs and updates to improve its condition and value. Potential roof leak and peeling paint are the most pressing issues.
Repairs flagged
- Major Roof — Potential roof leak in the front bedroom
- Minor Windows — Some windows have peeling paint
Value-add opportunities
- Resale Paint interior walls — Fresh paint can make a significant difference in the home's appearance
- Rental Replace curtains — Fresh curtains can make the home more appealing to renters
- Both Replace laminate flooring — New flooring can improve both resale and rental value
- Both Replace windows — New windows can improve energy efficiency and curb appeal
Renovation cost estimate screening
| Repair item | Severity | Est. cost |
|---|---|---|
| Roof · Potential roof leak in the front bedroom | Major | $15,000–50,000 |
| Windows · Some windows have peeling paint | Minor | $500–3,000 |
| Total estimated repair cost · 2 items | $15,500–53,000 |
Value-add ROI direction
- Resale Paint interior walls — Fresh paint can make a significant difference in the home's appearance ↑
- Rental Replace curtains — Fresh curtains can make the home more appealing to renters ↑
- Both Replace laminate flooring — New flooring can improve both resale and rental value ↑
- Both Replace windows — New windows can improve energy efficiency and curb appeal ↑
ⓘ Cost ranges are severity-bucket heuristics (US national rule-of-thumb). Get contractor quotes + a written scope before underwriting a rehab budget.
Schools (NCES district)
- District
- Northern Humboldt Union High
- NCES district ID
- 0603030
- Math proficiency
- 32% ▼ -3.00%
- Reading proficiency
- 65% ▲ 8.00%
- Median HH income
- $36,832
- Composite
- 42.3/100
- National rank
- #6962
- State rank
- #529 of 1400 in CA
Livability — Blue Lake
- Score
- 49/100
- State rank
- #1163
- US rank
- #25871
Category grades
Schools grade is shown separately in the Schools card above.
Census & demographics
- Population (ZIP)
- 1,443
Population outlook (Humboldt County) Hauer SSP2
- Today (2025)
- 135,550 people
- By 2030
- 134,798 · -0.6%
- By 2040
- 132,222 · -2.5%
- By 2050
- 130,850 · -3.5%
- By 2075
- 128,656 · -5.1%
- By 2100
- 120,238 · -11.3%
Race, ethnicity, and origin ACS 2023
- Neighborhood character
- Predominantly White (78%)
- Race & ethnicity
- White 78% Two or more races 8% Hispanic / Latino 6% Native American 5% Asian 2% Pacific Islander 1%
- Hispanic origin (detail)
- Mexican 6%
- Common ancestry
- Italian 5% Iranian 5% Slovak 3%
- Foreign-born
- 3%
- Languages at home
- 97% English-only · Tagalog/Filipino 2%
Political lean MEDSL · Humboldt
- 2024 margin
- Strong D (+28.4) · D 62.0% · R 33.6% · Other 4.5%
- 2008→2024 swing
- +0.2pp no change · 2008: 28.2pp · 2024: 28.4pp
- All cycles
- 2024: D+28.4 2020: D+33.4 2016: D+25.9 2012: D+26.2 2008: D+28.2
Not yet ingested
- Civics
- —
Market trends
- HPI YoY
- ▼ -2.50%
- Current HPI
- 146.155
- Rent YoY
- —
- Metro
- —
- State GDP YoY
- ▲ 3.21%
- F500 in state
- 116
Industry mix (Fortune 500 HQ in CA)
| Industry | F500 HQs | Revenue |
|---|---|---|
| Technology | 27 | $1,492B |
|
||
| Financial Services | 3 | $174B |
|
||
| Retail | 3 | $44B |
|
||
| Insurance | 3 | $26B |
|
||
| Media / Entertainment | 2 | $115B |
|
||
| Pharmaceuticals / Biotech | 2 | $62B |
|
||
Price history
1 event — show timeline
- 2026-06-11 Listed $99,000 HAR
Cash-flow waterfall
monthlySold comps — $/sqft
last 12 mo · ≤1 miLoading sold comps…