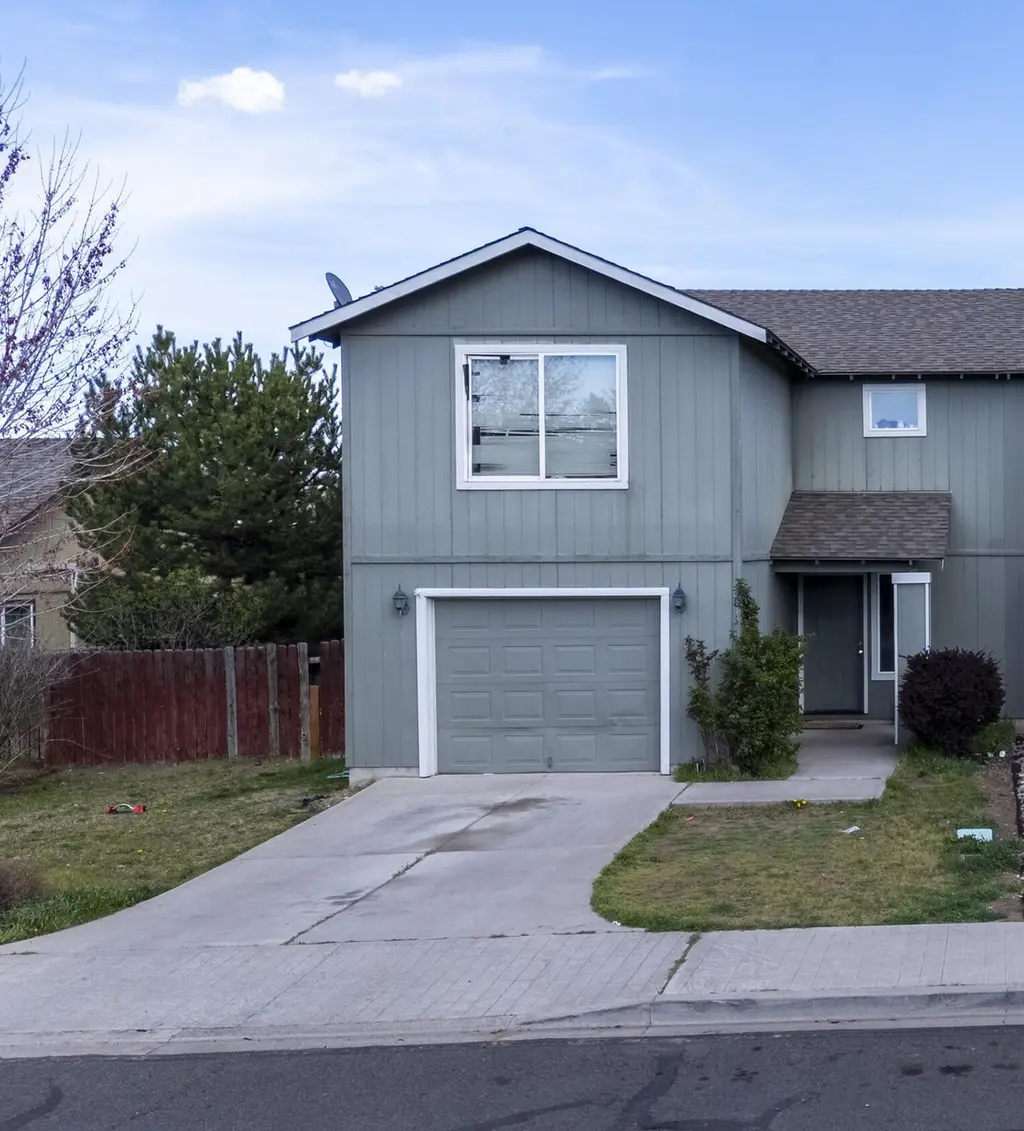
813 SE Kierra Pl · Madras, OR
Flood risk 1/10 · Minimal
- FEMA flood zone
- X
- Chance of flooding over 30 yrs
- 0.0%
- Est. flood insurance / yr
- $507 – $1,088
Fire risk 7/10 · Major
- Est. fire insurance / yr
- $498 – $926
Heat risk 4/10 · Minor
- Hot days now (above 95°F)
- 7 days/yr
- Hot days in 30 yrs
- 15 days/yr
Wind risk 1/10 · Minimal
- Chance of severe wind over 30 yrs
- —
Air-quality risk 10/10 · Severe
- Unhealthy air days now
- 18 days/yr
- Unhealthy air days in 30 yrs
- 22 days/yr
Risk factors via First Street. Map © Google.
Why this score? — see what drove the D grade
The composite is a weighted blend of 9 inputs, each scored 0–100. Each bar is that input's sub-score; the figure is the points it added to the 100-point composite (weight × sub-score).
- Appreciation +10.0/10.0
- ARV discount +8.5/15.0
- Cash flow +7.7/30.0
- Livability +3.4/5.0
- Rent growth +2.5/5.0
- Condition / age +2.5/5.0
- Schools +2.1/10.0
- DSCR +1.8/10.0
- 1% rule +1.7/10.0
$240,000
🖨 Deal sheet 📄 Offer letter ✓ Due diligence
Listing remarks MLS
Home is currently rented and tenants may like to stay, but are set to move if necessary.
Key facts
- Fenced yard
- Flex space
- Dining area
Tags
Property features AI
Finance
- Financial info: Property is currently rented
- HOA & community: Association with annual fee ($400); Community clubhouse; CCRs in place
Exterior
- Parking: Attached garage (1 car); Driveway; On-street parking
- Security: Carbon monoxide detectors; Smoke detectors
- Utilities: Public water; Public sewer; Public utilities available; Easements for utilities
- Home design: Residential townhouse; Two levels; No basement; 1 common wall; No accessory dwelling unit
- Construction: Built in 2005; Frame construction; Stemwall foundation
- Exterior features: Composition roof; Vinyl window frames; Fenced lot; Paved road access
Interior
- Kitchen: Dishwasher; Disposal; Microwave; Oven; Range; Kitchen island; Breakfast bar
- Bedrooms: 3 bedrooms (including primary bedroom)
- Flooring: Carpet; Laminate; Vinyl
- Bathrooms: 2 full bathrooms; 1 half bathroom
- Heating & cooling: Electric heating; Zoned heating; No central cooling
- Interior features: Breakfast bar; Double vanity; Fiberglass stall shower; Kitchen island; Linen closet; Shower/tub combo; Electric fireplace
- Laundry & utility: Laundry room
Neighborhood map
What this means for you Summary
Snapshot
- This is a 3-bed/2.5-bath townhouse listed at $240k.
Deal economics
- At list price, monthly cash flow is $-275 ($-3k/yr) — negative.
- To cash-flow at today's rent, offer at most $191k (20.3% below list).
- To meet the 1% rule (rent ≥ 1% of price), the offer needs to be $162k (32.7% below list).
- Recommended offer: $162k (32.7% below list) — sets the bar for 1% rule.
- Cap rate 4.9% vs local median 2.9% in Madras — top-decile yield for the area; either an underpriced asset or a hidden risk that comps aren't pricing in. Stress-test before assuming the spread holds.
Location & tenants
- Location reads 67/100 on livability (#180 in OR) — a middle-class / working-renter tenant base. Strengths: cost of living A+, health & safety A+, housing A; Watch: amenities D+, crime D-, commute F.
- Jefferson County SD 509J (rural): math 19% / reading 30% proficiency, ranked #55 of 58 in OR (top 95%) — low school quality limits family demand, transient renter base, plan for 1-2y turnover; 77% free/reduced lunch — lower-income household profile, screen leases tightly.
- Zoned schools: Buff Elementary School (math 42% / reading 42%, grade F, #164 of 412 statewide, top 40%, 274 students, 94% FRL); Jefferson County Middle School (math 21% / reading 39%, grade F, #84 of 128 statewide, top 66%, 473 students, 94% FRL); Madras High School (math 8% / reading 47%, grade F, #114 of 143 statewide, top 80%, 781 students, 93% FRL) — zoned schools average 94% FRL vs 77% district-wide (17 pts higher); higher-poverty schools than district average — tighter screening recommended.
- Market conditions: 260 active listings in the ZIP; 5 comparable units currently listed for rent nearby; rentals lingering (median 44d on market — plan ~5-8 weeks vacancy on turnover, expect pricing pressure); 100% of comp listings sitting > 30 days — soft ceiling on asking rent; 108 units permitted in Jefferson County in 2024 (5 in 5+ unit buildings).
Forward outlook
- In year one you build about $26k of equity ($2k loan paydown + $24k appreciation (10.0% local appreciation)).
- Jefferson County population projected at +7% by 2050 — modest demand growth; plan on rents tracking national, not racing it.
- By year 2, paydown + projected appreciation supports a ~$41k cash-out refi (75% LTV) — recoverable capital for the next deal without selling this one.
Negotiation context
- It's been on market 55 days — a 3% lower offer ($233k) is reasonable based on typical stale-listing flexibility.
- 6 sale attempts since 21y ago with the ask held roughly flat each time — persistent listings suggest the price (not the market) is what's stuck; bring a comps-based counter.
Risks & watch-outs
- Climate carrying-cost: major wildfire risk — expect insurance premiums to compound above CPI over the hold.
Questions for the listing agent
- What do current leases actually rent for vs. the listed asking? Can we see a recent rent roll and the last 12 months of T-12 income?
- It's been on market 55 days. Have you received any prior offers? Is the seller open to a 33% concession, seller financing, or rate buy-down credit?
- What does the HOA fee cover, when was the last increase, and are there any pending special assessments or reserve-fund shortfalls?
- Is there a deadline driving the sale (1031 exchange, divorce, estate, relocation)? That informs how much negotiation room exists.
- Schools are F-rated, which usually means shorter tenancies and higher turnover. Who's the typical renter profile here, and what's been the actual vacancy rate?
- Crime grade is D in this area — have there been break-ins, vandalism, or insurance claims at this property in the last 3 years? What carrier currently insures it and at what premium?
- The area grade is low — what's the realistic commute time and amenity access for the typical tenant pool here? Any planned neighborhood developments (good or bad) we should know about?
- What's the average days-on-market for RENTAL listings here right now (not sales)? A rising rental-DOM trend means longer vacancies and softer asking-rent achievability than the comps imply.
- What's the recent tenant-quality profile in this submarket — average credit score on applications, eviction rate, late-payment / NSF rate, and stable-employment percentage? A property-management company in the area should have these aggregated.
- How much new for-sale + rental construction is in the pipeline within 1–3 miles? Heavy new supply typically softens prices + rents 12–24 months out; constrained supply supports both.
Investment metrics
- 1% rule
- 0.67% ✗
- Cap rate
- 4.92%
- Cash-on-cash
- -4.92%
- DSCR
- 0.78
- GRM
- 12.4
CMA / ARV
- ARV (median comp)
- $245,260
- List price
- $240,000
- Delta
- -2.14%
- Verdict
- FAIR
- Comps
- 20 within 1.0 mi
Show comp detail 5 sales within ~0.75 mi
| Address | Dist | Beds/Ba | Sqft | Sold | Price | $/sf | Match |
|---|---|---|---|---|---|---|---|
| 844 SE Maliah Ave | 0.03mi | 3/2.5 | 1,512 (+2%) | 5mo | $202,000 | $134 | 92 |
| 921 SE Kierra Pl | 0.10mi | 3/2.0 | 1,399 (-6%) | 11mo | $265,000 | $189 | 74 |
| 837 SE Kierra Pl | 0.02mi | 3/2.0 | 1,377 (-8%) | 13mo | $258,000 | $187 | 74 |
| 857 SE Maui Ln | 0.14mi | 3/2.0 | 1,388 (-7%) | 13mo | $260,000 | $187 | 70 |
| 968 SE Kierra Pl | 0.14mi | 3/2.0 | 1,266 (-15%) | 9mo | $257,900 | $204 | 59 |
Match score weights: distance 35% · size 25% · config 20% · recency 20%. Top-matched comps best support the ARV.
Projected returns pro-forma
10.0% appreciation · 3.0% rent growth · sell at horizon
- IRR
- 20.8%
- Equity multiple
- 2.68×
- Total profit
- $113,131
- Equity at exit
- $216,211
- IRR
- 18.9%
- Equity multiple
- 6.16×
- Total profit
- $346,861
- Equity at exit
- $466,267
Cash invested: $67,200 (down + closing). Projections, not guarantees.
Landlord ↔ Tenant lean methodology
- Overall (STATE)
- 28 Tenant-Leaning
- State Oregon
- 28 Tenant-Leaning · D+6
- County
- — inherits STATE
- City
- — inherits STATE
ZIP-level market 97741
- Home prices YoY
- 5.3%
- Active inventory
- 260
- Price-to-rent
- 12.4×
Monthly cashflow live
- Estimated rent
- $1,616 high interval (Pro) →
- Mortgage (P&I)
- −$1,259
- Tax from tax record
- −$160 /mo · $1,920/yr
- Insurance
- −$100
- HOA
- −$33
- Vacancy / Maint / Mgmt
- −$339
- Net cashflow
- $-275
Break-even live
UW: 25.0% down · 7.5% · 30yr · 1.5% tax · 5.0% vac · 8.0% maint · 8.0% mgmt
Financing live
Cash to close
- Down payment
- $60,000
- Closing costs
- $7,200
- Reserves months
- —
- Total cash needed
- —
Loan-product check · same deal, 3 products live
Conventional
25% down · 7.5% · 30yr
- Down + closing
- —
- Monthly P&I
- —
- Monthly cashflow
- —
- DSCR
- —
- Eligible?
- —
Personal DTI + credit; lowest rate.
DSCR
20% down · 8.5% · 30yr
- Down + closing
- —
- Monthly P&I
- —
- Monthly cashflow
- —
- DSCR
- —
- Eligible?
- —
No personal income docs; deal must DSCR.
Hard money
10% down · 12.0% · 12mo
- Down + closing
- —
- Monthly P&I
- —
- Monthly cashflow
- —
- DSCR
- —
- Eligible?
- —
Short-term bridge; refi at stabilization.
Rent comps 5 comps
| Address | Beds | Baths | Sqft | Rent | $/sqft | DOM | Units | Dist |
|---|---|---|---|---|---|---|---|---|
| 335 SE 8th St Madras, OR | 3.0 | 1.0 | 1178 | $1,550 | $1.32 | 44d | 1 | 0.53mi |
| 366 SW M St Madras, OR | 2.0–3.0 | 1.0–2.0 | 900 | $1,725 | $1.92 | 44d | 4 | 0.67mi |
| 137 NE Pine St Unit 137 Madras, OR | 2.0 | 1.0 | 937 | $1,350 | $1.44 | 44d | 1 | 0.98mi |
| 141 NE Pine St Unit 141 Madras, OR | 2.0 | 1.0 | 937 | $1,250 | $1.33 | 44d | 1 | 0.98mi |
| 1392 SE Yarrow Ave Madras, OR | 1.0–3.0 | 1.0–2.0 | 904 | $1,995 | $2.21 | 44d | 12 | 1.19mi |
HOA detail
- Monthly dues
- $33 · $396/yr
Listing history 35 events
-
2026-06-19days on market $240,000 Active 55 DOM
-
2026-06-18days on market $240,000 Active 54 DOM
-
2026-06-17days on market $240,000 Active 53 DOM
-
2026-06-16days on market $240,000 Active 52 DOM
-
2026-06-15days on market $240,000 Active 51 DOM
-
2026-06-14days on market $240,000 Active 49 DOM
-
2026-06-12days on market $240,000 Active 48 DOM
-
2026-06-09days on market $240,000 Active 45 DOM
-
2026-06-08days on market $240,000 Active 44 DOM
-
2026-06-07days on market $240,000 Active 43 DOM
-
2026-06-07days on market $240,000 Active 42 DOM
-
2026-06-04days on market $240,000 Active 39 DOM
-
2026-06-02days on market $240,000 Active 38 DOM
-
2026-06-01days on market $240,000 Active 37 DOM
-
2026-05-31days on market $240,000 Active 36 DOM
-
2026-05-31days on market $240,000 Active 35 DOM
-
2026-05-01price $244,900 209-char remark
-
2026-04-25$252,000 Active 209-char remark
-
2025-07-14soldstatus $230,000 Closed 88-char remark
Show marketing remark (88 chars)
Home is currently rented and tenants may like to stay, but are set to move if necessary.
-
2025-07-14soldstatus $230,000
Show marketing remark (88 chars)
Home is currently rented and tenants may like to stay, but are set to move if necessary.
-
2025-06-16status Pending 88-char remark
Show marketing remark (88 chars)
Home is currently rented and tenants may like to stay, but are set to move if necessary.
-
2025-04-11$239,900 Active 88-char remark
Show marketing remark (88 chars)
Home is currently rented and tenants may like to stay, but are set to move if necessary.
-
2022-01-13historical
-
2021-12-27price $239,990
-
2021-12-13$249,900 Active
-
2014-08-01soldstatus $69,990
-
2008-09-03soldstatus $67,500
-
2008-09-03soldstatus $67,500
-
2008-07-16historical
-
2008-07-16historical
-
2008-02-20$67,500
-
2008-02-20$67,500
-
2005-08-22soldstatus $125,000
-
2005-06-27historical
-
2005-01-21$123,500
ⓘ Source: listings_history table (triggers on properties + properties_extension) + one-shot
backfill from property_details.listing_events for pre-trigger history.
Tax reassessment forecast OR · Resets to sale price
- Current annual tax
- $1,920 · $160/mo
- Projected year-2 tax
- $2,328 · $194/mo
- Expected delta
- +$408/yr (+$34/mo · 21.2%)
ⓘ Screening estimate from a state-policy table — verify with the county assessor before closing.
Climate risk First Street
- Flood 1/10 Low FEMA zone X · 0% chance over 30 yrs
- Wildfire 7/10 Severe
- Heat 4/10 Moderate 7 d/yr ≥95°F today · 15 d/yr by 30 yrs out
- Wind 1/10 Low
- Air quality 10/10 Extreme 18 unhealthy d/yr today · 22 by 30 yrs out
Nearby sold comps map
Loading sold comps map…
Walkable amenities ~0.75 mi
Loading nearby amenities…
Taxation est. · year 1
- Rental income
- $19,386
- − Mortgage interest
- −$13,444
- − Property taxes
- −$1,920
- − Insurance
- −$1,200
- − Repairs & maintenance
- −$1,551
- − Management
- −$1,551
- − HOA
- −$396
- − Depreciation
- −$6,982
- Taxable loss
- −$7,658
- Est. tax savings @ 24.0%
- +$1,838
- After-tax cash flow
- $-1,467/yr
For passive investors: Depreciation is non-cash, so a rental often shows a tax loss while cash-flowing — sheltering income. Rental losses are passive: they offset passive income freely, and up to $25,000/yr can offset ordinary (W-2) income if you actively participate and your MAGI is under $100k (phasing out to $0 by $150k); unused losses carry forward. On sale, claimed depreciation is recaptured at up to 25%, and gains may owe capital-gains tax (a 1031 exchange can defer both). Figures are a year-1 estimate at your 24.0% rate — not tax advice; consult a CPA.
Schools (NCES district)
- District
- Jefferson County SD 509J
- NCES district ID
- 4106740
- Math proficiency
- 19% ▼ -8.00%
- Reading proficiency
- 30% ▼ -9.00%
- Median HH income
- $42,663
- Composite
- 20.9/100
- National rank
- #8488
- State rank
- #55 of 58 in OR
Livability — Madras
- Score
- 67/100
- State rank
- #180
- US rank
- #11012
Category grades
Schools grade is shown separately in the Schools card above.
Census & demographics
- Census place
- Madras, OR
- County
- Jefferson County · 13,663 people
- City population
- 13,663
- Metro
- The Dalles, OR
- Population (ZIP)
- 13,663
- Household income
- $70,983
- Rent vs Own
- Severe rent burden
- 466.0
Population outlook (Jefferson County) Hauer SSP2
- Today (2025)
- 24,040 people
- By 2030
- 24,631 · +2.5%
- By 2040
- 25,499 · +6.1%
- By 2050
- 25,801 · +7.3%
- By 2075
- 25,682 · +6.8%
- By 2100
- 22,222 · -7.6%
Race, ethnicity, and origin ACS 2023
- Neighborhood character
- Diverse neighborhood (Simpson 0.62)
- Race & ethnicity
- White 56% Hispanic / Latino 27% Two or more races 19% Native American 8%
- Hispanic origin (detail)
- Mexican 24%
- Common ancestry
- Portuguese 2% Italian 1% Iranian 1%
- Foreign-born
- 8% · Canada
- Languages at home
- 78% English-only · Spanish 20%
Political lean MEDSL · Jefferson
- 2024 margin
- Solid R (+30.2) · D 33.6% · R 63.8% · Other 2.5%
- 2008→2024 swing
- -21.5pp toward R · 2008: -8.7pp · 2024: -30.2pp
- All cycles
- 2024: R+30.2 2020: R+23.5 2016: R+27.6 2012: R+16.8 2008: R+8.7
Not yet ingested
- Civics
- —
Market trends
- HPI YoY
- ▲ 29.68%
- Current HPI
- 590.9612
- Rent YoY
- —
- Metro
- The Dalles, OR
- State GDP YoY
- ▲ 2.05%
- F500 in state
- 2
Industry mix (Fortune 500 HQ in OR)
| Industry | F500 HQs | Revenue |
|---|---|---|
| Consumer Goods | 1 | $51B |
|
||
Price history
+94.3% since first listed20 events — show timeline
- 2026-05-22 Price Changed $240,000 MLSCO
- 2026-05-01 Price Changed $244,900 MLSCO
- 2026-04-25 Listed $252,000 MLSCO
- 2025-07-14 Sold (Public Records) $230,000 Public Records
- 2025-07-14 Sold (MLS) $230,000 MLSCO
- 2025-06-16 Pending — MLSCO
- 2025-04-11 Listed $239,900 MLSCO
- 2022-01-13 Listing Removed — MLSCO
- 2021-12-27 Price Changed $239,990 MLSCO
- 2021-12-13 Listed $249,900 MLSCO
- 2014-08-01 Sold (Public Records) $69,990 Public Records
- 2008-09-03 Sold (MLS) $67,500 RMLS
- 2008-09-03 Sold (MLS) $67,500 MLSCO
- 2008-07-16 Delisted — RMLS
- 2008-07-16 Listing Removed — MLSCO
- 2008-02-20 Listed $67,500 RMLS
- 2008-02-20 Listed $67,500 MLSCO
- 2005-08-22 Sold (MLS) $125,000 MLSCO
- 2005-06-27 Listing Removed — MLSCO
- 2005-01-21 Listed $123,500 MLSCO
Property tax history
+5.4%/yrLatest (2025): $1,920 · +1.7% YoY. Source: county tax records.
Cash-flow waterfall
monthlySold comps — $/sqft
last 12 mo · ≤1 miLoading sold comps…