 Duplex
580-590 NW 58th St · Miami, FL
Flood risk 4/10 · Minor
- FEMA flood zone
- X (unshaded)
- Chance of flooding over 30 yrs
- 0.22%
- Est. flood insurance / yr
- $507 – $1,088
Fire risk 1/10 · Minimal
- Est. fire insurance / yr
- $947 – $1,759
Heat risk 10/10 · Severe
- Hot days now (above 103°F)
- 7 days/yr
- Hot days in 30 yrs
- 29 days/yr
Wind risk 10/10 · Severe
- Chance of severe wind over 30 yrs
- 99.0%
Air-quality risk 2/10 · Minimal
- Unhealthy air days now
- 1 days/yr
- Unhealthy air days in 30 yrs
- 1 days/yr
Risk factors via First Street. Map © Google.
Why this score? — see what drove the F grade
The composite is a weighted blend of 9 inputs, each scored 0–100. Each bar is that input's sub-score; the figure is the points it added to the 100-point composite (weight × sub-score).
- Cash flow +7.9/30.0
- ARV discount +7.5/15.0
- Schools +4.2/10.0
- Livability +3.9/5.0
- Rent growth +3.1/5.0
- Condition / age +2.5/5.0
- 1% rule +2.4/10.0
- DSCR +2.0/10.0
- Appreciation +0.0/10.0
$740,000
🖨 Deal sheet (PDF) 📄 Offer letter ✓ Due diligence
Multi-family units
County records classify this as Multi-Family (2-4 Unit). Listing-text estimate: 2 units. confirmed
Listing remarks MLS
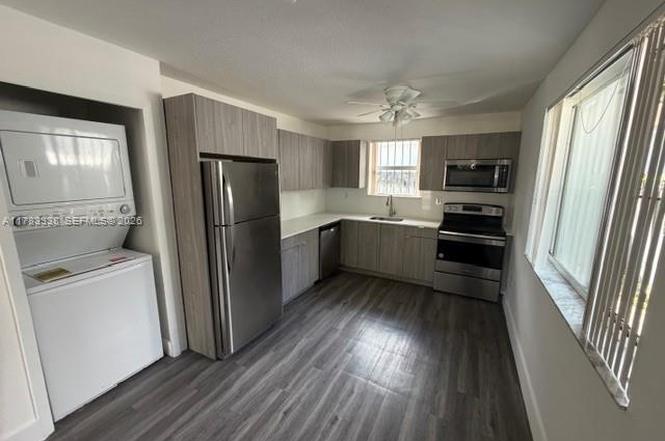
Turnkey solution for passive investors located in a booming area with an actual cap rate of 8.03% and a pro forma cap rate of 8.44%. 2008 built duplex completely renovated in 2023 and located within an opportunity zone. Easy to manage. One home is currently leased to Section 8 while the other is leased to a long term tenant. Renovations include: All new wood cabinets w/ quartz countertops & stainless-steel appliances and updated luxury vinyl plank flooring. Unique feature of this duplex is the buildings are detached homes appealing to single family renters which tend to pay a premium when compared to traditional duplexes. Low maintenance, impressive finishes & headache free easy to manage. Proximity to Design District, Wynwood and Edgewater has fueled the gentrification of neighborhood.
Key facts
- Fully renovated
- High-end finishes
- Detached units
Tags
Neighborhood map
What this means for you Summary
Snapshot
- This is a 2 × 3-bed/2.0-bath units multifamily listed at $740k.
Deal economics
- At list price, monthly cash flow is $-778 ($-9k/yr) — negative. Per door: $-389/mo.
- To cash-flow at today's rent, offer at most $603k (18.6% below list).
- To meet the 1% rule (rent ≥ 1% of price), the offer needs to be $547k (26.1% below list).
- Recommended offer: $547k (26.1% below list) — sets the bar for 1% rule.
- Cap rate 5.0% vs local median 1.9% in Miami — top-decile yield for the area; either an underpriced asset or a hidden risk that comps aren't pricing in. Stress-test before assuming the spread holds.
Location & tenants
- Location reads 78/100 on livability (#177 in FL, #2,724 nationally) — a middle-class / working-renter tenant base. Strengths: amenities A+, commute A+, health & safety A+; Watch: employment C-, crime F, cost of living F.
- Miami-Dade (suburban): math 45% / reading 54% proficiency, ranked #40 of 73 in FL (top 55%) — families likely to look elsewhere, expect single-tenant / working-renter base with shorter leases; 64% free/reduced lunch — lower-income household profile, screen leases tightly.
- Zoned schools: Toussaint L'Ouverture Elementary (math 27% / reading 37%, grade F, #1,797 of 2,144 statewide, top 86%, 337 students, 75% FRL); Jose De Diego Middle School (math 20% / reading 24%, grade F, #549 of 571 statewide, top 97%, 868 students, 68% FRL); Miami Edison Senior High School (math 19% / reading 15%, grade F, #597 of 667 statewide, top 90%, 623 students, 72% FRL).
- Zoned-school proficiency averages 24% at this address vs 50% district-wide (-26 pts) — the specific schools serving this property underperform the Miami-Dade average; the district grade overstates school quality for this exact location.
- Market conditions: Rents rising (+2.3%/yr); 296 active listings in the ZIP; lower-income renter base — watch delinquency; 10,051 units permitted in Miami-Dade County in 2024 (7,758 in 5+ unit buildings).
- At $5,466/mo this rent would consume 159% of the median local household income ($41k/yr) (locally 2523% of renters already pay >50% of income on rent) — very limited rent-growth headroom before tenants either downsize or default.
Forward outlook
- Local home prices are declining (-3.0%/yr); year-one equity from $5k of loan paydown is wiped out by about $22k of value loss. Plan a longer hold.
- Miami-Dade County population projected at +28% by 2050 — long-run rental-demand tailwind backs the buy-and-hold thesis.
Negotiation context
- It's been on market 306 days — a 12% lower offer ($651k) is reasonable based on typical stale-listing flexibility.
- 6 sale attempts since 3y ago; this cycle's ask has dropped $250k (25%) from the opening price — seller is motivated, your offer sets the floor, not the list.
Risks & watch-outs
- Climate carrying-cost: severe wind risk, 99% chance of damaging wind over 30y; extreme-heat days projected 7→29/yr by 2055 (HVAC capex compounding) — expect insurance premiums to compound above CPI over the hold.
Questions for the listing agent
- What do current leases actually rent for vs. the listed asking? Can we see a recent rent roll and the last 12 months of T-12 income?
- It's been on market 306 days. Have you received any prior offers? Is the seller open to a 26% concession, seller financing, or rate buy-down credit?
- Can we see the unit-by-unit rent roll, current vacancy, and any below-market leases? What's the average tenancy length?
- What capital expenditures (roof, boiler, parking lot, exteriors) have been made in the last 5 years, and what's planned in the next 2?
- Why hasn't it sold? Are there any deal-killer items the seller is aware of (foundation, flood, title, zoning, code violations)?
- Is there a deadline driving the sale (1031 exchange, divorce, estate, relocation)? That informs how much negotiation room exists.
- Schools are B-rated — typically a magnet for longer-tenancy family renters. What's the average tenant stay here, and is there a school-zone premium baked into asking?
- Crime grade is F in this area — have there been break-ins, vandalism, or insurance claims at this property in the last 3 years? What carrier currently insures it and at what premium?
- The area grade is low — what's the realistic commute time and amenity access for the typical tenant pool here? Any planned neighborhood developments (good or bad) we should know about?
- What's the average days-on-market for RENTAL listings here right now (not sales)? A rising rental-DOM trend means longer vacancies and softer asking-rent achievability than the comps imply.
- What's the recent tenant-quality profile in this submarket — average credit score on applications, eviction rate, late-payment / NSF rate, and stable-employment percentage? A property-management company in the area should have these aggregated.
- How much new apartment / multifamily construction is in the pipeline within 1–3 miles? Heavy new supply (>2% of stock underway) typically softens rents 12–24 months out; light construction supports rent growth.
Investment metrics
- 1% rule
- 0.74% ✗
- Cap rate
- 5.03%
- Cash-on-cash
- -4.51%
- DSCR
- 0.80
- GRM
- 11.3
CMA / ARV
No comps found within radius.
Projected returns pro-forma
-3.0% appreciation · 2.26% rent growth · sell at horizon
- IRR
- -24.7%
- Equity multiple
- 0.16×
- Total profit
- $-173,451
- Equity at exit
- $110,336
- IRR
- -22.7%
- Equity multiple
- -0.11×
- Total profit
- $-230,910
- Equity at exit
- $63,982
Cash invested: $207,200 (down + closing). Projections, not guarantees.
Landlord ↔ Tenant lean methodology
- Overall (STATE)
- 87 Strongly Landlord-Friendly
- State Florida
- 87 Strongly Landlord-Friendly · R+3
- County
- — inherits STATE
- City
- — inherits STATE
ZIP-level market 33127
- Home prices YoY
- -30.1%
- Rents YoY
- 2.3%
- Active inventory
- 296
- Price-to-rent
- 22.6×
Monthly cashflow live
- Estimated rent
- $5,466 medium interval (Pro) →
- Mortgage (P&I)
- −$3,881
- Tax from tax record
- −$907 /mo · $10,890/yr
- Insurance
- −$308
- HOA
- −$0
- Vacancy / Maint / Mgmt
- −$1,148
- Net cashflow
- $-778
Break-even live
Sensitivity live
| Price | -10% $-359 | -5% $-569 | +0% $-778 | +5% $-988 | +10% $-1,197 |
|---|---|---|---|---|---|
| Rent | -10% $-1,210 | -5% $-994 | +0% $-778 | +5% $-562 | +10% $-346 |
| Rate | -1.0pp $-406 | -0.5pp $-590 | base $-778 | +0.5pp $-970 | +1.0pp $-1,165 |
2-unit breakdown (identical units grouped — click to expand)
| Units | Beds | Baths | Est. rent |
|---|---|---|---|
| 2× units | 3 | 2 | $5,466 |
| #1 | 3 | 2 | $2,733 |
| #2 | 3 | 2 | $2,733 |
| Total (2 units) | $5,466 | ||
UW: 25.0% down · 7.5% · 30yr · 1.5% tax · 5.0% vac · 8.0% maint · 8.0% mgmt
Financing live
Cash to close
- Down payment
- $185,000
- Closing costs
- $22,200
- Reserves months
- —
- Total cash needed
- —
Loan-product check · same deal, 3 products live
Conventional
25% down · 7.5% · 30yr
- Down + closing
- —
- Monthly P&I
- —
- Monthly cashflow
- —
- DSCR
- —
- Eligible?
- —
Personal DTI + credit; lowest rate.
DSCR
20% down · 8.5% · 30yr
- Down + closing
- —
- Monthly P&I
- —
- Monthly cashflow
- —
- DSCR
- —
- Eligible?
- —
No personal income docs; deal must DSCR.
Hard money
10% down · 12.0% · 12mo
- Down + closing
- —
- Monthly P&I
- —
- Monthly cashflow
- —
- DSCR
- —
- Eligible?
- —
Short-term bridge; refi at stabilization.
Listing history 35 events
-
2026-04-13status Pending
-
2026-04-08price $740,000
-
2026-04-03price $749,000
-
2026-04-02price $400,000
-
2026-04-02status Active
-
2026-03-05historical
-
2026-03-04price $794,900
-
2026-03-02price $774,900
-
2026-02-17status Active
-
2026-02-16price $784,900
-
2026-02-06price $779,900
-
2026-01-02price $775,900
-
2026-01-02price $786,900
-
2025-12-16price $784,900
-
2025-12-10status Active
-
2025-11-28historical
-
2025-11-06price $814,900
-
2025-10-30price $794,900
-
2025-09-02price $784,900
-
2025-08-28price $818,000
-
2025-08-22price $813,000
-
2025-07-16price $810,000
-
2025-06-26status Active
-
2025-06-09historical
-
2025-06-02price $799,999
-
2025-06-02price $848,000
-
2025-05-28price $849,000
-
2025-05-13price $849,900
-
2025-05-11price $897,100
-
2025-04-15price $897,143
-
2025-04-15$989,500 Active
-
2023-11-21soldstatus $784,900
-
2023-11-20soldstatus $784,900 Closed 809-char remark
Show marketing remark (809 chars)
Turnkey solution for passive investors located in a booming area with an actual cap rate of 8.03% and a pro forma cap rate of 8.44%. 2008 built duplex completely renovated in 2023 and located within an opportunity zone. Easy to manage. One home is currently leased to Section 8 while the other is leased to a long term tenant. Renovations include: All new wood cabinets w/ quartz countertops & stainless-steel appliances and updated luxury vinyl plank flooring. Unique feature of this duplex is the buildings are detached homes appealing to single family renters which tend to pay a premium when compared to traditional duplexes. Low maintenance, impressive finishes & headache free easy to manage. Proximity to Design District, Wynwood and Edgewater has fueled the gentrification of neighborhood.
-
2023-10-20status Pending 809-char remark
Show marketing remark (809 chars)
Turnkey solution for passive investors located in a booming area with an actual cap rate of 8.03% and a pro forma cap rate of 8.44%. 2008 built duplex completely renovated in 2023 and located within an opportunity zone. Easy to manage. One home is currently leased to Section 8 while the other is leased to a long term tenant. Renovations include: All new wood cabinets w/ quartz countertops & stainless-steel appliances and updated luxury vinyl plank flooring. Unique feature of this duplex is the buildings are detached homes appealing to single family renters which tend to pay a premium when compared to traditional duplexes. Low maintenance, impressive finishes & headache free easy to manage. Proximity to Design District, Wynwood and Edgewater has fueled the gentrification of neighborhood.
-
2023-10-10$784,900 Active 809-char remark
Show marketing remark (809 chars)
Turnkey solution for passive investors located in a booming area with an actual cap rate of 8.03% and a pro forma cap rate of 8.44%. 2008 built duplex completely renovated in 2023 and located within an opportunity zone. Easy to manage. One home is currently leased to Section 8 while the other is leased to a long term tenant. Renovations include: All new wood cabinets w/ quartz countertops & stainless-steel appliances and updated luxury vinyl plank flooring. Unique feature of this duplex is the buildings are detached homes appealing to single family renters which tend to pay a premium when compared to traditional duplexes. Low maintenance, impressive finishes & headache free easy to manage. Proximity to Design District, Wynwood and Edgewater has fueled the gentrification of neighborhood.
ⓘ Source: listings_history table (triggers on properties + properties_extension) + one-shot
backfill from property_details.listing_events for pre-trigger history.
Tax reassessment forecast FL · Resets to sale price
- Current annual tax
- $10,890 · $907/mo
- Projected year-2 tax
- $10,890 · $907/mo
- Expected delta
- $0/yr ($0/mo · 0.0%)
ⓘ Screening estimate from a state-policy table — verify with the county assessor before closing.
Climate risk First Street
- Flood 4/10 Moderate FEMA zone X (unshaded) · 22% chance over 30 yrs
- Wildfire 1/10 Low
- Heat 10/10 Extreme 7 d/yr ≥103°F today · 29 d/yr by 30 yrs out
- Wind 10/10 Extreme 99% chance of damaging wind over 30 yrs
- Air quality 2/10 Low 1 unhealthy d/yr today · 1 by 30 yrs out
Nearby sold comps map
Loading sold comps map…
Walkable amenities ~0.75 mi
Loading nearby amenities…
Taxation est. · year 1
- Rental income
- $65,592
- − Mortgage interest
- −$41,452
- − Property taxes
- −$10,890
- − Insurance
- −$3,700
- − Repairs & maintenance
- −$5,247
- − Management
- −$5,247
- − Depreciation
- −$21,527
- Taxable loss
- −$22,471
- Est. tax savings @ 24.0%
- +$5,393
- After-tax cash flow
- $-3,947/yr
For passive investors: Depreciation is non-cash, so a rental often shows a tax loss while cash-flowing — sheltering income. Rental losses are passive: they offset passive income freely, and up to $25,000/yr can offset ordinary (W-2) income if you actively participate and your MAGI is under $100k (phasing out to $0 by $150k); unused losses carry forward. On sale, claimed depreciation is recaptured at up to 25%, and gains may owe capital-gains tax (a 1031 exchange can defer both). Figures are a year-1 estimate at your 24.0% rate — not tax advice; consult a CPA.
Schools (NCES district)
- District
- Miami-Dade
- NCES district ID
- 1200390
- Math proficiency
- 45% ▼ -16.00%
- Reading proficiency
- 54% ▼ -5.00%
- Median HH income
- $43,928
- Composite
- 41.76/100
- National rank
- #3397
- State rank
- #40 of 73 in FL
Livability — Miami
- Score
- 78/100
- State rank
- #177
- US rank
- #2724
Category grades
Schools grade is shown separately in the Schools card above.
Census & demographics
- Census place
- Miami, FL
- County
- Miami-Dade County · 2,697,751 people
- City population
- 827,308
- Metro
- Miami-Fort Lauderdale-Pompano Beach, FL
- Population (ZIP)
- 26,786
- Household income
- $41,230
- Rent vs Own
- Severe rent burden
- 2523.0
Population outlook (Miami-Dade County) Hauer SSP2
- Today (2025)
- 3,126,439 people
- By 2030
- 3,325,765 · +6.4%
- By 2040
- 3,697,561 · +18.3%
- By 2050
- 4,012,134 · +28.3%
- By 2075
- 4,605,612 · +47.3%
- By 2100
- 4,866,598 · +55.7%
Race, ethnicity, and origin ACS 2023
- Neighborhood character
- Majority Hispanic (55%)
- Race & ethnicity
- Hispanic / Latino 55% Black 39% Two or more races 30% White 4%
- Hispanic origin (detail)
- Mexican 2% Puerto Rican 6% Cuban 9% Dominican 5%
- Common ancestry
- Hispanic 11%
- Foreign-born
- 43% · Canada, Jamaica, Dominican Republic
- Languages at home
- 34% English-only · Spanish 53% French/Haitian/Cajun 12%
Political lean MEDSL · Miami-Dade
- 2024 margin
- R (+11.4) · D 43.9% · R 55.4%
- 2008→2024 swing
- -27.6pp toward R · 2008: 16.1pp · 2024: -11.4pp
- All cycles
- 2024: R+11.4 2020: D+7.3 2016: D+29.6 2012: D+23.7 2008: D+16.1
Not yet ingested
- Civics
- —
Market trends
- HPI YoY
- ▼ -293.00%
- Current HPI
- 680.1845
- Rent YoY
- ▲ 2.26%
- Metro
- Miami-Fort Lauderdale-Pompano Beach, FL
- State GDP YoY
- ▲ 3.28%
- F500 in state
- 36
Industry mix (Fortune 500 HQ in FL)
| Industry | F500 HQs | Revenue |
|---|---|---|
| Industrial Technology | 2 | $29B |
|
||
| Insurance | 2 | $17B |
|
||
| Retail | 1 | $60B |
|
||
| Technology Distribution | 1 | $58B |
|
||
| Homebuilding | 1 | $35B |
|
||
| Technology Manufacturing | 1 | $35B |
|
||
Price history
-5.7% since first listed35 events — show timeline
- 2026-04-13 Pending — MARMLS
- 2026-04-08 Price Changed $740,000 MARMLS
- 2026-04-03 Price Changed $749,000 MARMLS
- 2026-04-02 Price Changed $400,000 MARMLS
- 2026-04-02 Relisted — MARMLS
- 2026-03-05 Listing Removed — MARMLS
- 2026-03-04 Price Changed $794,900 MARMLS
- 2026-03-02 Price Changed $774,900 MARMLS
- 2026-02-17 Relisted — MARMLS
- 2026-02-16 Price Changed $784,900 MARMLS
- 2026-02-06 Price Changed $779,900 MARMLS
- 2026-01-02 Price Changed $775,900 MARMLS
- 2026-01-02 Price Changed $786,900 MARMLS
- 2025-12-16 Price Changed $784,900 MARMLS
- 2025-12-10 Relisted — MARMLS
- 2025-11-28 Listing Removed — MARMLS
- 2025-11-06 Price Changed $814,900 MARMLS
- 2025-10-30 Price Changed $794,900 MARMLS
- 2025-09-02 Price Changed $784,900 MARMLS
- 2025-08-28 Price Changed $818,000 MARMLS
- 2025-08-22 Price Changed $813,000 MARMLS
- 2025-07-16 Price Changed $810,000 MARMLS
- 2025-06-26 Relisted — MARMLS
- 2025-06-09 Listing Removed — MARMLS
- 2025-06-02 Price Changed $799,999 MARMLS
- 2025-06-02 Price Changed $848,000 MARMLS
- 2025-05-28 Price Changed $849,000 MARMLS
- 2025-05-13 Price Changed $849,900 MARMLS
- 2025-05-11 Price Changed $897,100 MARMLS
- 2025-04-15 Price Changed $897,143 MARMLS
- 2025-04-15 Listed $989,500 MARMLS
- 2023-11-21 Sold (Public Records) $784,900 Public Records
- 2023-11-20 Sold (MLS) $784,900 MARMLS
- 2023-10-20 Pending — MARMLS
- 2023-10-10 Listed $784,900 MARMLS
Property tax history
+8.6%/yrLatest (2025): $10,890 · +7.3% YoY. Source: county tax records.
Cash-flow waterfall
monthlySold comps — $/sqft
last 12 mo · ≤1 miLoading sold comps…