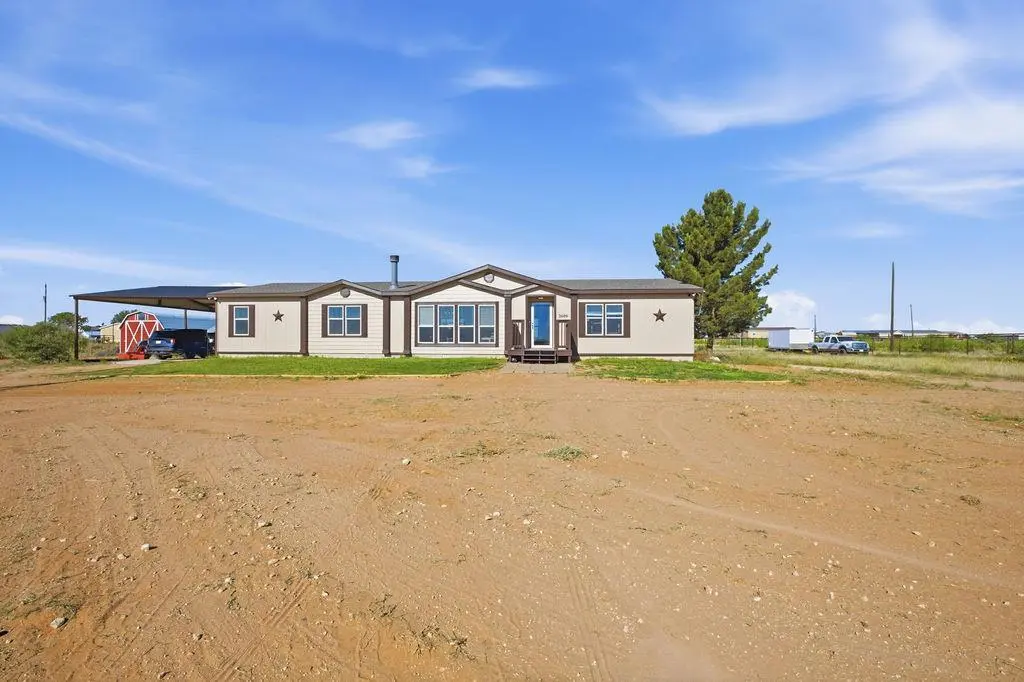
2608 S County Rd 1050 · Stanton, TX
Flood risk 1/10 · Minimal
- FEMA flood zone
- X
- Chance of flooding over 30 yrs
- 0.0%
- Est. flood insurance / yr
- $507 – $1,088
Fire risk 4/10 · Minor
- Est. fire insurance / yr
- $1,222 – $2,270
Heat risk 6/10 · Moderate
- Hot days now (above 102°F)
- 7 days/yr
- Hot days in 30 yrs
- 22 days/yr
Wind risk 3/10 · Minor
- Chance of severe wind over 30 yrs
- 8.0%
Air-quality risk 1/10 · Minimal
- Unhealthy air days now
- 0 days/yr
- Unhealthy air days in 30 yrs
- 0 days/yr
Risk factors via First Street. Map © Google.
Why this score? — see what drove the C- grade
The composite is a weighted blend of 9 inputs, each scored 0–100. Each bar is that input's sub-score; the figure is the points it added to the 100-point composite (weight × sub-score).
- Cash flow +13.9/30.0
- Appreciation +8.1/10.0
- ARV discount +7.5/15.0
- DSCR +4.2/10.0
- Schools +4.1/10.0
- Livability +3.8/5.0
- 1% rule +3.5/10.0
- Rent growth +2.5/5.0
- Condition / age +2.5/5.0
$319,000
🖨 Deal sheet (PDF) 📄 Offer letter ✓ Due diligence
Listing remarks
3 bed, 2 bath home on 1.16 acres in Greenwood with beautifully landscaped front and back lawns! Spacious living area features a wood-burning fireplace and so much room for activities! Kitchen offers a large island, dry bar, and separate formal dining room! Guest bedrooms feature large walk-in closets, and the spacious primary suite also includes a walk-in closet plus a bonus side room perfect for an office or reading nook! Primary bath has dual sinks, vanity, and separate tub! Storage building included! Water well report available!
Key facts
- Formal dining room
- Dry bar
- Walk-in closets
Tags
Property features AI
Exterior
- Parking: Carport with 2 spaces
- Security: Smoke detector(s)
- Utilities: Private well water; Septic tank
- Home design: Manufactured single-family home; Single-story
- Construction: Composition and metal roof
- Exterior features: Patio; Deck; Wood fencing; Shed(s)
Interior
- Kitchen: Dishwasher; Microwave; Electric range
- Flooring: Carpet; Tile
- Bathrooms: 2 full bathrooms
- Heating & cooling: Central heating (electric); Central air; Ceiling fans
- Interior features: Dishwasher; Microwave; Electric range; Electric water heater; Wood-burning fireplace in the living room; Smoke detector(s)
- Laundry & utility: Electric water heater
Neighborhood map
What this means for you Summary
Snapshot
- This is a 3-bed/2.0-bath manufactured listed at $319k.
Deal economics
- At list price, monthly cash flow is $34 ($410/yr) — positive.
- The deal already cash-flows at list — no discount required.
- To meet the 1% rule (rent ≥ 1% of price), the offer needs to be $271k (15.0% below list).
- Recommended offer: $271k (15.0% below list) — sets the bar for 1% rule.
Location & tenants
- Location reads 75/100 on livability (#140 in TX, #4,008 nationally) — a middle-class / working-renter tenant base. Strengths: cost of living A+, housing A+, health & safety A+; Watch: amenities F, commute F.
- Greenwood ISD (rural): math 45% / reading 44% proficiency, ranked #220 of 826 in TX (top 27%) — families likely to look elsewhere, expect single-tenant / working-renter base with shorter leases.
- Zoned schools: Greenwood El (795 students, 45% FRL); Greenwood H S (math 51% / reading 53%, grade D+, #447 of 1,632 statewide, top 29%, 808 students, 33% FRL).
- Market conditions: 39 active listings in the ZIP; 12 comparable units currently listed for rent nearby; rentals at typical pace (median 22d on market — plan ~3-4 weeks tenant-placement turnaround); 1,504 units permitted in Midland County in 2024 (0 in 5+ unit buildings).
Forward outlook
- In year one you build about $22k of equity ($2k loan paydown + $20k appreciation (6.3% local appreciation)).
- Midland County population projected at +83% by 2050 — long-run rental-demand tailwind backs the buy-and-hold thesis.
- At projected returns (6.3% appreciation + 3.0% rent growth), your $89k cash investment doubles in ~4 years — after that, you're playing with house money.
- By year 2, paydown + projected appreciation supports a ~$36k cash-out refi (75% LTV) — recoverable capital for the next deal without selling this one.
Negotiation context
- It's been on market 36 days — a 3% lower offer ($309k) is reasonable based on typical stale-listing flexibility.
Risks & watch-outs
- Climate carrying-cost: extreme-heat days projected 7→22/yr by 2055 (HVAC capex compounding) — expect insurance premiums to compound above CPI over the hold.
Questions for the listing agent
- It's been on market 36 days. Have you received any prior offers? Is the seller open to a 15% concession, seller financing, or rate buy-down credit?
- Is there a deadline driving the sale (1031 exchange, divorce, estate, relocation)? That informs how much negotiation room exists.
- Schools are D-rated, which usually means shorter tenancies and higher turnover. Who's the typical renter profile here, and what's been the actual vacancy rate?
- What's the average days-on-market for RENTAL listings here right now (not sales)? A rising rental-DOM trend means longer vacancies and softer asking-rent achievability than the comps imply.
- What's the recent tenant-quality profile in this submarket — average credit score on applications, eviction rate, late-payment / NSF rate, and stable-employment percentage? A property-management company in the area should have these aggregated.
- How much new for-sale + rental construction is in the pipeline within 1–3 miles? Heavy new supply typically softens prices + rents 12–24 months out; constrained supply supports both.
Investment metrics
- 1% rule
- 0.85% ✗
- Cap rate
- 6.42%
- Cash-on-cash
- 0.46%
- DSCR
- 1.02
- GRM
- 9.8
CMA / ARV
No comps found within radius.
Projected returns pro-forma
6.3% appreciation · 3.0% rent growth · sell at horizon
- IRR
- 16.4%
- Equity multiple
- 2.12×
- Total profit
- $99,894
- Equity at exit
- $206,528
- IRR
- 16.2%
- Equity multiple
- 4.25×
- Total profit
- $290,694
- Equity at exit
- $379,811
Cash invested: $89,320 (down + closing). Projections, not guarantees.
Landlord ↔ Tenant lean methodology
- Overall (STATE)
- 87 Strongly Landlord-Friendly
- State Texas
- 87 Strongly Landlord-Friendly · R+5
- County
- — inherits STATE
- City
- — inherits STATE
ZIP-level market 79782
- Home prices YoY
- 3.3%
- Active inventory
- 39
- Price-to-rent
- 9.8×
Monthly cashflow live
- Estimated rent
- $2,712 high interval (Pro) →
- Mortgage (P&I)
- −$1,673
- Tax from tax record
- −$303 /mo · $3,632/yr
- Insurance
- −$133
- HOA
- −$0
- Vacancy / Maint / Mgmt
- −$570
- Net cashflow
- $34
Break-even live
Sensitivity live
| Price | -10% $215 | -5% $124 | +0% $34 | +5% $-56 | +10% $-146 |
|---|---|---|---|---|---|
| Rent | -10% $-180 | -5% $-73 | +0% $34 | +5% $141 | +10% $248 |
| Rate | -1.0pp $195 | -0.5pp $115 | base $34 | +0.5pp $-48 | +1.0pp $-133 |
UW: 25.0% down · 7.5% · 30yr · 1.5% tax · 5.0% vac · 8.0% maint · 8.0% mgmt
Financing live
Cash to close
- Down payment
- $79,750
- Closing costs
- $9,570
- Reserves months
- —
- Total cash needed
- —
Loan-product check · same deal, 3 products live
Conventional
25% down · 7.5% · 30yr
- Down + closing
- —
- Monthly P&I
- —
- Monthly cashflow
- —
- DSCR
- —
- Eligible?
- —
Personal DTI + credit; lowest rate.
DSCR
20% down · 8.5% · 30yr
- Down + closing
- —
- Monthly P&I
- —
- Monthly cashflow
- —
- DSCR
- —
- Eligible?
- —
No personal income docs; deal must DSCR.
Hard money
10% down · 12.0% · 12mo
- Down + closing
- —
- Monthly P&I
- —
- Monthly cashflow
- —
- DSCR
- —
- Eligible?
- —
Short-term bridge; refi at stabilization.
Rent comps 12 comps
| Address | Beds | Baths | Sqft | Rent | $/sqft | DOM | Units | Dist |
|---|---|---|---|---|---|---|---|---|
| 8601 E County Road 110 Midland, TX | 4.0 | 3.0 | 1782 | $3,485 | $1.96 | 44d | 1 | 0.47mi |
| 8503 E County Road 110 Midland, TX | 3.0 | 2.0 | 1616 | $2,250 | $1.39 | 21d | 1 | 0.47mi |
| 8503 E County Road 110 Midland, TX | 3.0 | 2.0 | 1616 | $2,250 | $1.39 | 14d | 1 | 0.47mi |
| 8601 E County Road 110 Midland, TX | 4.0 | 3.0 | 1782 | $2,904 | $1.63 | 14d | 1 | 0.47mi |
| 8435 E County Road 110 Midland, TX | 3.0 | 2.0 | 1616 | $2,250 | $1.39 | 21d | 1 | 0.47mi |
| 8435 E County Road 110 Midland, TX | 3.0 | 2.0 | 1616 | $2,250 | $1.39 | 14d | 1 | 0.47mi |
| 8517 E County Road 110 Midland, TX | 4.0 | 3.0 | 1782 | $3,485 | $1.96 | 14d | 1 | 0.47mi |
| 8513 E County Road 110 Midland, TX | 3.0 | 2.0 | 1616 | $2,250 | $1.39 | 21d | 1 | 0.93mi |
| 8425 E County Road 110 Midland, TX | 3.0 | 2.0 | 1616 | $2,250 | $1.39 | 21d | 1 | 0.93mi |
| 8425 E County Road 110 Midland, TX | 3.0 | 2.0 | 1616 | $3,070 | $1.90 | 44d | 1 | 0.93mi |
| 8513 E County Road 110 Midland, TX | 3.0 | 2.0 | 1616 | $3,070 | $1.90 | 44d | 1 | 0.93mi |
| 14806 Farm to Market 307 Midland, TX | 3.0 | 2.0 | 2233 | $2,800 | $1.25 | 44d | 1 | 1.46mi |
Listing history 19 events
-
2026-06-19days on market $319,000 Active 36 DOM
-
2026-06-18days on market $319,000 Active 35 DOM
-
2026-06-17days on market $319,000 Active 34 DOM
-
2026-06-16days on market $319,000 Active 33 DOM
-
2026-06-15days on market $319,000 Active 32 DOM
-
2026-06-14days on market $319,000 Active 30 DOM
-
2026-06-13days on market $319,000 Active 29 DOM
-
2026-06-10days on market $319,000 Active 27 DOM
-
2026-06-09days on market $319,000 Active 26 DOM
-
2026-06-08days on market $319,000 Active 25 DOM
-
2026-06-07days on market $319,000 Active 24 DOM
-
2026-06-02days on market $319,000 Active 19 DOM
-
2026-06-01days on market $319,000 Active 18 DOM
-
2026-05-31days on market $319,000 Active 17 DOM
-
2026-05-30days on market $319,000 Active 16 DOM
-
2026-05-14$319,000 Active 537-char remark
-
2023-06-15soldstatus
-
2022-07-21price $292,500
-
2014-08-04soldstatus
ⓘ Source: listings_history table (triggers on properties + properties_extension) + one-shot
backfill from property_details.listing_events for pre-trigger history.
Tax reassessment forecast TX · Resets to sale price
- Current annual tax
- $3,632 · $303/mo
- Projected year-2 tax
- $5,838 · $486/mo
- Expected delta
- +$2,206/yr (+$184/mo · 60.7%)
ⓘ Screening estimate from a state-policy table — verify with the county assessor before closing.
Climate risk First Street
- Flood 1/10 Low FEMA zone X · 0% chance over 30 yrs
- Wildfire 4/10 Moderate
- Heat 6/10 Major 7 d/yr ≥102°F today · 22 d/yr by 30 yrs out
- Wind 3/10 Moderate 8% chance of damaging wind over 30 yrs
- Air quality 1/10 Low 0 unhealthy d/yr today · 0 by 30 yrs out
Nearby sold comps map
Loading sold comps map…
Walkable amenities ~0.75 mi
Loading nearby amenities…
Taxation est. · year 1
- Rental income
- $32,547
- − Mortgage interest
- −$17,869
- − Property taxes
- −$3,632
- − Insurance
- −$1,595
- − Repairs & maintenance
- −$2,604
- − Management
- −$2,604
- − Depreciation
- −$9,280
- Taxable loss
- −$5,037
- Est. tax savings @ 24.0%
- +$1,209
- After-tax cash flow
- $1,619/yr
For passive investors: Depreciation is non-cash, so a rental often shows a tax loss while cash-flowing — sheltering income. Rental losses are passive: they offset passive income freely, and up to $25,000/yr can offset ordinary (W-2) income if you actively participate and your MAGI is under $100k (phasing out to $0 by $150k); unused losses carry forward. On sale, claimed depreciation is recaptured at up to 25%, and gains may owe capital-gains tax (a 1031 exchange can defer both). Figures are a year-1 estimate at your 24.0% rate — not tax advice; consult a CPA.
Schools (NCES district)
- District
- Greenwood ISD
- NCES district ID
- 4821750
- Math proficiency
- 45% ▲ 4.00%
- Reading proficiency
- 44% ▲ 1.00%
- Median HH income
- $74,012
- Composite
- 40.54/100
- National rank
- #3701
- State rank
- #220 of 826 in TX
Livability — Stanton
- Score
- 75/100
- State rank
- #140
- US rank
- #4008
Category grades
Schools grade is shown separately in the Schools card above.
Census & demographics
- Population (ZIP)
- 3,831
Population outlook (Midland County) Hauer SSP2
- Today (2025)
- 220,895 people
- By 2030
- 253,667 · +14.8%
- By 2040
- 325,498 · +47.4%
- By 2050
- 404,168 · +83.0%
- By 2075
- 609,802 · +176.1%
- By 2100
- 760,172 · +244.1%
Race, ethnicity, and origin ACS 2023
- Neighborhood character
- Majority Hispanic (53%)
- Race & ethnicity
- Hispanic / Latino 53% White 43% Two or more races 8% Black 2%
- Hispanic origin (detail)
- Mexican 51%
- Common ancestry
- Slovak 1% Italian 1% Scotch-Irish 1%
- Foreign-born
- 10% · Canada
- Languages at home
- 65% English-only · Spanish 33% German/W. Germanic 2%
Political lean MEDSL · Midland
- 2024 margin
- Solid R (+60.5) · D 19.3% · R 79.8%
- 2008→2024 swing
- -3.3pp toward R · 2008: -57.3pp · 2024: -60.5pp
- All cycles
- 2024: R+60.5 2020: R+56.6 2016: R+55.2 2012: R+61.5 2008: R+57.3
Not yet ingested
- Civics
- —
Market trends
- HPI YoY
- ▲ 6.30%
- Current HPI
- 195.1131
- Rent YoY
- —
- Metro
- —
- State GDP YoY
- ▲ 3.95%
- F500 in state
- 110
Industry mix (Fortune 500 HQ in TX)
| Industry | F500 HQs | Revenue |
|---|---|---|
| Energy | 16 | $1,198B |
|
||
| Technology | 5 | $198B |
|
||
| Engineering / Construction | 4 | $72B |
|
||
| Energy Services | 3 | $60B |
|
||
| Utilities | 3 | $41B |
|
||
| Healthcare | 2 | $330B |
|
||
Price history
+9.1% since first listed4 events — show timeline
- 2026-05-14 Listed $319,000 PBBOR
- 2023-06-15 Sold (Public Records) — Public Records
- 2022-07-21 Price Changed $292,500 PBBOR
- 2014-08-04 Sold (Public Records) — Public Records
Property tax history
+7.6%/yrLatest (2025): $3,632 · -1.7% YoY. Source: county tax records.
Cash-flow waterfall
monthlySold comps — $/sqft
last 12 mo · ≤1 miLoading sold comps…