 Duplex
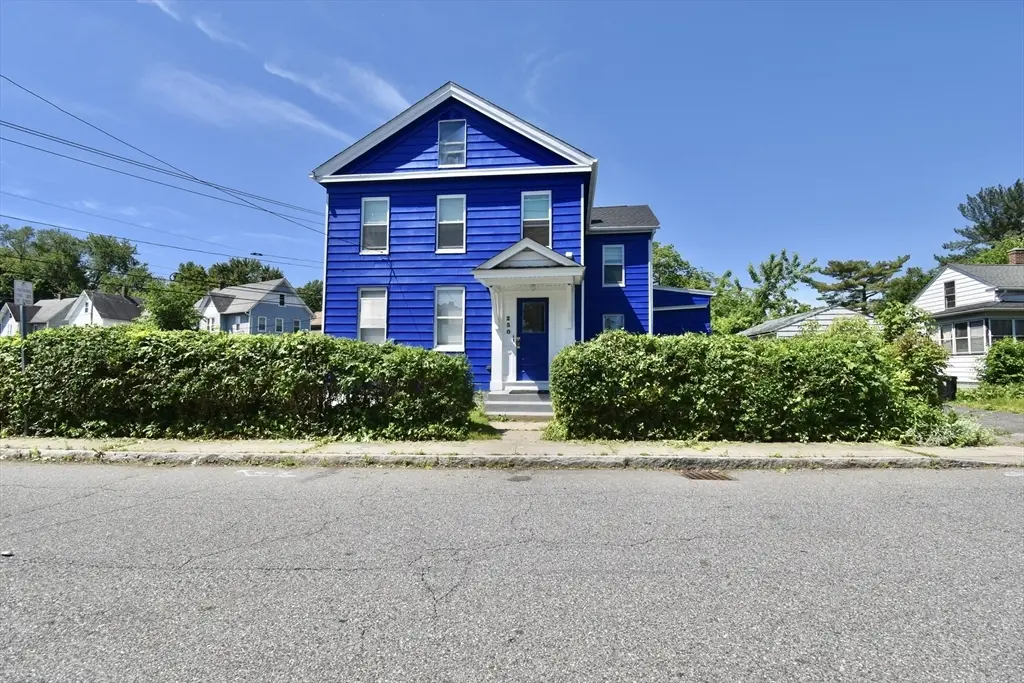
250 School St · Chicopee, MA
Flood risk 1/10 · Minimal
- FEMA flood zone
- X (unshaded)
- Chance of flooding over 30 yrs
- 0.0%
- Est. flood insurance / yr
- $473 – $860
Fire risk 1/10 · Minimal
- Est. fire insurance / yr
- $915 – $1,699
Heat risk 4/10 · Minor
- Hot days now (above 98°F)
- 7 days/yr
- Hot days in 30 yrs
- 16 days/yr
Wind risk 5/10 · Moderate
- Chance of severe wind over 30 yrs
- 23.0%
Air-quality risk 2/10 · Minimal
- Unhealthy air days now
- 1 days/yr
- Unhealthy air days in 30 yrs
- 2 days/yr
Risk factors via First Street. Map © Google.
Why this score? — see what drove the D- grade
The composite is a weighted blend of 9 inputs, each scored 0–100. Each bar is that input's sub-score; the figure is the points it added to the 100-point composite (weight × sub-score).
- Cash flow +16.9/30.0
- DSCR +5.3/10.0
- 1% rule +3.8/10.0
- Livability +3.8/5.0
- Rent growth +2.5/5.0
- Condition / age +2.5/5.0
- Schools +2.3/10.0
- ARV discount +0.0/15.0
- Appreciation +0.0/10.0
$429,900
🖨 Deal sheet (PDF) 📄 Offer letter ✓ Due diligence
Multi-family units
County records classify this as Multi-Family (2-4 Unit). Listing-text estimate: 2 units. confirmed
Listing remarks MLS
Come check out this 2 unit property featuring 8 rooms, 4 bedrooms and 2 bathrooms. Buyer to verify all info and use.
Key facts
- Move-in ready
- Fully renovated
- Updated windows
Tags
Property features AI
Finance
- HOA & community: Access to public transportation; Nearby medical facility; Highway access; Nearby house of worship; Nearby public school
Exterior
- Parking: 1-car garage; 1 covered parking space; 2 open parking spaces; Paved parking; Total 3 parking spaces
- Utilities: Public water; Public sewer; Electric service with circuit breakers
- Home design: Multi-family property; 2 stories
- Construction: Frame construction; Block foundation; Shingle roof; Built (public records)
- Exterior features: Fenced lot; Enclosed porch/patio; Rain gutters; Corner lot; Public road frontage
Interior
- Kitchen: Electric range (electric hookup provided)
- Bedrooms: Unit 1: 1 level; Unit 2: 1 level (2 floors listed)
- Flooring: Vinyl, Laminate, Hardwood
- Bathrooms: 3 full bathrooms
- Interior features: Insulated windows; Finished full basement with interior entry and concrete floor; 10 total rooms
- Laundry & utility: Circuit breaker electric panel
Neighborhood map
What this means for you Summary
Snapshot
- This is a 2 × 2-bed/1-bath units multifamily listed at $430k.
Deal economics
- At list price, monthly cash flow is $284 ($3k/yr) — positive. Per door: $142/mo.
- The deal already cash-flows at list — no discount required.
- To meet the 1% rule (rent ≥ 1% of price), the offer needs to be $379k (11.9% below list).
- Recommended offer: $379k (11.9% below list) — sets the bar for 1% rule.
- Cap rate 7.1% vs local median 4.6% in Chicopee — top-decile yield for the area; either an underpriced asset or a hidden risk that comps aren't pricing in. Stress-test before assuming the spread holds.
Location & tenants
- Location reads 76/100 on livability (#66 in MA, #3,658 nationally) — a middle-class / working-renter tenant base. Strengths: commute A+, housing A+, health & safety A+; Watch: employment D+, crime F, amenities F.
- Chicopee (suburban): math 20% / reading 33% proficiency, ranked #270 of 302 in MA (top 89%) — low school quality limits family demand, transient renter base, plan for 1-2y turnover.
- Zoned schools: Bowe (math 16% / reading 31%, grade F, #745 of 938 statewide, top 80%, 409 students, 0% FRL); Dupont Middle (math 18% / reading 25%, grade F, #249 of 305 statewide, top 82%, 696 students, 0% FRL); Chicopee High (math 26% / reading 38%, grade F, #255 of 343 statewide, top 77%, 914 students, 0% FRL) — zoned schools average 0% FRL vs 56% district-wide (56 pts lower); this property's tenant base skews higher-income than the district average.
- Market conditions: 13 active listings in the ZIP; 453 units permitted in Hampden County in 2024 (116 in 5+ unit buildings).
- At $3,786/mo this rent would consume 76% of the median local household income ($60k/yr) (locally 895% of renters already pay >50% of income on rent) — very limited rent-growth headroom before tenants either downsize or default.
Forward outlook
- Local home prices are declining (-3.0%/yr); year-one equity from $3k of loan paydown is wiped out by about $13k of value loss. Plan a longer hold.
- Hampden County population projected at +5% by 2050 — modest demand growth; plan on rents tracking national, not racing it.
Negotiation context
- It's been on market 25 days — a 2% lower offer ($423k) is reasonable based on typical stale-listing flexibility.
- 2 sale attempts since 3y ago with the ask held roughly flat each time — persistent listings suggest the price (not the market) is what's stuck; bring a comps-based counter.
- Current owner paid $235k; list at $430k implies a 83% gain — meaningful room to come down on a strong offer.
Risks & watch-outs
- Watch-outs: built in 1920 — expect roof / HVAC / electrical / plumbing capex.
- Climate carrying-cost: moderate wind risk, 23% chance of damaging wind over 30y — expect insurance premiums to compound above CPI over the hold.
Questions for the listing agent
- Can we see the unit-by-unit rent roll, current vacancy, and any below-market leases? What's the average tenancy length?
- What capital expenditures (roof, boiler, parking lot, exteriors) have been made in the last 5 years, and what's planned in the next 2?
- Built in 1920 — when were the roof, HVAC, electrical panel, plumbing, and water heater last replaced?
- Is there a deadline driving the sale (1031 exchange, divorce, estate, relocation)? That informs how much negotiation room exists.
- Schools are D-rated, which usually means shorter tenancies and higher turnover. Who's the typical renter profile here, and what's been the actual vacancy rate?
- Crime grade is F in this area — have there been break-ins, vandalism, or insurance claims at this property in the last 3 years? What carrier currently insures it and at what premium?
- The area grade is low — what's the realistic commute time and amenity access for the typical tenant pool here? Any planned neighborhood developments (good or bad) we should know about?
- What's the average days-on-market for RENTAL listings here right now (not sales)? A rising rental-DOM trend means longer vacancies and softer asking-rent achievability than the comps imply.
- What's the recent tenant-quality profile in this submarket — average credit score on applications, eviction rate, late-payment / NSF rate, and stable-employment percentage? A property-management company in the area should have these aggregated.
- How much new apartment / multifamily construction is in the pipeline within 1–3 miles? Heavy new supply (>2% of stock underway) typically softens rents 12–24 months out; light construction supports rent growth.
Investment metrics
- 1% rule
- 0.88% ✗
- Cap rate
- 7.09%
- Cash-on-cash
- 2.83%
- DSCR
- 1.13
- GRM
- 9.5
CMA / ARV
- ARV (on-the-fly)
- $359,290
- Comps found
- 9
Show comp detail 9 sales within ~0.75 mi
| Address | Dist | Beds/Ba | Sqft | Sold | Price | $/sf | Match |
|---|---|---|---|---|---|---|---|
| 16 Abbey St | 0.32mi | 4/4.0 | 2,288 (-1%) | 5mo | $397,500 | $174 | 70 |
| 80 Orchard St | 0.38mi | 4/2.0 | 2,228 (-4%) | 8mo | $420,000 | $189 | 69 |
| 112 Grape St | 0.14mi | 4/2.5 | 2,108 (-9%) | 9mo | $220,000 | $104 | 69 |
| 14-16 Chestnut St | 0.31mi | 5/2.0 (+1) | 2,160 (-7%) | 5mo | $242,500 | $112 | 65 |
| 57- 59 Stearns Ter | 0.27mi | 5/2.0 (+1) | 2,572 (+11%) | 3mo | $400,000 | $156 | 61 |
| 127 Cyman Dr | 0.53mi | 4/2.0 | 2,220 (-4%) | 8mo | $215,000 | $97 | 61 |
| 253 Fairview Ave | 0.60mi | 4/2.0 | 2,244 (-3%) | 16mo | $370,500 | $165 | 54 |
| 315 Front St | 0.26mi | 5/3.0 (+1) | 2,656 (+15%) | 12mo | $411,000 | $155 | 45 |
| 50-52 Sherman Ave | 0.72mi | 4/2.0 | 2,088 (-10%) | 18mo | $268,500 | $129 | 35 |
Match score weights: distance 35% · size 25% · config 20% · recency 20%. Top-matched comps best support the ARV.
Projected returns pro-forma
-3.0% appreciation · 3.0% rent growth · sell at horizon
- IRR
- -11.9%
- Equity multiple
- 0.57×
- Total profit
- $-51,682
- Equity at exit
- $64,099
- IRR
- -2.7%
- Equity multiple
- 0.82×
- Total profit
- $-22,143
- Equity at exit
- $37,170
Cash invested: $120,372 (down + closing). Projections, not guarantees.
Landlord ↔ Tenant lean methodology
- Overall (STATE)
- 20 Strongly Tenant-Friendly
- State Massachusetts
- 20 Strongly Tenant-Friendly · D+15
- County
- — inherits STATE
- City
- — inherits STATE
ZIP-level market 01013
- Home prices YoY
- -23.1%
- Active inventory
- 13
- Price-to-rent
- 18.9×
Monthly cashflow live
- Estimated rent
- $3,786 high interval (Pro) →
- Mortgage (P&I)
- −$2,254
- Tax from tax record
- −$273 /mo · $3,281/yr
- Insurance
- −$179
- HOA
- −$0
- Vacancy / Maint / Mgmt
- −$795
- Net cashflow
- $284
Break-even live
Sensitivity live
| Price | -10% $527 | -5% $406 | +0% $284 | +5% $162 | +10% $41 |
|---|---|---|---|---|---|
| Rent | -10% $-15 | -5% $134 | +0% $284 | +5% $434 | +10% $583 |
| Rate | -1.0pp $500 | -0.5pp $393 | base $284 | +0.5pp $173 | +1.0pp $59 |
2-unit breakdown (identical units grouped — click to expand)
| Units | Beds | Baths | Est. rent |
|---|---|---|---|
| 2× units | 2 | 1 | $3,786 |
| #1 | 2 | 1 | $1,893 |
| #2 | 2 | 1 | $1,893 |
| Total (2 units) | $3,786 | ||
UW: 25.0% down · 7.5% · 30yr · 1.5% tax · 5.0% vac · 8.0% maint · 8.0% mgmt
Financing live
Cash to close
- Down payment
- $107,475
- Closing costs
- $12,897
- Reserves months
- —
- Total cash needed
- —
Loan-product check · same deal, 3 products live
Conventional
25% down · 7.5% · 30yr
- Down + closing
- —
- Monthly P&I
- —
- Monthly cashflow
- —
- DSCR
- —
- Eligible?
- —
Personal DTI + credit; lowest rate.
DSCR
20% down · 8.5% · 30yr
- Down + closing
- —
- Monthly P&I
- —
- Monthly cashflow
- —
- DSCR
- —
- Eligible?
- —
No personal income docs; deal must DSCR.
Hard money
10% down · 12.0% · 12mo
- Down + closing
- —
- Monthly P&I
- —
- Monthly cashflow
- —
- DSCR
- —
- Eligible?
- —
Short-term bridge; refi at stabilization.
Listing history 21 events
-
2026-06-21days on market $429,900 Active 25 DOM
-
2026-06-18days on market $429,900 Active 22 DOM
-
2026-06-17days on market $429,900 Active 21 DOM
-
2026-06-16days on market $429,900 Active 20 DOM
-
2026-06-15days on market $429,900 Active 19 DOM
-
2026-06-14days on market $429,900 Active 17 DOM
-
2026-06-13days on market $429,900 Active 16 DOM
-
2026-06-10days on market $429,900 Active 14 DOM
-
2026-06-09days on market $429,900 Active 13 DOM
-
2026-06-08days on market $429,900 Active 12 DOM
-
2026-06-07days on market $429,900 Active 11 DOM
-
2026-06-03days on market $429,900 Active 7 DOM
-
2026-06-02days on market $429,900 Active 6 DOM
-
2026-06-01days on market $429,900 Active 5 DOM
-
2026-05-31statusdays on market $429,900 Active 4 DOM
-
2026-05-30days on market $429,900 New 3 DOM
-
2026-05-27$429,900 New
-
2023-03-17soldstatus $235,000 Sold 116-char remark
Show marketing remark (116 chars)
Come check out this 2 unit property featuring 8 rooms, 4 bedrooms and 2 bathrooms. Buyer to verify all info and use.
-
2023-03-02status Under Agreement 116-char remark
Show marketing remark (116 chars)
Come check out this 2 unit property featuring 8 rooms, 4 bedrooms and 2 bathrooms. Buyer to verify all info and use.
-
2023-02-16historical Contingent 116-char remark
Show marketing remark (116 chars)
Come check out this 2 unit property featuring 8 rooms, 4 bedrooms and 2 bathrooms. Buyer to verify all info and use.
-
2023-02-15$230,000 New 116-char remark
Show marketing remark (116 chars)
Come check out this 2 unit property featuring 8 rooms, 4 bedrooms and 2 bathrooms. Buyer to verify all info and use.
ⓘ Source: listings_history table (triggers on properties + properties_extension) + one-shot
backfill from property_details.listing_events for pre-trigger history.
Tax reassessment forecast MA · Partial reset (capped growth)
- Current annual tax
- $3,281 · $273/mo
- Projected year-2 tax
- $4,284 · $357/mo
- Expected delta
- +$1,003/yr (+$84/mo · 30.6%)
ⓘ Screening estimate from a state-policy table — verify with the county assessor before closing.
Climate risk First Street
- Flood 1/10 Low FEMA zone X (unshaded) · 0% chance over 30 yrs
- Wildfire 1/10 Low
- Heat 4/10 Moderate 7 d/yr ≥98°F today · 16 d/yr by 30 yrs out
- Wind 5/10 Major 23% chance of damaging wind over 30 yrs
- Air quality 2/10 Low 1 unhealthy d/yr today · 2 by 30 yrs out
Nearby sold comps map
Loading sold comps map…
Walkable amenities ~0.75 mi
Loading nearby amenities…
Taxation est. · year 1
- Rental income
- $45,432
- − Mortgage interest
- −$24,081
- − Property taxes
- −$3,281
- − Insurance
- −$2,150
- − Repairs & maintenance
- −$3,635
- − Management
- −$3,635
- − Depreciation
- −$12,506
- Taxable loss
- −$3,855
- Est. tax savings @ 24.0%
- +$925
- After-tax cash flow
- $4,333/yr
For passive investors: Depreciation is non-cash, so a rental often shows a tax loss while cash-flowing — sheltering income. Rental losses are passive: they offset passive income freely, and up to $25,000/yr can offset ordinary (W-2) income if you actively participate and your MAGI is under $100k (phasing out to $0 by $150k); unused losses carry forward. On sale, claimed depreciation is recaptured at up to 25%, and gains may owe capital-gains tax (a 1031 exchange can defer both). Figures are a year-1 estimate at your 24.0% rate — not tax advice; consult a CPA.
Schools (NCES district)
- District
- Chicopee
- NCES district ID
- 2503660
- Math proficiency
- 20% ▼ -22.00%
- Reading proficiency
- 33% ▼ -10.00%
- Median HH income
- $46,414
- Composite
- 22.91/100
- National rank
- #7997
- State rank
- #270 of 302 in MA
Livability — Chicopee
- Score
- 76/100
- State rank
- #66
- US rank
- #3658
Category grades
Schools grade is shown separately in the Schools card above.
Census & demographics
- Census place
- Chicopee, MA
- County
- Hampden County · 230,965 people
- City population
- 53,451
- Metro
- Springfield, MA
- Population (ZIP)
- 23,284
- Household income
- $59,759
- Rent vs Own
- Severe rent burden
- 895.0
Population outlook (Hampden County) Hauer SSP2
- Today (2025)
- 485,646 people
- By 2030
- 491,517 · +1.2%
- By 2040
- 500,539 · +3.1%
- By 2050
- 508,827 · +4.8%
- By 2075
- 539,167 · +11.0%
- By 2100
- 545,698 · +12.4%
Race, ethnicity, and origin ACS 2023
- Neighborhood character
- Majority White (58%)
- Race & ethnicity
- White 58% Hispanic / Latino 34% Two or more races 13% Black 3% Asian 2%
- Hispanic origin (detail)
- Puerto Rican 29% Dominican 2%
- Common ancestry
- Romanian 16% Lithuanian 11% Russian 2%
- Foreign-born
- 10% · Canada, Jamaica
- Languages at home
- 70% English-only · Spanish 21% Russian/Polish/Slavic 4% Other Indo-European 3%
Political lean MEDSL · Hampden
- 2024 margin
- Lean D (+8.9) · D 53.4% · R 44.5% · Other 2.1%
- 2008→2024 swing
- -16.4pp toward R · 2008: 25.3pp · 2024: 8.9pp
- All cycles
- 2024: D+8.9 2020: D+17.7 2016: D+16.0 2012: D+25.4 2008: D+25.3
Not yet ingested
- Civics
- —
Market trends
- HPI YoY
- ▼ -89.92%
- Current HPI
- 298.8896
- Rent YoY
- —
- Metro
- Springfield, MA
- State GDP YoY
- ▲ 2.28%
- F500 in state
- 38
Industry mix (Fortune 500 HQ in MA)
| Industry | F500 HQs | Revenue |
|---|---|---|
| Technology | 3 | $17B |
|
||
| Insurance | 2 | $84B |
|
||
| Retail | 2 | $76B |
|
||
| Life Sciences | 1 | $43B |
|
||
| Energy Technology | 1 | $31B |
|
||
| Aerospace / Defense | 1 | $18B |
|
||
Price history
+86.9% since first listed5 events — show timeline
- 2026-05-27 Listed $429,900 MLS PIN
- 2023-03-17 Sold (MLS) $235,000 MLS PIN
- 2023-03-02 Pending — MLS PIN
- 2023-02-16 Contingent — MLS PIN
- 2023-02-15 Listed $230,000 MLS PIN
Property tax history
+2.4%/yrLatest (2023): $3,281 · +2.3% YoY. Source: county tax records.
Cash-flow waterfall
monthlySold comps — $/sqft
last 12 mo · ≤1 miLoading sold comps…