455 W Kelso St Apt 225 · Tucson, AZ
Flood risk 1/10 · Minimal
- FEMA flood zone
- X (unshaded)
- Chance of flooding over 30 yrs
- 0.0%
- Est. flood insurance / yr
- $507 – $1,088
Fire risk 2/10 · Minimal
- Est. fire insurance / yr
- $610 – $1,132
Heat risk 8/10 · Major
- Hot days now (above 107°F)
- 6 days/yr
- Hot days in 30 yrs
- 14 days/yr
Wind risk 1/10 · Minimal
- Chance of severe wind over 30 yrs
- —
Air-quality risk 1/10 · Minimal
- Unhealthy air days now
- 0 days/yr
- Unhealthy air days in 30 yrs
- 0 days/yr
Risk factors via First Street. Map © Google.
Why this score? — see what drove the F grade
The composite is a weighted blend of 9 inputs, each scored 0–100. Each bar is that input's sub-score; the figure is the points it added to the 100-point composite (weight × sub-score).
- ARV discount +7.5/15.0
- Cash flow +6.6/30.0
- Livability +3.7/5.0
- Schools +3.1/10.0
- 1% rule +2.7/10.0
- Rent growth +2.6/5.0
- Condition / age +2.5/5.0
- DSCR +0.9/10.0
- Appreciation +0.0/10.0
$105,000
🖨 Deal sheet 📄 Offer letter ✓ Due diligence
Listing remarks MLS
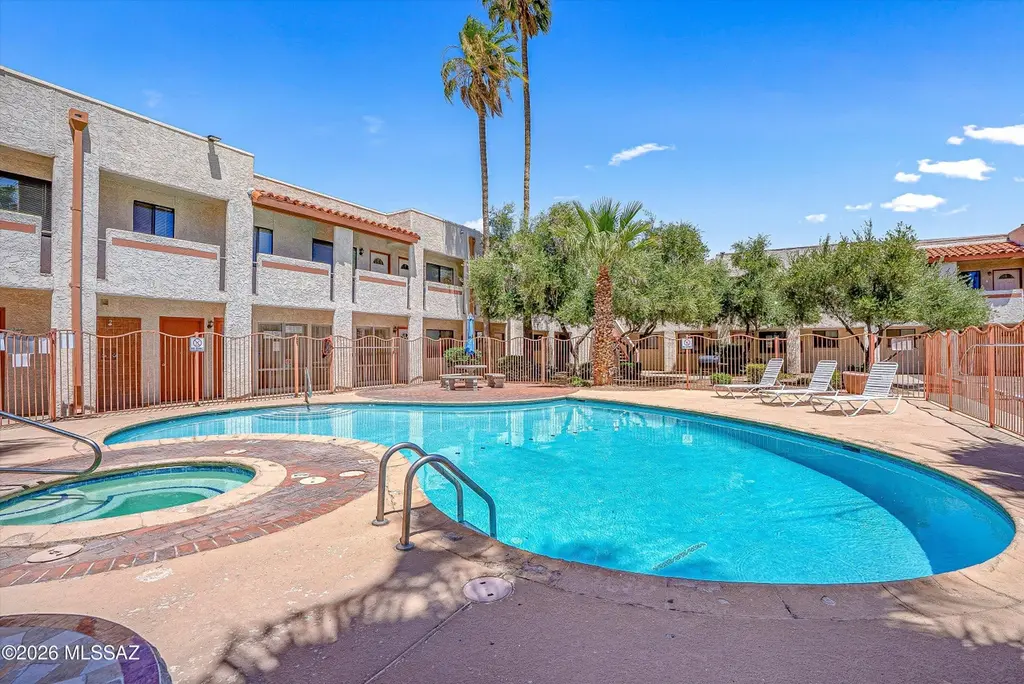
Beautiful Condo, 2nd floor, spacious 1 bedroom and 1 full bath , prime end unit overlooking the relaxing pool & spa. Solid wood cabinetry, laminate wood floors, skylight in kitchen! Large bedroom, high ceilings. NEW water heater, HVAC 2019. Secure gated community in convenient central location. Perfect location for students & winter visitors. On site laundry room plus one assigned parking space. near the side street entry gate. Close to downtown, University of Arizona, Pima College, bus lines, Tucson Mall and Interstate 10. Community features: On site laundry room, pool/spa, community BBQ, and dog run area. HOA includes water, trash , insurance & landscaping maintenance. NEARBY: University of Arizona, mall, restaurants, shopping, bus lines, close to freeway & so much mor
Key facts
- Pool spa access
- Community pool
- Built 1983
Tags
Property features AI
Finance
- Other: Property subtype: Condominium; Lot described as condo; Zoned Tucson - C2
- HOA & community: Association: Stratford; Monthly HOA fees; HOA covers blanket insurance, common area maintenance, exterior maintenance of unit, gated community upkeep, sewer and water; Community pool and spa
Exterior
- Parking: HOA-managed road access
- Security: Gated community; Community security
- Utilities: Public water; Sewer connected
- Home design: Condominium; Two levels; Faces north
- Construction: Wood frame construction; Built-up roof
- Exterior features: Covered patio/porch; Wrought iron fencing; Decorative gravel and shrubs; Previously developed lot; North/South exposure; Paved road
Interior
- Kitchen: Dishwasher; Refrigerator; Electric cooktop; Electric oven; Microwave
- Bedrooms: 1 bedroom
- Flooring: Ceramic tile; Engineered wood
- Bathrooms: 1 full bathroom
- Heating & cooling: Electric heating; Central air conditioning
- Interior features: Exhaust fan; Security gate (community)
- Laundry & utility: Community laundry available
Neighborhood map
What this means for you Summary
Snapshot
- This is a 1-bed/1.0-bath condo listed at $105k.
Deal economics
- At list price, monthly cash flow is $-173 ($-2k/yr) — negative.
- The deal already cash-flows at list — no discount required.
- To meet the 1% rule (rent ≥ 1% of price), the offer needs to be $81k (23.1% below list).
- Recommended offer: $81k (23.1% below list) — sets the bar for 1% rule.
Location & tenants
- Location reads 74/100 on livability (#17 in AZ, #4,502 nationally) — a middle-class / working-renter tenant base. Strengths: commute A+, cost of living A+, housing A+; Watch: health & safety C-, crime F, employment D-.
- Amphitheater Unified District (4406) (suburban): math 32% / reading 40% proficiency, ranked #85 of 249 in AZ (top 34%) — families likely to look elsewhere, expect single-tenant / working-renter base with shorter leases.
- Zoned schools: E C Nash School (math 8% / reading 17%, grade F, #944 of 1,109 statewide, top 87%, 296 students, 94% FRL); La Cima Middle School (math 12% / reading 19%, grade F, #155 of 218 statewide, top 71%, 421 students, 78% FRL); Amphitheater High School (math 8% / reading 12%, grade F, #343 of 381 statewide, top 93%, 1,163 students, 80% FRL) — zoned schools average 84% FRL vs 24% district-wide (60 pts higher); higher-poverty schools than district average — tighter screening recommended.
- Zoned-school proficiency averages 12% at this address vs 36% district-wide (-24 pts) — the specific schools serving this property underperform the Amphitheater Unified District (4406) average; the district grade overstates school quality for this exact location.
- Market conditions: Rents flat; 177 active listings in the ZIP; 40 comparable units currently listed for rent nearby; rentals at typical pace (median 24d on market — plan ~3-4 weeks tenant-placement turnaround); lower-income renter base — watch delinquency; 5,268 units permitted in Pima County in 2024 (996 in 5+ unit buildings).
Forward outlook
- Local home prices are declining (-3.0%/yr); year-one equity from $726 of loan paydown is wiped out by about $3k of value loss. Plan a longer hold.
- Pima County population projected at +8% by 2050 — modest demand growth; plan on rents tracking national, not racing it.
Negotiation context
- It's been on market 20 days — a 2% lower offer ($103k) is reasonable based on typical stale-listing flexibility.
- 4 sale attempts since 19y ago with the ask held roughly flat each time — persistent listings suggest the price (not the market) is what's stuck; bring a comps-based counter.
- Current owner paid $90k; 17% above their basis — modest negotiation headroom, anchor on the comps not their cost.
Risks & watch-outs
- Watch-outs: HOA is 23% of rent.
- Climate carrying-cost: extreme-heat days projected 6→14/yr by 2055 (HVAC capex compounding) — expect insurance premiums to compound above CPI over the hold.
Questions for the listing agent
- What do current leases actually rent for vs. the listed asking? Can we see a recent rent roll and the last 12 months of T-12 income?
- What does the HOA fee cover, when was the last increase, and are there any pending special assessments or reserve-fund shortfalls?
- Any open or pending special assessments — roof, HVAC, plumbing, elevator, façade? What's the per-unit balance and payoff schedule, and is the seller paying it off at close or rolling it to the buyer?
- Is there a deadline driving the sale (1031 exchange, divorce, estate, relocation)? That informs how much negotiation room exists.
- Schools are D-rated, which usually means shorter tenancies and higher turnover. Who's the typical renter profile here, and what's been the actual vacancy rate?
- Crime grade is F in this area — have there been break-ins, vandalism, or insurance claims at this property in the last 3 years? What carrier currently insures it and at what premium?
- The area grade is low — what's the realistic commute time and amenity access for the typical tenant pool here? Any planned neighborhood developments (good or bad) we should know about?
- What's the average days-on-market for RENTAL listings here right now (not sales)? A rising rental-DOM trend means longer vacancies and softer asking-rent achievability than the comps imply.
- What's the recent tenant-quality profile in this submarket — average credit score on applications, eviction rate, late-payment / NSF rate, and stable-employment percentage? A property-management company in the area should have these aggregated.
- How much new apartment / multifamily construction is in the pipeline within 1–3 miles? Heavy new supply (>2% of stock underway) typically softens rents 12–24 months out; light construction supports rent growth.
Investment metrics
- 1% rule
- 0.77% ✗
- Cap rate
- 4.32%
- Cash-on-cash
- -7.06%
- DSCR
- 0.69
- GRM
- 10.8
CMA / ARV
No comps found within radius.
Projected returns pro-forma
-3.0% appreciation · 0.3% rent growth · sell at horizon
- IRR
- -32.0%
- Equity multiple
- -0.02×
- Total profit
- $-30,107
- Equity at exit
- $15,656
- IRR
- -58.6%
- Equity multiple
- -0.65×
- Total profit
- $-48,453
- Equity at exit
- $9,078
Cash invested: $29,400 (down + closing). Projections, not guarantees.
Landlord ↔ Tenant lean methodology
- Overall (STATE)
- 87 Strongly Landlord-Friendly
- State Arizona
- 87 Strongly Landlord-Friendly · R+3
- County
- — inherits STATE
- City
- — inherits STATE
ZIP-level market 85705
- Rents YoY
- 0.3%
- Active inventory
- 177
- Price-to-rent
- 10.8×
Monthly cashflow live
- Estimated rent
- $808 high interval (Pro) →
- Mortgage (P&I)
- −$551
- Tax from tax record
- −$32 /mo · $383/yr
- Insurance
- −$44
- HOA est. from 6 same-building comps
- −$185
- Vacancy / Maint / Mgmt
- −$170
- Net cashflow
- $-173
Break-even live
UW: 25.0% down · 7.5% · 30yr · 1.5% tax · 5.0% vac · 8.0% maint · 8.0% mgmt
Financing live
Cash to close
- Down payment
- $26,250
- Closing costs
- $3,150
- Reserves months
- —
- Total cash needed
- —
Loan-product check · same deal, 3 products live
Conventional
25% down · 7.5% · 30yr
- Down + closing
- —
- Monthly P&I
- —
- Monthly cashflow
- —
- DSCR
- —
- Eligible?
- —
Personal DTI + credit; lowest rate.
DSCR
20% down · 8.5% · 30yr
- Down + closing
- —
- Monthly P&I
- —
- Monthly cashflow
- —
- DSCR
- —
- Eligible?
- —
No personal income docs; deal must DSCR.
Hard money
10% down · 12.0% · 12mo
- Down + closing
- —
- Monthly P&I
- —
- Monthly cashflow
- —
- DSCR
- —
- Eligible?
- —
Short-term bridge; refi at stabilization.
Rent comps 40 comps
| Address | Beds | Baths | Sqft | Rent | $/sqft | DOM | Units | Dist |
|---|---|---|---|---|---|---|---|---|
| 455 W Kelso St Tucson, AZ | 1.0–2.0 | 1.0 | 651 | $750 | $1.15 | 44d | 3 | 0.02mi |
| 2620 N 14th Ave Unit WI2620-5 Tucson, AZ | 1.0 | 1.0 | 360 | $695 | $1.93 | 23d | 1 | 0.04mi |
| 450 W Kelso St Tucson, AZ | 1.0 | 1.0 | 569 | $890 | $1.56 | 3d | 4 | 0.07mi |
| 297 W Kelso St Unit 12 Tucson, AZ | 1.0 | 1.0 | 610 | $695 | $1.14 | 43d | 1 | 0.24mi |
| 2740 N Balboa Ave Tucson, AZ | 1.0 | 1.0 | 600 | $745 | $1.24 | 2d | 9 | 0.26mi |
| 2460 N Balboa Ave Tucson, AZ | 2.0 | 2.0 | 600 | $795 | $1.32 | 23d | 1 | 0.32mi |
| 208 W Kelso St Unit Kelso 208-2 Tucson, AZ | 1.0 | 1.0 | 570 | $650 | $1.14 | 43d | 1 | 0.33mi |
| 201 W Kelso St Unit KEL211-12 Tucson, AZ | 1.0 | 1.0 | 650 | $725 | $1.12 | 43d | 1 | 0.33mi |
| 201 W Kelso St Unit KEL201-5 Tucson, AZ | — | 1.0 | 550 | $650 | $1.18 | 3d | 1 | 0.33mi |
| 204 W Kelso St Unit 4 Tucson, AZ | 1.0 | 1.0 | 570 | $825 | $1.45 | 43d | 1 | 0.34mi |
| 510 W Sahuaro St Unit 1105 Tucson, AZ | — | 1.0 | 360 | $695 | $1.93 | 23d | 1 | 0.37mi |
| 510 W Sahuaro St Unit 1106 Tucson, AZ | — | 1.0 | 360 | $695 | $1.93 | 43d | 1 | 0.37mi |
| 240 W Sahuaro St Unit 16 Tucson, AZ | 1.0 | 1.0 | 450 | $800 | $1.78 | 1d | 1 | 0.44mi |
| 121 W Alturas St Unit C Tucson, AZ | 1.0 | 1.0 | 550 | $699 | $1.27 | 23d | 1 | 0.45mi |
| 522 W Rillito St Unit 11 Tucson, AZ | 1.0 | 1.0 | 400 | $750 | $1.88 | 43d | 1 | 0.46mi |
| 2620 N Stone Ave Unit 2 Tucson, AZ | 1.0 | 1.0 | 506 | $725 | $1.43 | 23d | 1 | 0.49mi |
| 2620 N Stone Ave Unit TB2620-2 Tucson, AZ | 1.0 | 1.0 | 506 | $749 | $1.48 | 43d | 1 | 0.49mi |
| 2632 N Stone Ave Unit 2 Tucson, AZ | 1.0 | 1.0 | 600 | $930 | $1.55 | 23d | 1 | 0.49mi |
| 2632 N Stone Ave Unit 4 Tucson, AZ | 1.0 | 1.0 | 450 | $800 | $1.78 | 43d | 1 | 0.49mi |
| 114 W Laguna St Unit 114-28 Tucson, AZ | — | 1.0 | 400 | $680 | $1.70 | 20d | 1 | 0.51mi |
| 114 W Laguna St Unit 114-38 Tucson, AZ | 2.0 | 1.0 | 650 | $950 | $1.46 | 43d | 1 | 0.51mi |
| 114 W Laguna St Unit 114-01 Tucson, AZ | 2.0 | 1.0 | 615 | $950 | $1.54 | 14d | 1 | 0.51mi |
| 201 W Blacklidge Dr Tucson, AZ | 1.0 | 1.0 | 520 | $949 | $1.82 | 23d | 1 | 0.52mi |
| 504 W Flores St Unit CDR04 Tucson, AZ | — | 1.0 | 450 | $695 | $1.54 | 23d | 1 | 0.53mi |
| 504 W Flores St Unit CDR11 Tucson, AZ | 2.0 | 1.0 | 711 | $925 | $1.30 | 23d | 1 | 0.53mi |
| 210 W Blacklidge Dr Unit 1 Tucson, AZ | 2.0 | 1.0 | 600 | $1,075 | $1.79 | 3d | 1 | 0.54mi |
| 212 W Blacklidge Dr Tucson, AZ | 1.0 | 1.0 | 600 | $950 | $1.58 | 21d | 1 | 0.54mi |
| 26 E Glenn St Tucson, AZ | 2.0 | 1.0 | 650 | $1,095 | $1.68 | 23d | 1 | 0.55mi |
| 302 W Flores St Unit 3 Tucson, AZ | 1.0 | 1.0 | 550 | $619 | $1.13 | 23d | 1 | 0.56mi |
| 3066 N Balboa Ave Tucson, AZ | 1.0 | 1.0 | 550 | $844 | $1.53 | 23d | 2 | 0.58mi |
| 124 E Jacinto St Unit 3 Tucson, AZ | 1.0 | 1.0 | 600 | $799 | $1.33 | 23d | 1 | 0.58mi |
| 3028 N Castro Ave Unit 12 Tucson, AZ | 1.0 | 1.0 | 575 | $699 | $1.22 | 43d | 1 | 0.60mi |
| 3028 N Castro Ave Unit 16 Tucson, AZ | 1.0 | 1.0 | 575 | $649 | $1.13 | 23d | 1 | 0.60mi |
| 255 W Flores St Tucson, AZ | — | 1.0 | 400 | $900 | $2.25 | 23d | 1 | 0.61mi |
| 10 W Rillito St Unit VE10-2 Tucson, AZ | 1.0 | 1.0 | 470 | $750 | $1.60 | 3d | 1 | 0.63mi |
| 143 W Flores St Tucson, AZ | 1.0 | 1.0 | 690 | $1,200 | $1.74 | 43d | 1 | 0.64mi |
| 2959 N Estrella Ave Tucson, AZ | 1.0 | 1.0 | 440 | $800 | $1.82 | 43d | 1 | 0.68mi |
| 114 E Blacklidge Dr Tucson, AZ | 1.0 | 1.0 | 710 | $650 | $0.92 | 43d | 1 | 0.69mi |
| 219 W Fort Lowell Rd Tucson, AZ | 1.0 | 1.0 | 476 | $850 | $1.79 | 43d | 2 | 0.70mi |
| 2631 N Fontana Ave Unit 2 Tucson, AZ | 1.0 | 1.0 | 504 | $775 | $1.54 | 2d | 1 | 0.71mi |
HOA detail condo
- Monthly dues
- $0 · $0/yr
- Likely covers
- watertrashlandscapingpoolsecurityparking
- Assessments
- None detected in remarks — confirm with the listing agent.
Listing history 14 events
-
2026-06-18days on market $105,000 Active 20 DOM
-
2026-06-17days on market $105,000 Active 19 DOM
-
2026-06-16days on market $105,000 Active 18 DOM
-
2026-06-15days on market $105,000 Active 17 DOM
-
2026-06-13days on market $105,000 Active 15 DOM
-
2026-06-10days on market $105,000 Active 12 DOM
-
2026-06-09days on market $105,000 Active 11 DOM
-
2026-06-08days on market $105,000 Active 10 DOM
-
2026-06-07days on market $105,000 Active 9 DOM
-
2026-06-05days on market $105,000 Active 6 DOM
-
2026-06-03days on market $105,000 Active 5 DOM
-
2026-06-02days on market $105,000 Active 4 DOM
-
2026-06-01days on market $105,000 Active 3 DOM
-
2026-05-31days on market $105,000 Active 2 DOM
ⓘ Source: listings_history table (triggers on properties + properties_extension) + one-shot
backfill from property_details.listing_events for pre-trigger history.
Tax reassessment forecast AZ · Resets to sale price
- Current annual tax
- $383 · $32/mo
- Projected year-2 tax
- $693 · $58/mo
- Expected delta
- +$310/yr (+$26/mo · 80.8%)
ⓘ Screening estimate from a state-policy table — verify with the county assessor before closing.
Climate risk First Street
- Flood 1/10 Low FEMA zone X (unshaded) · 0% chance over 30 yrs
- Wildfire 2/10 Low
- Heat 8/10 Severe 6 d/yr ≥107°F today · 14 d/yr by 30 yrs out
- Wind 1/10 Low
- Air quality 1/10 Low 0 unhealthy d/yr today · 0 by 30 yrs out
Nearby sold comps map
Loading sold comps map…
Walkable amenities ~0.75 mi
Loading nearby amenities…
Taxation est. · year 1
- Rental income
- $9,696
- − Mortgage interest
- −$5,882
- − Property taxes
- −$383
- − Insurance
- −$525
- − Repairs & maintenance
- −$776
- − Management
- −$776
- − HOA
- −$2,220
- − Depreciation
- −$3,055
- Taxable loss
- −$3,920
- Est. tax savings @ 24.0%
- +$941
- After-tax cash flow
- $-1,136/yr
For passive investors: Depreciation is non-cash, so a rental often shows a tax loss while cash-flowing — sheltering income. Rental losses are passive: they offset passive income freely, and up to $25,000/yr can offset ordinary (W-2) income if you actively participate and your MAGI is under $100k (phasing out to $0 by $150k); unused losses carry forward. On sale, claimed depreciation is recaptured at up to 25%, and gains may owe capital-gains tax (a 1031 exchange can defer both). Figures are a year-1 estimate at your 24.0% rate — not tax advice; consult a CPA.
Schools (NCES district)
- District
- Amphitheater Unified District (4406)
- NCES district ID
- 0400680
- Math proficiency
- 32% ▼ -13.00%
- Reading proficiency
- 40% ▼ -8.00%
- Median HH income
- $46,524
- Composite
- 30.82/100
- National rank
- #6135
- State rank
- #85 of 249 in AZ
Livability — Tucson
- Score
- 74/100
- State rank
- #17
- US rank
- #4502
Category grades
Schools grade is shown separately in the Schools card above.
Census & demographics
- Census place
- Tucson, AZ
- County
- Pima County · 1,012,107 people
- City population
- 839,336
- Metro
- Tucson, AZ
- Population (ZIP)
- 54,700
- Household income
- $37,194
- Rent vs Own
- Severe rent burden
- 4240.0
Population outlook (Pima County) Hauer SSP2
- Today (2025)
- 1,066,056 people
- By 2030
- 1,086,684 · +1.9%
- By 2040
- 1,117,160 · +4.8%
- By 2050
- 1,149,778 · +7.9%
- By 2075
- 1,271,480 · +19.3%
- By 2100
- 1,321,160 · +23.9%
Race, ethnicity, and origin ACS 2023
- Neighborhood character
- Diverse neighborhood (Simpson 0.63)
- Race & ethnicity
- Hispanic / Latino 45% White 41% Two or more races 18% Asian 4% Black 3% Native American 3%
- Hispanic origin (detail)
- Mexican 41%
- Common ancestry
- Portuguese 2% Romanian 2% Lithuanian 2%
- Foreign-born
- 18% · Canada, China, Vietnam
- Languages at home
- 65% English-only · Spanish 30% Chinese 1% Vietnamese 1%
Political lean MEDSL · Pima
- 2024 margin
- D (+15.2) · D 57.0% · R 41.8% · Other 1.2%
- 2008→2024 swing
- +9.1pp toward D · 2008: 6.1pp · 2024: 15.2pp
- All cycles
- 2024: D+15.2 2020: D+18.7 2016: D+13.5 2012: D+5.8 2008: D+6.1
Not yet ingested
- Civics
- —
Market trends
- HPI YoY
- ▼ -163.31%
- Current HPI
- 283.0647
- Rent YoY
- ▲ 0.30%
- Metro
- Tucson, AZ
- State GDP YoY
- ▲ 4.54%
- F500 in state
- 20
Industry mix (Fortune 500 HQ in AZ)
| Industry | F500 HQs | Revenue |
|---|---|---|
| Technology | 2 | $13B |
|
||
| Mining / Metals | 1 | $23B |
|
||
| Environmental Services | 1 | $16B |
|
||
| Metals / Steel | 1 | $14B |
|
||
| Technology Distribution | 1 | $9B |
|
||
| Homebuilding | 1 | $8B |
|
||
Price history
+52.2% since first listed13 events — show timeline
- 2026-05-29 Listed $105,000 MLSSAZ
- 2022-10-19 Sold (Public Records) $90,000 Public Records
- 2022-10-19 Sold (MLS) $90,000 MLSSAZ
- 2022-10-17 Pending — MLSSAZ
- 2022-10-11 Contingent — MLSSAZ
- 2022-09-30 Listed $94,900 MLSSAZ
- 2020-07-24 Sold (Public Records) $57,550 Public Records
- 2020-07-24 Sold (MLS) $57,550 MLSSAZ
- 2020-07-10 Contingent — MLSSAZ
- 2020-06-23 Listed $59,900 MLSSAZ
- 2008-02-12 Listing Removed — MLSSAZ
- 2007-09-28 Listed $76,000 MLSSAZ
- 2005-09-08 Sold (Public Records) $69,000 Public Records
Property tax history
+3.5%/yrLatest (2025): $383 · +3.8% YoY. Source: county tax records.
Cash-flow waterfall
monthlySold comps — $/sqft
last 12 mo · ≤1 miLoading sold comps…