352 Rose Dr · Alexandria, KY
Flood risk 1/10 · Minimal
- FEMA flood zone
- X (unshaded)
- Chance of flooding over 30 yrs
- 0.0%
- Est. flood insurance / yr
- $507 – $1,088
Fire risk 1/10 · Minimal
- Est. fire insurance / yr
- $839 – $1,559
Heat risk 4/10 · Minor
- Hot days now (above 103°F)
- 7 days/yr
- Hot days in 30 yrs
- 18 days/yr
Wind risk 2/10 · Minimal
- Chance of severe wind over 30 yrs
- 1.0%
Air-quality risk 3/10 · Minor
- Unhealthy air days now
- 2 days/yr
- Unhealthy air days in 30 yrs
- 3 days/yr
Risk factors via First Street. Map © Google.
Why this score? — see what drove the C+ grade
The composite is a weighted blend of 9 inputs, each scored 0–100. Each bar is that input's sub-score; the figure is the points it added to the 100-point composite (weight × sub-score).
- Cash flow +22.5/30.0
- ARV discount +15.0/15.0
- DSCR +7.2/10.0
- 1% rule +6.1/10.0
- Livability +4.2/5.0
- Schools +4.0/10.0
- Rent growth +2.5/5.0
- Condition / age +2.5/5.0
- Appreciation +0.0/10.0
$155,000
🖨 Deal sheet (PDF) 📄 Offer letter ✓ Due diligence
Listing remarks
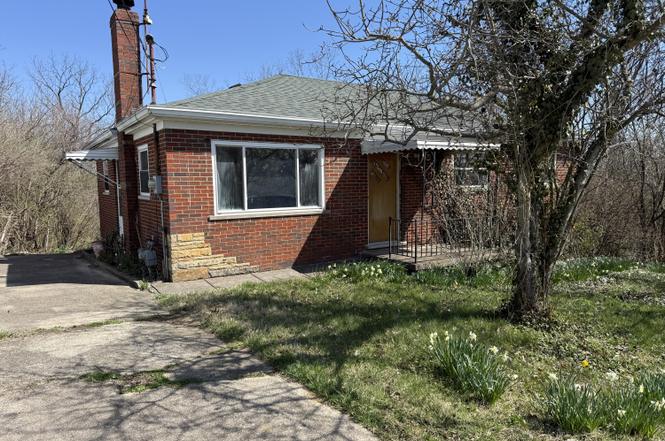
Brick ranch on 0.77 acre lot in Alexandria ready for renovations. This 3 bedroom, 1 bath home offers approx 1,092 sq ft with original hardwood floors, eat-in kitchen, and full basement. Built in 1960 with public water, sewer, and natural gas. Large, double lot with room to expand, add an outbuilding, or create an outdoor living space. In an established neighborhood. Ideal for investors, rehab buyers, or owners looking to remodel and build equity. This property is being sold for Arthur Boss by The Ky Cabinet for Health and Family Services, his legal guardian. All agreed offers must be approved by a campbell county judge. The approval process takes 60-120 days.
Key facts
- Double lot
- Full basement
- Eat-in kitchen
Tags
Property features AI
Exterior
- Parking: Driveway parking; Off-street parking
- Utilities: Public water; Public sewer
- Home design: Single-family residence; One story
- Construction: Brick construction; Poured concrete foundation; Built in 1690
- Exterior features: Vinyl frame windows; Shingle roof; Lot dimensions approximately 131 x 219 x 86 x 90 x 208; Approximately 0.77 acre lot
Interior
- Kitchen: Kitchen
- Bedrooms: Primary bedroom; Bedroom 2; Bedroom 3
- Bathrooms: 1 full bathroom
- Heating & cooling: Electric heating; Central air conditioning
- Interior features: Full basement
Neighborhood map
What this means for you Summary
Snapshot
- This is a 3-bed/2.0-bath single-family listed at $155k.
Deal economics
- At list price, monthly cash flow is $261 ($3k/yr) — positive.
- The deal already cash-flows at list — no discount required.
- Meets the 1% rule at list price ($2k rent vs $155k).
- Recommended offer: $146k (6.0% below list) — sets the bar for market timing.
- Cap rate 8.3% vs local median 2.6% in Alexandria — top-decile yield for the area; either an underpriced asset or a hidden risk that comps aren't pricing in. Stress-test before assuming the spread holds.
Location & tenants
- Location reads 84/100 on livability (#51 in KY, #644 nationally) — a professional / high-income tenant draw. Strengths: crime A+, employment A+, cost of living A+; Watch: amenities F, health & safety F.
- Campbell County (suburban): math 43% / reading 47% proficiency, ranked #15 of 165 in KY (top 9%) — families likely to look elsewhere, expect single-tenant / working-renter base with shorter leases.
- Zoned schools: Crossroads Elementary School (math 39% / reading 37%, grade F, #242 of 676 statewide, top 37%, 613 students, 58% FRL); Campbell County Middle School (math 37% / reading 45%, grade F, #54 of 217 statewide, top 25%, 1,184 students, 45% FRL); Campbell County High School (math 35% / reading 43%, grade F, #51 of 254 statewide, top 21%, 1,551 students, 41% FRL).
- Market conditions: 171 active listings in the ZIP; 1 comparable units currently listed for rent nearby; solid renter incomes; 247 units permitted in Campbell County in 2024 (77 in 5+ unit buildings).
Forward outlook
- Local home prices are declining (-3.0%/yr); year-one equity from $1k of loan paydown is wiped out by about $5k of value loss. Plan a longer hold.
Negotiation context
- It's been on market 83 days — a 6% lower offer ($146k) is reasonable based on typical stale-listing flexibility.
Questions for the listing agent
- It's been on market 83 days. Have you received any prior offers? Is the seller open to a 6% concession, seller financing, or rate buy-down credit?
- Built in 1960 — when were the roof, HVAC, electrical panel, plumbing, and water heater last replaced?
- Why hasn't it sold? Are there any deal-killer items the seller is aware of (foundation, flood, title, zoning, code violations)?
- Is there a deadline driving the sale (1031 exchange, divorce, estate, relocation)? That informs how much negotiation room exists.
- Schools are A-rated — typically a magnet for longer-tenancy family renters. What's the average tenant stay here, and is there a school-zone premium baked into asking?
- What's the average days-on-market for RENTAL listings here right now (not sales)? A rising rental-DOM trend means longer vacancies and softer asking-rent achievability than the comps imply.
- What's the recent tenant-quality profile in this submarket — average credit score on applications, eviction rate, late-payment / NSF rate, and stable-employment percentage? A property-management company in the area should have these aggregated.
- How much new for-sale + rental construction is in the pipeline within 1–3 miles? Heavy new supply typically softens prices + rents 12–24 months out; constrained supply supports both.
Investment metrics
- 1% rule
- 1.11% ✓
- Cap rate
- 8.31%
- Cash-on-cash
- 7.22%
- DSCR
- 1.32
- GRM
- 7.5
CMA / ARV
- ARV (on-the-fly)
- $251,160
- Comps found
- 5
Show comp detail 5 sales within ~0.75 mi
| Address | Dist | Beds/Ba | Sqft | Sold | Price | $/sf | Match |
|---|---|---|---|---|---|---|---|
| 408 Brookwood Dr | 0.44mi | 3/2.5 | 1,130 (+4%) | 14mo | $260,000 | $230 | 60 |
| 20 Elmwood Cir | 0.42mi | 3/1.5 | 936 (-14%) | 4mo | $195,000 | $208 | 52 |
| 23 Elmwood Ct | 0.47mi | 3/1.5 | 936 (-14%) | 3mo | $240,000 | $256 | 50 |
| 365 Aaron Dr | 0.23mi | 3/3.0 | 1,229 (+12%) | 21mo | $279,000 | $227 | 47 |
| 10 Valleyview Cir | 0.40mi | 3/2.0 | 936 (-14%) | 15mo | $261,500 | $279 | 45 |
Match score weights: distance 35% · size 25% · config 20% · recency 20%. Top-matched comps best support the ARV.
Projected returns pro-forma
-3.0% appreciation · 3.0% rent growth · sell at horizon
- IRR
- -5.2%
- Equity multiple
- 0.81×
- Total profit
- $-8,441
- Equity at exit
- $23,111
- IRR
- 4.5%
- Equity multiple
- 1.33×
- Total profit
- $14,238
- Equity at exit
- $13,402
Cash invested: $43,400 (down + closing). Projections, not guarantees.
Landlord ↔ Tenant lean methodology
- Overall (STATE)
- 83 Strongly Landlord-Friendly
- State Kentucky
- 83 Strongly Landlord-Friendly · R+16
- County
- — inherits STATE
- City
- — inherits STATE
ZIP-level market 41001
- Active inventory
- 171
- Price-to-rent
- 7.5×
Monthly cashflow live
- Estimated rent
- $1,718 medium interval (Pro) →
- Mortgage (P&I)
- −$813
- Tax from tax record
- −$219 /mo · $2,626/yr
- Insurance
- −$65
- HOA
- −$0
- Vacancy / Maint / Mgmt
- −$361
- Net cashflow
- $261
Break-even live
Sensitivity live
| Price | -10% $349 | -5% $305 | +0% $261 | +5% $217 | +10% $173 |
|---|---|---|---|---|---|
| Rent | -10% $125 | -5% $193 | +0% $261 | +5% $329 | +10% $397 |
| Rate | -1.0pp $339 | -0.5pp $301 | base $261 | +0.5pp $221 | +1.0pp $180 |
UW: 25.0% down · 7.5% · 30yr · 1.5% tax · 5.0% vac · 8.0% maint · 8.0% mgmt
Financing live
Cash to close
- Down payment
- $38,750
- Closing costs
- $4,650
- Reserves months
- —
- Total cash needed
- —
Loan-product check · same deal, 3 products live
Conventional
25% down · 7.5% · 30yr
- Down + closing
- —
- Monthly P&I
- —
- Monthly cashflow
- —
- DSCR
- —
- Eligible?
- —
Personal DTI + credit; lowest rate.
DSCR
20% down · 8.5% · 30yr
- Down + closing
- —
- Monthly P&I
- —
- Monthly cashflow
- —
- DSCR
- —
- Eligible?
- —
No personal income docs; deal must DSCR.
Hard money
10% down · 12.0% · 12mo
- Down + closing
- —
- Monthly P&I
- —
- Monthly cashflow
- —
- DSCR
- —
- Eligible?
- —
Short-term bridge; refi at stabilization.
Rent comps 1 comps
| Address | Beds | Baths | Sqft | Rent | $/sqft | DOM | Units | Dist |
|---|---|---|---|---|---|---|---|---|
| 2 Willow St Unit 8 Alexandria, KY | 2.0 | 1.0 | 799 | $1,290 | $1.61 | 24d | 1 | 1.38mi |
Listing history 3 events
-
2026-04-29status Pending
-
2026-04-17price $155,000
-
2026-02-05$181,500 Active
ⓘ Source: listings_history table (triggers on properties + properties_extension) + one-shot
backfill from property_details.listing_events for pre-trigger history.
Tax reassessment forecast KY · Resets to sale price
- Current annual tax
- $2,626 · $219/mo
- Projected year-2 tax
- $2,626 · $219/mo
- Expected delta
- $0/yr ($0/mo · 0.0%)
ⓘ Screening estimate from a state-policy table — verify with the county assessor before closing.
Climate risk First Street
- Flood 1/10 Low FEMA zone X (unshaded) · 0% chance over 30 yrs
- Wildfire 1/10 Low
- Heat 4/10 Moderate 7 d/yr ≥103°F today · 18 d/yr by 30 yrs out
- Wind 2/10 Low 100% chance of damaging wind over 30 yrs
- Air quality 3/10 Moderate 2 unhealthy d/yr today · 3 by 30 yrs out
Nearby sold comps map
Loading sold comps map…
Walkable amenities ~0.75 mi
Loading nearby amenities…
Taxation est. · year 1
- Rental income
- $20,619
- − Mortgage interest
- −$8,682
- − Property taxes
- −$2,626
- − Insurance
- −$775
- − Repairs & maintenance
- −$1,650
- − Management
- −$1,650
- − Depreciation
- −$4,509
- Taxable income
- $728
- Est. tax owed @ 24.0%
- −$175
- After-tax cash flow
- $2,960/yr
For passive investors: Depreciation is non-cash, so a rental often shows a tax loss while cash-flowing — sheltering income. Rental losses are passive: they offset passive income freely, and up to $25,000/yr can offset ordinary (W-2) income if you actively participate and your MAGI is under $100k (phasing out to $0 by $150k); unused losses carry forward. On sale, claimed depreciation is recaptured at up to 25%, and gains may owe capital-gains tax (a 1031 exchange can defer both). Figures are a year-1 estimate at your 24.0% rate — not tax advice; consult a CPA.
Schools (NCES district)
- District
- Campbell County
- NCES district ID
- 2100900
- Math proficiency
- 43% ▼ -11.00%
- Reading proficiency
- 47% ▼ -14.00%
- Median HH income
- $62,891
- Composite
- 39.86/100
- National rank
- #3864
- State rank
- #15 of 165 in KY
Livability — Alexandria
- Score
- 84/100
- State rank
- #51
- US rank
- #644
Category grades
Schools grade is shown separately in the Schools card above.
Census & demographics
- Census place
- Alexandria, KY
- County
- Campbell County · 84,793 people
- City population
- 19,323
- Metro
- Cincinnati, OH-KY-IN
- Population (ZIP)
- 19,323
- Household income
- $102,447
- Rent vs Own
- Severe rent burden
- 129.0
Population outlook (Campbell County) Hauer SSP2
- Today (2025)
- 95,668 people
- By 2030
- 96,886 · +1.3%
- By 2040
- 97,734 · +2.2%
- By 2050
- 96,413 · +0.8%
- By 2075
- 90,211 · -5.7%
- By 2100
- 79,434 · -17.0%
Race, ethnicity, and origin ACS 2023
- Neighborhood character
- Predominantly White (93%)
- Race & ethnicity
- White 93% Two or more races 3% Hispanic / Latino 2% Asian 2% Black 1%
- Common ancestry
- Slovak 4% Lithuanian 2% Italian 2%
- Foreign-born
- 2%
- Languages at home
- 97% English-only · Other Indo-European 1% Other Asian/Pacific 1% Spanish 0%
Political lean MEDSL · Campbell
- 2024 margin
- R (+19.7) · D 39.2% · R 58.9% · Other 1.9%
- 2008→2024 swing
- +1.2pp toward D · 2008: -20.9pp · 2024: -19.7pp
- All cycles
- 2024: R+19.7 2020: R+18.6 2016: R+24.5 2012: R+22.8 2008: R+20.9
Not yet ingested
- Civics
- —
Market trends
- HPI YoY
- ▼ -120.32%
- Current HPI
- 189.7464
- Rent YoY
- —
- Metro
- Cincinnati, OH-KY-IN
- State GDP YoY
- ▲ 1.81%
- F500 in state
- 4
Industry mix (Fortune 500 HQ in KY)
| Industry | F500 HQs | Revenue |
|---|---|---|
| Healthcare | 1 | $118B |
|
||
| Food / Beverage | 1 | $7B |
|
||
Price history
-14.6% since first listed3 events — show timeline
- 2026-04-29 Pending — NKMLS
- 2026-04-17 Price Changed $155,000 NKMLS
- 2026-02-05 Listed $181,500 NKMLS
Property tax history
+7.9%/yrLatest (2025): $2,626 · -1.3% YoY. Source: county tax records.
Cash-flow waterfall
monthlySold comps — $/sqft
last 12 mo · ≤1 miLoading sold comps…