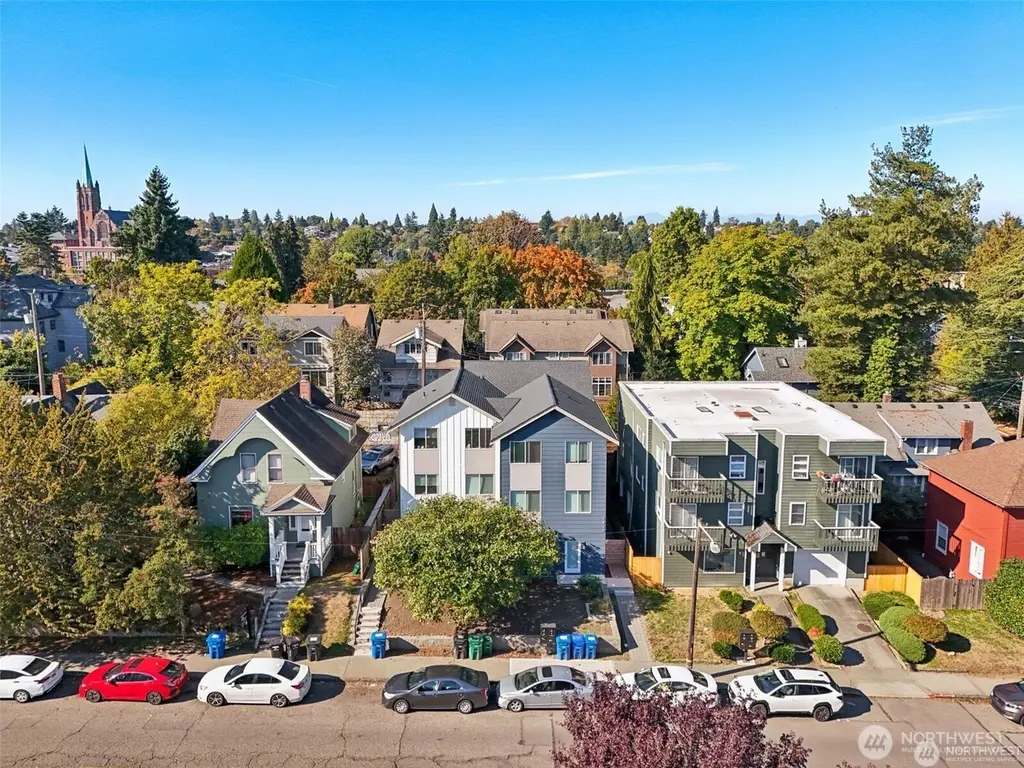
5255 Brooklyn Ave NE · Seattle, WA
Flood risk 1/10 · Minimal
- FEMA flood zone
- X (unshaded)
- Chance of flooding over 30 yrs
- 0.0%
- Est. flood insurance / yr
- $507 – $1,088
Fire risk 1/10 · Minimal
- Est. fire insurance / yr
- $604 – $1,122
Heat risk 3/10 · Minor
- Hot days now (above 86°F)
- 7 days/yr
- Hot days in 30 yrs
- 15 days/yr
Wind risk 1/10 · Minimal
- Chance of severe wind over 30 yrs
- —
Air-quality risk 7/10 · Major
- Unhealthy air days now
- 10 days/yr
- Unhealthy air days in 30 yrs
- 11 days/yr
Risk factors via First Street. Map © Google.
Why this score? — see what drove the D+ grade
The composite is a weighted blend of 9 inputs, each scored 0–100. Each bar is that input's sub-score; the figure is the points it added to the 100-point composite (weight × sub-score).
- Cash flow +12.5/30.0
- ARV discount +7.5/15.0
- Schools +6.1/10.0
- Appreciation +5.0/10.0
- Livability +3.8/5.0
- DSCR +3.7/10.0
- 1% rule +3.6/10.0
- Rent growth +2.5/5.0
- Condition / age +2.5/5.0
$899,900
🖨 Deal sheet 📄 Offer letter ✓ Due diligence
Listing remarks
8-bedroom, 3-bath UW townhouse near campus, surrounded by coffee shops, restaurants, and close to the light rail station and multiple bus stops, with a Walk Score of 98. The main floor features a modern kitchen with stainless steel appliances, ample cabinetry, and a pantry that opens to the living area, plus durable LVP flooring, a dedicated study room, an additional refrigerator, a washer/dryer, and a bathroom. Upstairs, two levels each offer 4 bedrooms and 1 bathroom. Located in one of Seattle’s most sought-after rental markets, this property presents a rare opportunity to own a high-demand investment near UW.
Key facts
- Dedicated study room
- Ample cabinetry
- Modern kitchen
Tags
Neighborhood map
What this means for you Summary
Snapshot
- This is a 8-bed/3.0-bath townhouse listed at $900k.
Deal economics
- At list price, monthly cash flow is $-133 ($-2k/yr) — negative.
- To cash-flow at today's rent, offer at most $881k (2.1% below list).
- To meet the 1% rule (rent ≥ 1% of price), the offer needs to be $770k (14.4% below list).
- Recommended offer: $770k (14.4% below list) — sets the bar for 1% rule.
- Cap rate 6.1% vs local median 1.6% in Seattle — top-decile yield for the area; either an underpriced asset or a hidden risk that comps aren't pricing in. Stress-test before assuming the spread holds.
Location & tenants
- Location reads 75/100 on livability (#166 in WA, #4,033 nationally) — a middle-class / working-renter tenant base. Strengths: amenities A+, commute A+, employment A+; Watch: crime F, cost of living F.
- Seattle Public Schools (urban): math 64% / reading 72% proficiency, ranked #19 of 291 in WA (top 6%) — acceptable for families but not a draw, mixed tenant base, ~2y average lease.
- Market conditions: 2 active listings in the ZIP; 4 comparable units currently listed for rent nearby; rentals leasing fast (median 3d on market — plan ~1-2 weeks tenant-placement turnaround); 10,555 units permitted in King County in 2024 (7,119 in 5+ unit buildings).
Forward outlook
- In year one you build about $33k of equity ($6k loan paydown + $27k appreciation (3.0% local appreciation)).
- King County population projected at +44% by 2050 — long-run rental-demand tailwind backs the buy-and-hold thesis.
- By year 2, paydown + projected appreciation supports a ~$54k cash-out refi (75% LTV) — recoverable capital for the next deal without selling this one.
Negotiation context
- It's been on market 30 days — a 2% lower offer ($886k) is reasonable based on typical stale-listing flexibility.
- 3 sale attempts; this cycle's ask is 14911% above the opening price — seller raised mid-cycle; expect resistance to lowballs.
Questions for the listing agent
- What do current leases actually rent for vs. the listed asking? Can we see a recent rent roll and the last 12 months of T-12 income?
- Is there a deadline driving the sale (1031 exchange, divorce, estate, relocation)? That informs how much negotiation room exists.
- Schools are A-rated — typically a magnet for longer-tenancy family renters. What's the average tenant stay here, and is there a school-zone premium baked into asking?
- Crime grade is F in this area — have there been break-ins, vandalism, or insurance claims at this property in the last 3 years? What carrier currently insures it and at what premium?
- The area grade is low — what's the realistic commute time and amenity access for the typical tenant pool here? Any planned neighborhood developments (good or bad) we should know about?
- What's the average days-on-market for RENTAL listings here right now (not sales)? A rising rental-DOM trend means longer vacancies and softer asking-rent achievability than the comps imply.
- What's the recent tenant-quality profile in this submarket — average credit score on applications, eviction rate, late-payment / NSF rate, and stable-employment percentage? A property-management company in the area should have these aggregated.
- How much new for-sale + rental construction is in the pipeline within 1–3 miles? Heavy new supply typically softens prices + rents 12–24 months out; constrained supply supports both.
Investment metrics
- 1% rule
- 0.86% ✗
- Cap rate
- 6.12%
- Cash-on-cash
- -0.63%
- DSCR
- 0.97
- GRM
- 9.7
CMA / ARV
- ARV (median comp)
- $900,000
- List price
- $899,900
- Delta
- 11.10%
- Verdict
- OVERPRICED
- Comps
- 5 within 1.0 mi
Show comp detail 5 sales within ~0.75 mi
| Address | Dist | Beds/Ba | Sqft | Sold | Price | $/sf | Match |
|---|---|---|---|---|---|---|---|
| 5203 B Ravenna Ave NE | 0.51mi | 8/3.0 | 1,680 (+8%) | 12mo | $1,276,000 | $760 | 54 |
| 5201 B Ravenna Ave NE | 0.52mi | 8/3.0 | 1,680 (+8%) | 12mo | $1,276,000 | $760 | 53 |
| 5203 A Ravenna Ave NE | 0.51mi | 8/3.0 | 1,680 (+8%) | 15mo | $1,272,000 | $757 | 51 |
| 5201 A Ravenna Ave NE | 0.52mi | 8/3.0 | 1,680 (+8%) | 16mo | $1,272,000 | $757 | 50 |
| 4709 A 8th Ave NE | 0.41mi | 8/2.5 | 1,760 (+13%) | 11mo | $1,046,000 | $594 | 48 |
Match score weights: distance 35% · size 25% · config 20% · recency 20%. Top-matched comps best support the ARV.
Projected returns pro-forma
3.0% appreciation · 3.0% rent growth · sell at horizon
- IRR
- 6.9%
- Equity multiple
- 1.40×
- Total profit
- $100,080
- Equity at exit
- $404,634
- IRR
- 9.7%
- Equity multiple
- 2.46×
- Total profit
- $368,408
- Equity at exit
- $623,589
Cash invested: $251,972 (down + closing). Projections, not guarantees.
Landlord ↔ Tenant lean methodology
- Overall (CITY)
- 0 Strongly Tenant-Friendly
- State Washington
- 28 Tenant-Leaning · D+8
- County
- — inherits STATE
- City Seattle
- 0 Strongly Tenant-Friendly · D+52
ZIP-level market 98015
- Active inventory
- 2
- Price-to-rent
- 9.7×
Monthly cashflow live
- Estimated rent
- $7,704 medium interval (Pro) →
- Mortgage (P&I)
- −$4,719
- Tax est. 1.5%
- −$1,125 /mo · $13,498/yr
- Insurance
- −$375
- HOA
- −$0
- Vacancy / Maint / Mgmt
- −$1,618
- Net cashflow
- $-133
Break-even live
UW: 25.0% down · 7.5% · 30yr · 1.5% tax · 5.0% vac · 8.0% maint · 8.0% mgmt
Financing live
Cash to close
- Down payment
- $224,975
- Closing costs
- $26,997
- Reserves months
- —
- Total cash needed
- —
Loan-product check · same deal, 3 products live
Conventional
25% down · 7.5% · 30yr
- Down + closing
- —
- Monthly P&I
- —
- Monthly cashflow
- —
- DSCR
- —
- Eligible?
- —
Personal DTI + credit; lowest rate.
DSCR
20% down · 8.5% · 30yr
- Down + closing
- —
- Monthly P&I
- —
- Monthly cashflow
- —
- DSCR
- —
- Eligible?
- —
No personal income docs; deal must DSCR.
Hard money
10% down · 12.0% · 12mo
- Down + closing
- —
- Monthly P&I
- —
- Monthly cashflow
- —
- DSCR
- —
- Eligible?
- —
Short-term bridge; refi at stabilization.
Rent comps 4 comps
| Address | Beds | Baths | Sqft | Rent | $/sqft | DOM | Units | Dist |
|---|---|---|---|---|---|---|---|---|
| 5224 Brooklyn Ave NE Unit B Seattle, WA | 8.0 | 3.0 | 1610 | $850 | $0.53 | 2d | 1 | 0.06mi |
| 5015 17th Ave NE Seattle, WA | 3.0–12.0 | 1.0–6.0 | 2750 | $7,150 | $2.60 | 1d | 2 | 0.26mi |
| 4709 8th Ave NE Unit A Seattle, WA | 8.0 | 2.5 | 1900 | $825 | $0.43 | 1d | 1 | 0.42mi |
| 4729 21st Ave NE Seattle, WA | 8.0 | 4.0 | 2170 | $8,500 | $3.92 | 2d | 1 | 0.48mi |
Listing history 21 events
-
2026-06-19days on market $899,900 Active 30 DOM
-
2026-06-18days on market $899,900 Active 29 DOM
-
2026-06-17days on market $899,900 Active 28 DOM
-
2026-06-16days on market $899,900 Active 27 DOM
-
2026-06-15days on market $899,900 Active 26 DOM
-
2026-06-15days on market $899,900 Active 25 DOM
-
2026-06-13days on market $899,900 Active 24 DOM
-
2026-06-12days on market $899,900 Active 23 DOM
-
2026-06-10days on market $899,900 Active 21 DOM
-
2026-06-09days on market $899,900 Active 20 DOM
-
2026-06-08days on market $899,900 Active 19 DOM
-
2026-06-07days on market $899,900 Active 18 DOM
-
2026-06-07days on market $899,900 Active 17 DOM
-
2026-06-04days on market $899,900 Active 15 DOM
-
2026-06-03days on market $899,900 Active 14 DOM
-
2026-06-02days on market $899,900 Active 13 DOM
-
2026-06-01days on market $899,900 Active 12 DOM
-
2026-05-31days on market $899,900 Active 11 DOM
-
2026-04-15$5,995
-
2026-03-12$999,900 Active
-
2026-03-12$999,900 Active
ⓘ Source: listings_history table (triggers on properties + properties_extension) + one-shot
backfill from property_details.listing_events for pre-trigger history.
Climate risk First Street
- Flood 1/10 Low FEMA zone X (unshaded) · 0% chance over 30 yrs
- Wildfire 1/10 Low
- Heat 3/10 Moderate 7 d/yr ≥86°F today · 15 d/yr by 30 yrs out
- Wind 1/10 Low
- Air quality 7/10 Severe 10 unhealthy d/yr today · 11 by 30 yrs out
Nearby sold comps map
Loading sold comps map…
Walkable amenities ~0.75 mi
Loading nearby amenities…
Taxation est. · year 1
- Rental income
- $92,453
- − Mortgage interest
- −$50,408
- − Property taxes
- −$13,498
- − Insurance
- −$4,500
- − Repairs & maintenance
- −$7,396
- − Management
- −$7,396
- − Depreciation
- −$26,179
- Taxable loss
- −$16,925
- Est. tax savings @ 24.0%
- +$4,062
- After-tax cash flow
- $2,471/yr
For passive investors: Depreciation is non-cash, so a rental often shows a tax loss while cash-flowing — sheltering income. Rental losses are passive: they offset passive income freely, and up to $25,000/yr can offset ordinary (W-2) income if you actively participate and your MAGI is under $100k (phasing out to $0 by $150k); unused losses carry forward. On sale, claimed depreciation is recaptured at up to 25%, and gains may owe capital-gains tax (a 1031 exchange can defer both). Figures are a year-1 estimate at your 24.0% rate — not tax advice; consult a CPA.
Schools (NCES district)
- District
- Seattle Public Schools
- NCES district ID
- 5307710
- Math proficiency
- 64% ▼ -1.00%
- Reading proficiency
- 72% ▬ 0.00%
- Median HH income
- $68,695
- Composite
- 60.76/100
- National rank
- #1649
- State rank
- #19 of 291 in WA
Livability — Seattle
- Score
- 75/100
- State rank
- #166
- US rank
- #4033
Category grades
Schools grade is shown separately in the Schools card above.
Census & demographics
- Census place
- Seattle, WA
Population outlook (King County) Hauer SSP2
- Today (2025)
- 2,576,485 people
- By 2030
- 2,803,316 · +8.8%
- By 2040
- 3,255,921 · +26.4%
- By 2050
- 3,706,444 · +43.9%
- By 2075
- 4,746,063 · +84.2%
- By 2100
- 5,407,730 · +109.9%
Not yet ingested
- Political lean
- —
- Race & ethnicity
- —
- Common origin
- —
- Civics
- —
Market trends
- HPI YoY
- —
- Current HPI
- —
- Rent YoY
- —
- Metro
- —
- State GDP YoY
- ▲ 4.65%
- F500 in state
- 22
Industry mix (Fortune 500 HQ in WA)
| Industry | F500 HQs | Revenue |
|---|---|---|
| Retail | 2 | $269B |
|
||
| Technology / Retail | 1 | $638B |
|
||
| Technology | 1 | $245B |
|
||
| Telecommunications | 1 | $38B |
|
||
| Food / Beverage | 1 | $36B |
|
||
| Automotive / Trucks | 1 | $34B |
|
||
Price history
-99.4% since first listed3 events — show timeline
- 2026-04-15 Listed for Rent $5,995 SHOWMOJO
- 2026-03-12 Listed $999,900 NWMLS as Distributed by MLS Grid
- 2026-03-12 Listed $999,900 NWMLS as Distributed by MLS Grid
Cash-flow waterfall
monthlySold comps — $/sqft
last 12 mo · ≤1 miLoading sold comps…