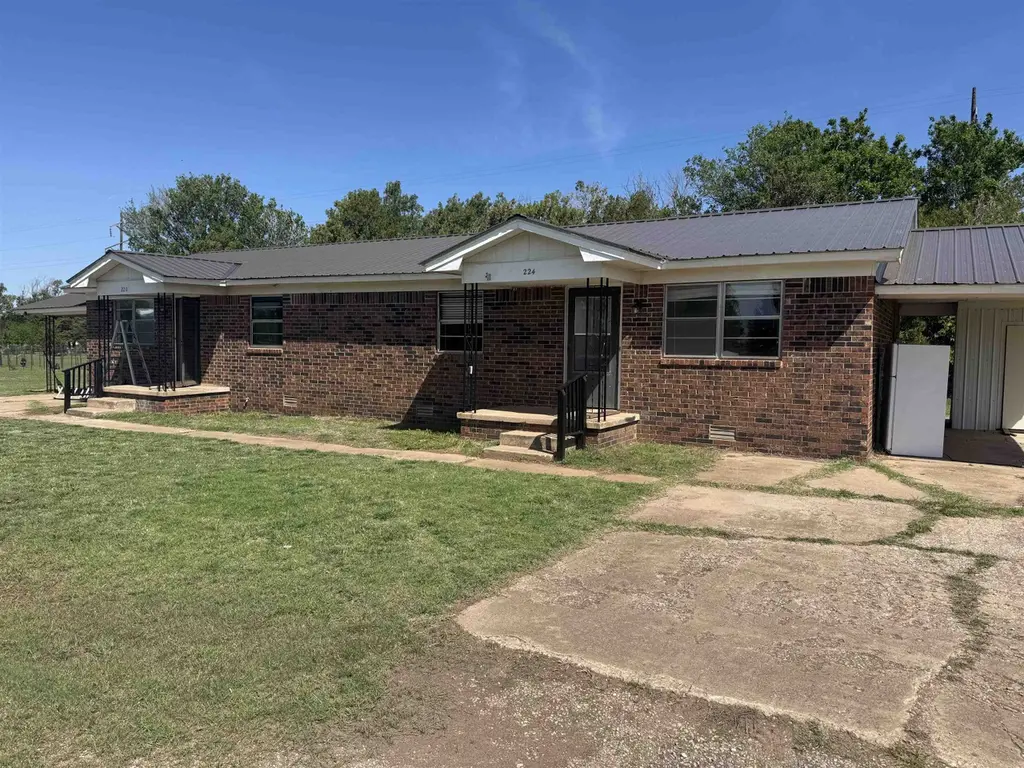
224 Ash · Medford, OK
Flood risk 1/10 · Minimal
- FEMA flood zone
- —
- Chance of flooding over 30 yrs
- 0.0%
- Est. flood insurance / yr
- —
Fire risk 3/10 · Minor
- Est. fire insurance / yr
- $2,463 – $4,575
Heat risk 6/10 · Moderate
- Hot days now (above 109°F)
- 7 days/yr
- Hot days in 30 yrs
- 19 days/yr
Wind risk 2/10 · Minimal
- Chance of severe wind over 30 yrs
- 2.0%
Air-quality risk 2/10 · Minimal
- Unhealthy air days now
- 1 days/yr
- Unhealthy air days in 30 yrs
- 1 days/yr
Risk factors via First Street. Map © Google.
Why this score? — see what drove the B- grade
The composite is a weighted blend of 9 inputs, each scored 0–100. Each bar is that input's sub-score; the figure is the points it added to the 100-point composite (weight × sub-score).
- Cash flow +25.2/30.0
- ARV discount +15.0/15.0
- DSCR +8.2/10.0
- 1% rule +5.2/10.0
- Appreciation +5.0/10.0
- Livability +3.2/5.0
- Schools +3.1/10.0
- Rent growth +2.5/5.0
- Condition / age +2.5/5.0
$122,000
🖨 Deal sheet 📄 Offer letter ✓ Due diligence
Listing remarks
Prime Investor Opportunity in Medford, OK! This 1,600 sq ft renovated duplex (4BR/2BA) is move-in ready with a new metal roof, flooring, and fixtures, ensuring low near-term CapEx and immediate cash flow. The real value-add lies in the 3 included acres directly behind the structure, already plumbed and development-ready. Whether you hold for rental income or expand with new builds in this peaceful community, this package offers significant equity potential and versatile exit strategies.
Key facts
- New metal roof
- Renovated duplex
- 3 included acres
Tags
Property features AI
Exterior
- Parking: 2-car garage
- Utilities: Public water; Public sewer
- Home design: Residential condo/townhouse; Single-story; 1,600 above-grade finished area
- Construction: Brick veneer construction; Metal roof
- Exterior features: Metal roof; Faces south; Located in the Fair Acres 2nd subdivision
Interior
- Kitchen: Refrigerator
- Flooring: Concrete; Ceramic tile; Laminate; Tile
- Bathrooms: 2 full bathrooms
- Heating & cooling: Central heating (electric); Central air conditioning
- Interior features: Refrigerator included
Neighborhood map
What this means for you Summary
Snapshot
- This is a 4-bed/2.0-bath single-family listed at $122k.
Deal economics
- At list price, monthly cash flow is $272 ($3k/yr) — positive.
- The deal already cash-flows at list — no discount required.
- Meets the 1% rule at list price ($1k rent vs $122k).
- Recommended offer: $118k (3.0% below list) — sets the bar for market timing.
Location & tenants
- Location reads 64/100 on livability (#164 in OK) — a middle-class / working-renter tenant base. Strengths: crime A+, cost of living A+, housing B; Watch: schools C-, employment D, amenities F.
- Medford (rural): math 25% / reading 40% proficiency, ranked #215 of 513 in OK (top 42%) — families likely to look elsewhere, expect single-tenant / working-renter base with shorter leases.
- Market conditions: 6 active listings in the ZIP.
Forward outlook
- In year one you build about $5k of equity ($843 loan paydown + $4k appreciation (3.0% local appreciation)).
- Grant County population projected at +4% by 2050 — modest demand growth; plan on rents tracking national, not racing it.
- At projected returns (3.0% appreciation + 3.0% rent growth), your $34k cash investment doubles in ~4 years — after that, you're playing with house money.
- By year 8, paydown + projected appreciation supports a ~$33k cash-out refi (75% LTV) — recoverable capital for the next deal without selling this one.
Negotiation context
- It's been on market 52 days — a 3% lower offer ($118k) is reasonable based on typical stale-listing flexibility.
- Current owner paid $14k; list at $122k implies a 741% gain — meaningful room to come down on a strong offer.
Risks & watch-outs
- Climate carrying-cost: extreme-heat days projected 7→19/yr by 2055 (HVAC capex compounding) — expect insurance premiums to compound above CPI over the hold.
Questions for the listing agent
- It's been on market 52 days. Have you received any prior offers? Is the seller open to a 3% concession, seller financing, or rate buy-down credit?
- Built in 1970 — when were the roof, HVAC, electrical panel, plumbing, and water heater last replaced?
- Is there a deadline driving the sale (1031 exchange, divorce, estate, relocation)? That informs how much negotiation room exists.
- What's the average days-on-market for RENTAL listings here right now (not sales)? A rising rental-DOM trend means longer vacancies and softer asking-rent achievability than the comps imply.
- What's the recent tenant-quality profile in this submarket — average credit score on applications, eviction rate, late-payment / NSF rate, and stable-employment percentage? A property-management company in the area should have these aggregated.
- How much new for-sale + rental construction is in the pipeline within 1–3 miles? Heavy new supply typically softens prices + rents 12–24 months out; constrained supply supports both.
Investment metrics
- 1% rule
- 1.02% ✓
- Cap rate
- 8.97%
- Cash-on-cash
- 9.55%
- DSCR
- 1.42
- GRM
- 8.2
CMA / ARV
- ARV (on-the-fly)
- $155,200
- Comps found
- 3
Show comp detail 3 sales within ~0.75 mi
| Address | Dist | Beds/Ba | Sqft | Sold | Price | $/sf | Match |
|---|---|---|---|---|---|---|---|
| 717 Hillcrest Dr | 0.34mi | 3/2.0 (-1) | 1,586 (-1%) | 2mo | $160,000 | $101 | 76 |
| 118 Fir Dr | 0.19mi | 3/2.0 (-1) | 1,625 (+2%) | 20mo | $145,000 | $89 | 67 |
| 617 Hillcrest | 0.37mi | 3/2.0 (-1) | 1,736 (+8%) | 7mo | $168,000 | $97 | 58 |
Match score weights: distance 35% · size 25% · config 20% · recency 20%. Top-matched comps best support the ARV.
Projected returns pro-forma
3.0% appreciation · 3.0% rent growth · sell at horizon
- IRR
- 16.4%
- Equity multiple
- 1.94×
- Total profit
- $31,949
- Equity at exit
- $54,856
- IRR
- 17.9%
- Equity multiple
- 3.62×
- Total profit
- $89,406
- Equity at exit
- $84,540
Cash invested: $34,160 (down + closing). Projections, not guarantees.
Landlord ↔ Tenant lean methodology
- Overall (STATE)
- 83 Strongly Landlord-Friendly
- State Oklahoma
- 83 Strongly Landlord-Friendly · R+20
- County
- — inherits STATE
- City
- — inherits STATE
ZIP-level market 73759
- Active inventory
- 6
- Price-to-rent
- 8.2×
Monthly cashflow live
- Estimated rent
- $1,247 medium interval (Pro) →
- Mortgage (P&I)
- −$640
- Tax from tax record
- −$22 /mo · $268/yr
- Insurance
- −$51
- HOA
- −$0
- Vacancy / Maint / Mgmt
- −$262
- Net cashflow
- $272
Break-even live
UW: 25.0% down · 7.5% · 30yr · 1.5% tax · 5.0% vac · 8.0% maint · 8.0% mgmt
Financing live
Cash to close
- Down payment
- $30,500
- Closing costs
- $3,660
- Reserves months
- —
- Total cash needed
- —
Loan-product check · same deal, 3 products live
Conventional
25% down · 7.5% · 30yr
- Down + closing
- —
- Monthly P&I
- —
- Monthly cashflow
- —
- DSCR
- —
- Eligible?
- —
Personal DTI + credit; lowest rate.
DSCR
20% down · 8.5% · 30yr
- Down + closing
- —
- Monthly P&I
- —
- Monthly cashflow
- —
- DSCR
- —
- Eligible?
- —
No personal income docs; deal must DSCR.
Hard money
10% down · 12.0% · 12mo
- Down + closing
- —
- Monthly P&I
- —
- Monthly cashflow
- —
- DSCR
- —
- Eligible?
- —
Short-term bridge; refi at stabilization.
Listing history 16 events
-
2026-06-18days on market $122,000 Active 52 DOM
-
2026-06-17days on market $122,000 Active 51 DOM
-
2026-06-16days on market $122,000 Active 50 DOM
-
2026-06-15days on market $122,000 Active 49 DOM
-
2026-06-13days on market $122,000 Active 47 DOM
-
2026-06-12days on market $122,000 Active 46 DOM
-
2026-06-09days on market $122,000 Active 43 DOM
-
2026-06-08days on market $122,000 Active 42 DOM
-
2026-06-08days on market $122,000 Active 41 DOM
-
2026-06-07days on market $122,000 Active 40 DOM
-
2026-06-04days on market $122,000 Active 37 DOM
-
2026-06-02days on market $122,000 Active 36 DOM
-
2026-06-01days on market $122,000 Active 35 DOM
-
2026-05-31days on market $122,000 Active 34 DOM
-
2026-04-27$122,000 Active
-
2000-10-18soldstatus $14,500
ⓘ Source: listings_history table (triggers on properties + properties_extension) + one-shot
backfill from property_details.listing_events for pre-trigger history.
Tax reassessment forecast OK · Resets to sale price
- Current annual tax
- $268 · $22/mo
- Projected year-2 tax
- $1,098 · $92/mo
- Expected delta
- +$830/yr (+$69/mo · 309.7%)
ⓘ Screening estimate from a state-policy table — verify with the county assessor before closing.
Climate risk First Street
- Flood 1/10 Low 0% chance over 30 yrs
- Wildfire 3/10 Moderate
- Heat 6/10 Major 7 d/yr ≥109°F today · 19 d/yr by 30 yrs out
- Wind 2/10 Low 2% chance of damaging wind over 30 yrs
- Air quality 2/10 Low 1 unhealthy d/yr today · 1 by 30 yrs out
Nearby sold comps map
Loading sold comps map…
Walkable amenities ~0.75 mi
Loading nearby amenities…
Taxation est. · year 1
- Rental income
- $14,959
- − Mortgage interest
- −$6,834
- − Property taxes
- −$268
- − Insurance
- −$610
- − Repairs & maintenance
- −$1,197
- − Management
- −$1,197
- − Depreciation
- −$3,549
- Taxable income
- $1,304
- Est. tax owed @ 24.0%
- −$313
- After-tax cash flow
- $2,949/yr
For passive investors: Depreciation is non-cash, so a rental often shows a tax loss while cash-flowing — sheltering income. Rental losses are passive: they offset passive income freely, and up to $25,000/yr can offset ordinary (W-2) income if you actively participate and your MAGI is under $100k (phasing out to $0 by $150k); unused losses carry forward. On sale, claimed depreciation is recaptured at up to 25%, and gains may owe capital-gains tax (a 1031 exchange can defer both). Figures are a year-1 estimate at your 24.0% rate — not tax advice; consult a CPA.
Schools (NCES district)
- District
- Medford
- NCES district ID
- 4019620
- Math proficiency
- 25% ▬ 0.00%
- Reading proficiency
- 40% ▼ -5.00%
- Median HH income
- $46,345
- Composite
- 30.63/100
- National rank
- #11449
- State rank
- #215 of 513 in OK
Livability — Medford
- Score
- 64/100
- State rank
- #164
- US rank
- #13665
Category grades
Schools grade is shown separately in the Schools card above.
Census & demographics
- Census place
- Medford, OK
- Population (ZIP)
- 1,352
Population outlook (Grant County) Hauer SSP2
- Today (2025)
- 4,375 people
- By 2030
- 4,328 · -1.1%
- By 2040
- 4,348 · -0.6%
- By 2050
- 4,536 · +3.7%
- By 2075
- 5,336 · +22.0%
- By 2100
- 5,501 · +25.7%
Race, ethnicity, and origin ACS 2023
- Neighborhood character
- Predominantly White (84%)
- Race & ethnicity
- White 84% Two or more races 6% Black 5% Hispanic / Latino 5% Native American 3%
- Common ancestry
- Italian 1% Scotch-Irish 1% Scottish 1%
- Foreign-born
- 0%
- Languages at home
- 94% English-only · German/W. Germanic 5% Spanish 1%
Political lean MEDSL · Grant
- 2024 margin
- Solid R (+70.5) · D 13.9% · R 84.4% · Other 1.7%
- 2008→2024 swing
- -14.3pp toward R · 2008: -56.3pp · 2024: -70.5pp
- All cycles
- 2024: R+70.5 2020: R+73.5 2016: R+70.0 2012: R+62.0 2008: R+56.3
Not yet ingested
- Civics
- —
Market trends
- HPI YoY
- —
- Current HPI
- —
- Rent YoY
- —
- Metro
- —
- State GDP YoY
- ▲ 1.55%
- F500 in state
- 6
Industry mix (Fortune 500 HQ in OK)
| Industry | F500 HQs | Revenue |
|---|---|---|
| Energy | 3 | $48B |
|
||
Price history
+741.4% since first listed2 events — show timeline
- 2026-04-27 Listed $122,000 NWOAR
- 2000-10-18 Sold (Public Records) $14,500 Public Records
Property tax history
+5.0%/yrLatest (2025): $268 · -3.2% YoY. Source: county tax records.
Cash-flow waterfall
monthlySold comps — $/sqft
last 12 mo · ≤1 miLoading sold comps…