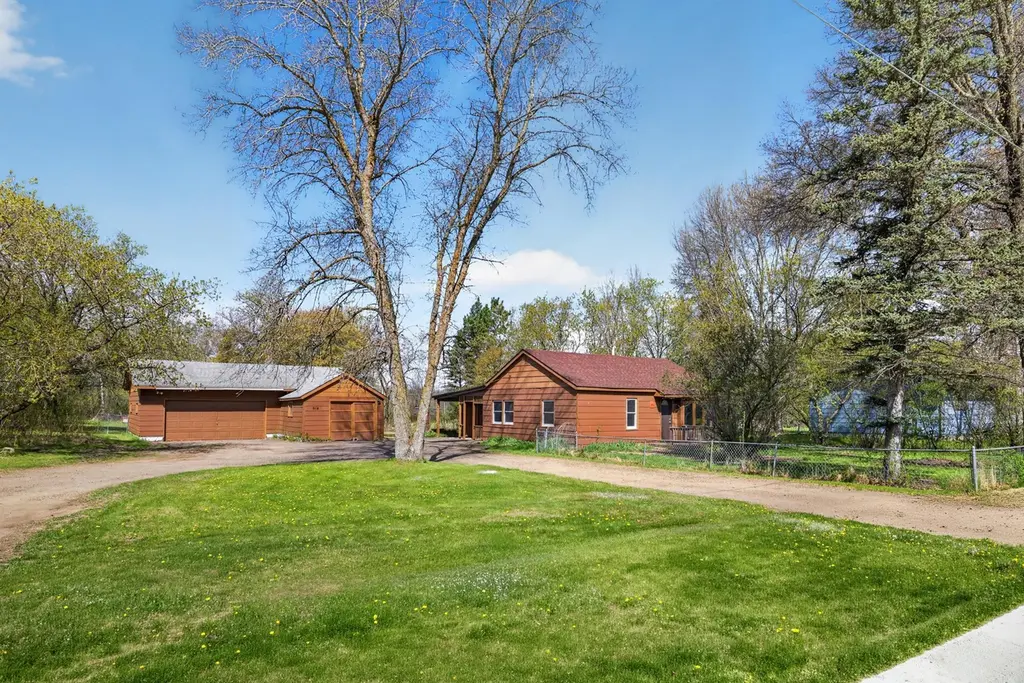
914 Beech St · Brainerd, MN
Flood risk 1/10 · Minimal
- FEMA flood zone
- X (unshaded)
- Chance of flooding over 30 yrs
- 0.0%
- Est. flood insurance / yr
- $473 – $860
Fire risk 5/10 · Moderate
- Est. fire insurance / yr
- $888 – $1,650
Heat risk 1/10 · Minimal
- Hot days now (above 94°F)
- 7 days/yr
- Hot days in 30 yrs
- 13 days/yr
Wind risk 1/10 · Minimal
- Chance of severe wind over 30 yrs
- —
Air-quality risk 2/10 · Minimal
- Unhealthy air days now
- 1 days/yr
- Unhealthy air days in 30 yrs
- 1 days/yr
Risk factors via First Street. Map © Google.
Why this score? — see what drove the D grade
The composite is a weighted blend of 9 inputs, each scored 0–100. Each bar is that input's sub-score; the figure is the points it added to the 100-point composite (weight × sub-score).
- ARV discount +15.0/15.0
- Cash flow +9.8/30.0
- Schools +4.6/10.0
- Livability +3.6/5.0
- DSCR +2.8/10.0
- Rent growth +2.5/5.0
- Condition / age +2.5/5.0
- 1% rule +2.2/10.0
- Appreciation +0.0/10.0
$189,900
🖨 Deal sheet (PDF) 📄 Offer letter ✓ Due diligence
Listing remarks MLS
Home was used as a Rental, 2 Bedroom 2 Bath & Large Detached Garages. Feels like Country Living right in Brainerd, Garages have potential for a very large Workshop. Fenced in Yard. See awesome Sunsets right from your Kitchen and Walking distance to Downtown Brainerd
Key facts
- Newer roof
- Open large kitchen
- Newer windows
Tags
Property features AI
Finance
- Financial info: Other annual assessment: $10,875; Annual tax amount: $1,502 (2025)
Exterior
- Parking: Detached or attached 3-car garage
- Utilities: City water connected; City sewer connected; Natural gas
- Home design: Residential single-story home; Entry level: Main
- Construction: Block foundation; Built area (above grade finished): 1,198 square feet
- Exterior features: Wood exterior; Lot approximately 1.03 acres (about 150 x 300)
Interior
- Kitchen: Kitchen on main level (13x14)
- Bedrooms: 2 bedrooms (both on the main level)
- Bathrooms: 1 full bath; 1 half bath
- Heating & cooling: Forced air heating; Window cooling units
- Interior features: Ceiling fan(s); Deck; Crawl space basement
Neighborhood map
What this means for you Summary
Snapshot
- This is a 2-bed/2.0-bath single-family listed at $190k.
Deal economics
- At list price, monthly cash flow is $-121 ($-1k/yr) — negative.
- To cash-flow at today's rent, offer at most $169k (11.2% below list).
- To meet the 1% rule (rent ≥ 1% of price), the offer needs to be $137k (27.7% below list).
- Recommended offer: $137k (27.7% below list) — sets the bar for 1% rule.
- Cap rate 5.5% vs local median 3.4% in Brainerd — top-decile yield for the area; either an underpriced asset or a hidden risk that comps aren't pricing in. Stress-test before assuming the spread holds.
Location & tenants
- Location reads 72/100 on livability (#272 in MN) — a middle-class / working-renter tenant base. Strengths: cost of living A+, housing A+, health & safety A+; Watch: crime D, amenities F, commute F.
- Brainerd Public School District (town): math 49% / reading 58% proficiency, ranked #85 of 301 in MN (top 28%) — acceptable for families but not a draw, mixed tenant base, ~2y average lease.
- Zoned schools: Harrison Elementary (math 62% / reading 47%, grade C, #320 of 857 statewide, top 41%, 229 students, 72% FRL); Forestview Middle (math 45% / reading 60%, grade C+, #59 of 258 statewide, top 24%, 1,790 students, 45% FRL); Brainerd Senior High (math 47% / reading 62%, grade C-, #87 of 471 statewide, top 22%, 1,842 students, 35% FRL) — zoned schools average 51% FRL vs 31% district-wide (20 pts higher); higher-poverty schools than district average — tighter screening recommended.
- Market conditions: 409 active listings in the ZIP; 1 comparable units currently listed for rent nearby; 420 units permitted in Crow Wing County in 2024 (17 in 5+ unit buildings).
Forward outlook
- Local home prices are declining (-3.0%/yr); year-one equity from $1k of loan paydown is wiped out by about $6k of value loss. Plan a longer hold.
- Crow Wing County population projected to shrink 8% by 2050 — rents likely to lag national; underwrite the cash flow, not the appreciation.
Negotiation context
- It's been on market 15 days — a 2% lower offer ($187k) is reasonable based on typical stale-listing flexibility.
- 10 sale attempts since 19y ago; this cycle's ask has dropped $20k (10%) from the opening price — seller is motivated, your offer sets the floor, not the list.
- Current owner paid $135k; 41% above their basis — modest negotiation headroom, anchor on the comps not their cost.
Risks & watch-outs
- Watch-outs: built in 1944 — expect roof / HVAC / electrical / plumbing capex.
- Climate carrying-cost: moderate wildfire risk — expect insurance premiums to compound above CPI over the hold.
Questions for the listing agent
- What do current leases actually rent for vs. the listed asking? Can we see a recent rent roll and the last 12 months of T-12 income?
- Built in 1944 — when were the roof, HVAC, electrical panel, plumbing, and water heater last replaced?
- Is there a deadline driving the sale (1031 exchange, divorce, estate, relocation)? That informs how much negotiation room exists.
- Schools are B-rated — typically a magnet for longer-tenancy family renters. What's the average tenant stay here, and is there a school-zone premium baked into asking?
- Crime grade is D in this area — have there been break-ins, vandalism, or insurance claims at this property in the last 3 years? What carrier currently insures it and at what premium?
- The area grade is low — what's the realistic commute time and amenity access for the typical tenant pool here? Any planned neighborhood developments (good or bad) we should know about?
- What's the average days-on-market for RENTAL listings here right now (not sales)? A rising rental-DOM trend means longer vacancies and softer asking-rent achievability than the comps imply.
- What's the recent tenant-quality profile in this submarket — average credit score on applications, eviction rate, late-payment / NSF rate, and stable-employment percentage? A property-management company in the area should have these aggregated.
- How much new for-sale + rental construction is in the pipeline within 1–3 miles? Heavy new supply typically softens prices + rents 12–24 months out; constrained supply supports both.
Investment metrics
- 1% rule
- 0.72% ✗
- Cap rate
- 5.53%
- Cash-on-cash
- -2.73%
- DSCR
- 0.88
- GRM
- 11.5
CMA / ARV
- ARV (median comp)
- $291,422
- List price
- $189,900
- Delta
- -34.84%
- Verdict
- UNDERPRICED
- Comps
- 3 within 1.0 mi
Projected returns pro-forma
-3.0% appreciation · 3.0% rent growth · sell at horizon
- IRR
- -20.9%
- Equity multiple
- 0.28×
- Total profit
- $-38,509
- Equity at exit
- $28,315
- IRR
- -14.3%
- Equity multiple
- 0.18×
- Total profit
- $-43,620
- Equity at exit
- $16,419
Cash invested: $53,172 (down + closing). Projections, not guarantees.
Landlord ↔ Tenant lean methodology
- Overall (STATE)
- 46 Balanced
- State Minnesota
- 46 Balanced · D+2
- County
- — inherits STATE
- City
- — inherits STATE
ZIP-level market 56401
- Active inventory
- 409
- Price-to-rent
- 11.5×
Monthly cashflow live
- Estimated rent
- $1,374 medium interval (Pro) →
- Mortgage (P&I)
- −$996
- Tax from tax record
- −$131 /mo · $1,574/yr
- Insurance
- −$79
- HOA
- −$0
- Vacancy / Maint / Mgmt
- −$289
- Net cashflow
- $-121
Break-even live
Sensitivity live
| Price | -10% $-13 | -5% $-67 | +0% $-121 | +5% $-175 | +10% $-228 |
|---|---|---|---|---|---|
| Rent | -10% $-229 | -5% $-175 | +0% $-121 | +5% $-67 | +10% $-12 |
| Rate | -1.0pp $-25 | -0.5pp $-72 | base $-121 | +0.5pp $-170 | +1.0pp $-220 |
UW: 25.0% down · 7.5% · 30yr · 1.5% tax · 5.0% vac · 8.0% maint · 8.0% mgmt
Financing live
Cash to close
- Down payment
- $47,475
- Closing costs
- $5,697
- Reserves months
- —
- Total cash needed
- —
Loan-product check · same deal, 3 products live
Conventional
25% down · 7.5% · 30yr
- Down + closing
- —
- Monthly P&I
- —
- Monthly cashflow
- —
- DSCR
- —
- Eligible?
- —
Personal DTI + credit; lowest rate.
DSCR
20% down · 8.5% · 30yr
- Down + closing
- —
- Monthly P&I
- —
- Monthly cashflow
- —
- DSCR
- —
- Eligible?
- —
No personal income docs; deal must DSCR.
Hard money
10% down · 12.0% · 12mo
- Down + closing
- —
- Monthly P&I
- —
- Monthly cashflow
- —
- DSCR
- —
- Eligible?
- —
Short-term bridge; refi at stabilization.
Rent comps 1 comps
| Address | Beds | Baths | Sqft | Rent | $/sqft | DOM | Units | Dist |
|---|---|---|---|---|---|---|---|---|
| 623 28th St SE Brainerd, MN | 2.0 | 2.0 | 964 | $1,699 | $1.76 | 46d | 3 | 0.23mi |
Listing history 24 events
-
2026-06-07pricestatusdays on market $189,900 Pending 15 DOM
-
2026-05-13$209,900 Active 285-char remark
-
2021-09-20soldstatus $135,000
-
2021-09-13soldstatus $135,000 Sold 270-char remark
Show marketing remark (270 chars)
Home was used as a Rental, 2 Bedroom 2 Bath & Large Detached Garages. Feels like Country Living right in Brainerd, Garages have potential for a very large Workshop. Fenced in Yard. See awesome Sunsets right from your Kitchen and Walking distance to Downtown Brainerd
-
2021-08-16status Pending 270-char remark
Show marketing remark (270 chars)
Home was used as a Rental, 2 Bedroom 2 Bath & Large Detached Garages. Feels like Country Living right in Brainerd, Garages have potential for a very large Workshop. Fenced in Yard. See awesome Sunsets right from your Kitchen and Walking distance to Downtown Brainerd
-
2021-07-10price $139,000 270-char remark
Show marketing remark (270 chars)
Home was used as a Rental, 2 Bedroom 2 Bath & Large Detached Garages. Feels like Country Living right in Brainerd, Garages have potential for a very large Workshop. Fenced in Yard. See awesome Sunsets right from your Kitchen and Walking distance to Downtown Brainerd
-
2021-05-13status Active 270-char remark
Show marketing remark (270 chars)
Home was used as a Rental, 2 Bedroom 2 Bath & Large Detached Garages. Feels like Country Living right in Brainerd, Garages have potential for a very large Workshop. Fenced in Yard. See awesome Sunsets right from your Kitchen and Walking distance to Downtown Brainerd
-
2021-05-11status Pending 270-char remark
Show marketing remark (270 chars)
Home was used as a Rental, 2 Bedroom 2 Bath & Large Detached Garages. Feels like Country Living right in Brainerd, Garages have potential for a very large Workshop. Fenced in Yard. See awesome Sunsets right from your Kitchen and Walking distance to Downtown Brainerd
-
2021-05-07$145,000 Active 270-char remark
Show marketing remark (270 chars)
Home was used as a Rental, 2 Bedroom 2 Bath & Large Detached Garages. Feels like Country Living right in Brainerd, Garages have potential for a very large Workshop. Fenced in Yard. See awesome Sunsets right from your Kitchen and Walking distance to Downtown Brainerd
-
2013-05-31historical
-
2013-03-29$89,900
-
2012-08-31historical
-
2011-12-08$79,900
-
2010-12-17historical
-
2010-12-17soldstatus $43,000
-
2010-06-15$45,000
-
2010-06-15historical
-
2009-09-15$106,000
-
2009-07-31historical
-
2009-01-31$106,000
-
2008-12-30historical
-
2008-08-07$106,000
-
2008-03-06historical
-
2007-09-05$113,400
ⓘ Source: listings_history table (triggers on properties + properties_extension) + one-shot
backfill from property_details.listing_events for pre-trigger history.
Tax reassessment forecast MN · Partial reset (capped growth)
- Current annual tax
- $1,574 · $131/mo
- Projected year-2 tax
- $1,850 · $154/mo
- Expected delta
- +$276/yr (+$23/mo · 17.6%)
ⓘ Screening estimate from a state-policy table — verify with the county assessor before closing.
Climate risk First Street
- Flood 1/10 Low FEMA zone X (unshaded) · 0% chance over 30 yrs
- Wildfire 5/10 Major
- Heat 1/10 Low 7 d/yr ≥94°F today · 13 d/yr by 30 yrs out
- Wind 1/10 Low
- Air quality 2/10 Low 1 unhealthy d/yr today · 1 by 30 yrs out
Nearby sold comps map
Loading sold comps map…
Walkable amenities ~0.75 mi
Loading nearby amenities…
Taxation est. · year 1
- Rental income
- $16,487
- − Mortgage interest
- −$10,637
- − Property taxes
- −$1,574
- − Insurance
- −$950
- − Repairs & maintenance
- −$1,319
- − Management
- −$1,319
- − Depreciation
- −$5,524
- Taxable loss
- −$4,837
- Est. tax savings @ 24.0%
- +$1,161
- After-tax cash flow
- $-289/yr
For passive investors: Depreciation is non-cash, so a rental often shows a tax loss while cash-flowing — sheltering income. Rental losses are passive: they offset passive income freely, and up to $25,000/yr can offset ordinary (W-2) income if you actively participate and your MAGI is under $100k (phasing out to $0 by $150k); unused losses carry forward. On sale, claimed depreciation is recaptured at up to 25%, and gains may owe capital-gains tax (a 1031 exchange can defer both). Figures are a year-1 estimate at your 24.0% rate — not tax advice; consult a CPA.
Schools (NCES district)
- District
- Brainerd Public School District
- NCES district ID
- 2706090
- Math proficiency
- 49% ▼ -13.00%
- Reading proficiency
- 58% ▼ -9.00%
- Median HH income
- $49,059
- Composite
- 45.57/100
- National rank
- #2596
- State rank
- #85 of 301 in MN
Livability — Brainerd
- Score
- 72/100
- State rank
- #272
- US rank
- #5889
Category grades
Schools grade is shown separately in the Schools card above.
Census & demographics
- Census place
- Brainerd, MN
- County
- Crow Wing County · 40,773 people
- City population
- 31,841
- Metro
- Brainerd, MN
- Population (ZIP)
- 31,841
- Household income
- $73,128
- Rent vs Own
- Severe rent burden
- 454.0
Population outlook (Crow Wing County) Hauer SSP2
- Today (2025)
- 64,187 people
- By 2030
- 64,057 · -0.2%
- By 2040
- 62,470 · -2.7%
- By 2050
- 59,064 · -8.0%
- By 2075
- 48,738 · -24.1%
- By 2100
- 36,112 · -43.7%
Race, ethnicity, and origin ACS 2023
- Neighborhood character
- Predominantly White (93%)
- Race & ethnicity
- White 93% Two or more races 2% Hispanic / Latino 2% Native American 1%
- Common ancestry
- Portuguese 12% Romanian 6% Lithuanian 5%
- Foreign-born
- 1% · Canada
- Languages at home
- 98% English-only · Spanish 1%
Political lean MEDSL · Crow Wing
- 2024 margin
- Solid R (+31.4) · D 33.6% · R 65.0% · Other 1.5%
- 2008→2024 swing
- -23.7pp toward R · 2008: -7.7pp · 2024: -31.4pp
- All cycles
- 2024: R+31.4 2020: R+29.7 2016: R+31.8 2012: R+13.4 2008: R+7.7
Not yet ingested
- Civics
- —
Market trends
- HPI YoY
- ▼ -226.09%
- Current HPI
- 220.3299
- Rent YoY
- —
- Metro
- Brainerd, MN
- State GDP YoY
- ▲ 2.41%
- F500 in state
- 34
Industry mix (Fortune 500 HQ in MN)
| Industry | F500 HQs | Revenue |
|---|---|---|
| Healthcare | 2 | $407B |
|
||
| Retail | 2 | $150B |
|
||
| Consumer Goods | 2 | $32B |
|
||
| Industrial Machinery | 2 | $6B |
|
||
| Agriculture | 1 | $40B |
|
||
| Healthcare / Medical Devices | 1 | $32B |
|
||
Price history
+67.5% since first listed25 events — show timeline
- 2026-06-05 Pending — NORTHSTARMLS as Distributed by MLS Grid
- 2026-05-27 Price Changed $189,900 NORTHSTARMLS as Distributed by MLS Grid
- 2026-05-13 Listed $209,900 NORTHSTARMLS as Distributed by MLS Grid
- 2021-09-20 Sold (Public Records) $135,000 Public Records
- 2021-09-13 Sold (MLS) $135,000 NORTHSTARMLS as Distributed by MLS Grid
- 2021-08-16 Pending — NORTHSTARMLS as Distributed by MLS Grid
- 2021-07-10 Price Changed $139,000 NORTHSTARMLS as Distributed by MLS Grid
- 2021-05-13 Relisted — NORTHSTARMLS as Distributed by MLS Grid
- 2021-05-11 Pending — NORTHSTARMLS as Distributed by MLS Grid
- 2021-05-07 Listed $145,000 NORTHSTARMLS as Distributed by MLS Grid
- 2013-05-31 Listing Removed — NORTHSTARMLS as Distributed by MLS Grid
- 2013-03-29 Listed $89,900 NORTHSTARMLS as Distributed by MLS Grid
- 2012-08-31 Listing Removed — NORTHSTARMLS as Distributed by MLS Grid
- 2011-12-08 Listed $79,900 NORTHSTARMLS as Distributed by MLS Grid
- 2010-12-17 Listing Removed — NORTHSTARMLS as Distributed by MLS Grid
- 2010-12-17 Sold (MLS) $43,000 NORTHSTARMLS as Distributed by MLS Grid
- 2010-06-15 Listing Removed — NORTHSTARMLS as Distributed by MLS Grid
- 2010-06-15 Listed $45,000 NORTHSTARMLS as Distributed by MLS Grid
- 2009-09-15 Listed $106,000 NORTHSTARMLS as Distributed by MLS Grid
- 2009-07-31 Listing Removed — NORTHSTARMLS as Distributed by MLS Grid
- 2009-01-31 Listed $106,000 NORTHSTARMLS as Distributed by MLS Grid
- 2008-12-30 Listing Removed — NORTHSTARMLS as Distributed by MLS Grid
- 2008-08-07 Listed $106,000 NORTHSTARMLS as Distributed by MLS Grid
- 2008-03-06 Listing Removed — NORTHSTARMLS as Distributed by MLS Grid
- 2007-09-05 Listed $113,400 NORTHSTARMLS as Distributed by MLS Grid
Property tax history
+4.1%/yrLatest (2026): $1,574 · +4.8% YoY. Source: county tax records.
Cash-flow waterfall
monthlySold comps — $/sqft
last 12 mo · ≤1 miLoading sold comps…