 Multi-family
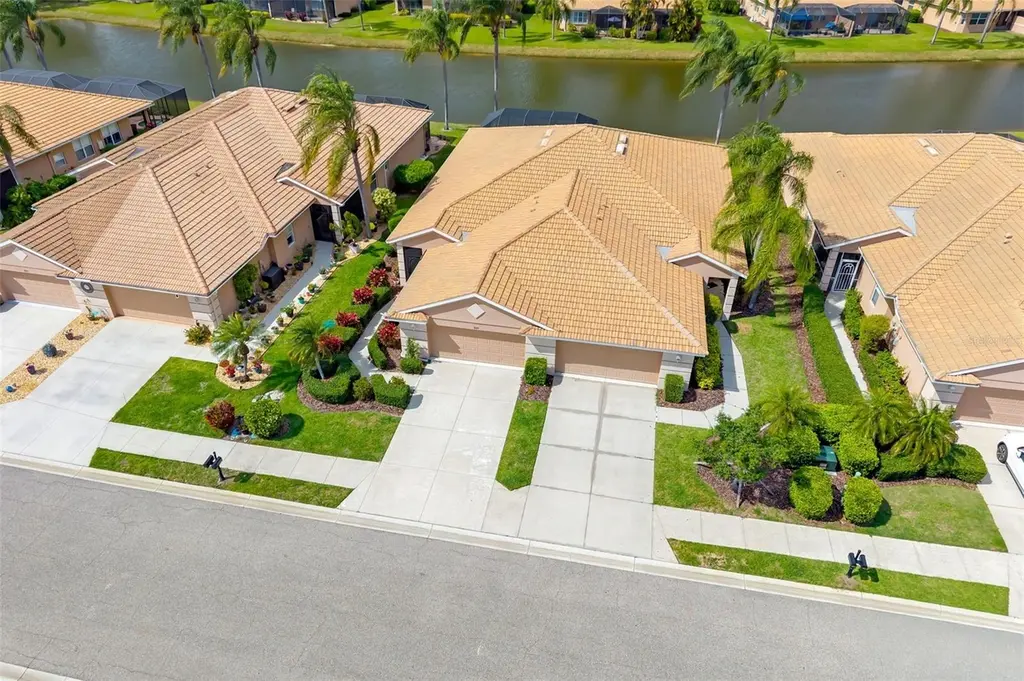
8323 Eagle Isles Pl · Lakewood Ranch, FL
Flood risk 1/10 · Minimal
- FEMA flood zone
- X (unshaded)
- Chance of flooding over 30 yrs
- 0.0%
- Est. flood insurance / yr
- $507 – $1,088
Fire risk 3/10 · Minor
- Est. fire insurance / yr
- $947 – $1,759
Heat risk 10/10 · Severe
- Hot days now (above 107°F)
- 7 days/yr
- Hot days in 30 yrs
- 29 days/yr
Wind risk 10/10 · Severe
- Chance of severe wind over 30 yrs
- 99.0%
Air-quality risk 3/10 · Minor
- Unhealthy air days now
- 3 days/yr
- Unhealthy air days in 30 yrs
- 3 days/yr
Risk factors via First Street. Map © Google.
Why this score? — see what drove the D- grade
The composite is a weighted blend of 9 inputs, each scored 0–100. Each bar is that input's sub-score; the figure is the points it added to the 100-point composite (weight × sub-score).
- Cash flow +9.8/30.0
- ARV discount +7.5/15.0
- 1% rule +4.5/10.0
- Schools +4.4/10.0
- Appreciation +4.1/10.0
- DSCR +2.8/10.0
- Livability +2.5/5.0
- Condition / age +2.5/5.0
- Rent growth +1.6/5.0
$329,000
🖨 Deal sheet 📄 Offer letter ✓ Due diligence
Multi-family units
County records classify this as Multi-Family (2-4 Unit). Listing-text estimate: 1 unit. estimate disagrees with records
Listing remarks
Under contract-accepting backup offers. Welcome to effortless Florida living in the highly sought after Heritage Harbor where lifestyle, convenience, and comfort come together beautifully. This charming maintenance free 2-bedroom, 2-bath villa offers the privacy you’ve been looking for. No need to worry about neighbors above you or on both sides of you. Step outside and get ready to be WOW’d with this water view. You can sit outside on your lanai and create memories. Comes with a coveted two-car garage. Inside, the layout is thoughtfully designed to provide both functionality and flexibility. You’ll find a bright and inviting living room and a breakfast dining nook area. I
Key facts
- Relaxing spa
- Pickleball courts
- Tennis courts
Tags
Property features AI
Finance
- Other: Homestead exempt; CDD present
- Financial info: Lease restrictions apply; Other annual assessment approximately $701
- HOA & community: Homeowners association (Fairway Green/Casey Management; Heritage Harbour); Monthly HOA approximately $255; Quarterly association fees (one listed at $765, another at $70); Association approval required; Association fee includes pest control; Community amenities: clubhouse, dog park, golf, playground, pool, tennis courts, fitness center, pickleball courts, park, spa/hot tub, street lights, gated
Exterior
- Parking: Driveway; Attached 2-car garage with garage door opener
- Security: Gated community; Security system (owned); Smoke detectors
- Utilities: Public water; Public sewer; Cable available; Electricity connected; Underground utilities
- Home design: Residential villa; One story; South-facing
- Construction: Block and stucco construction; Tile roof; Slab foundation; Built on a 0.11-acre lot; Landscaped with trees
- Exterior features: Hurricane shutters; Sliding doors; Lakefront location with lake view
Interior
- Kitchen: Dishwasher; Disposal; Microwave; Range; Refrigerator; Solid surface counters; Eat-in kitchen
- Bedrooms: 2 bedrooms
- Flooring: Carpet; Ceramic tile
- Bathrooms: 2 full bathrooms
- Heating & cooling: Central heating (electric); Central air conditioning
- Interior features: Eat-in kitchen; Kitchen/family room combo; Open floorplan; Solid surface counters; Split bedroom floorplan; Walk-in closet(s); Window treatments
- Laundry & utility: Washer; Dryer; Inside laundry; Inside utility
Neighborhood map
What this means for you Summary
Snapshot
- This is a 2-bed/2.0-bath multifamily listed at $329k.
Deal economics
- At list price, monthly cash flow is $-212 ($-3k/yr) — negative.
- To cash-flow at today's rent, offer at most $291k (11.4% below list).
- To meet the 1% rule (rent ≥ 1% of price), the offer needs to be $313k (4.9% below list).
- Recommended offer: $291k (11.4% below list) — sets the bar for cash-flow.
- Cap rate 5.5% vs local median 3.3% in Lakewood Ranch — top-decile yield for the area; either an underpriced asset or a hidden risk that comps aren't pricing in. Stress-test before assuming the spread holds.
Location & tenants
- Location reads: area grade D — affects rentability + tenant quality, not the cash-flow math above.
- Manatee (suburban): math 54% / reading 50% proficiency, ranked #26 of 73 in FL (top 36%) — acceptable for families but not a draw, mixed tenant base, ~2y average lease.
- Market conditions: Rents falling (-3.4%/yr); 479 active listings in the ZIP; 40 comparable units currently listed for rent nearby; rentals at typical pace (median 24d on market — plan ~3-4 weeks tenant-placement turnaround); high-income renter base; 7,472 units permitted in Manatee County in 2024 (1,782 in 5+ unit buildings).
Forward outlook
- Local home prices are declining (-1.8%/yr); year-one equity from $2k of loan paydown is wiped out by about $6k of value loss. Plan a longer hold.
- Manatee County population projected at +43% by 2050 — long-run rental-demand tailwind backs the buy-and-hold thesis.
Negotiation context
- Only 4 days on market — expect competitive offers; lowballing is unlikely to land.
- 10 sale attempts since 22y ago with the ask held roughly flat each time — persistent listings suggest the price (not the market) is what's stuck; bring a comps-based counter.
- Current owner paid $219k; list at $329k implies a 50% gain — meaningful room to come down on a strong offer.
Risks & watch-outs
- Climate carrying-cost: severe wind risk, 99% chance of damaging wind over 30y; extreme-heat days projected 7→29/yr by 2055 (HVAC capex compounding) — expect insurance premiums to compound above CPI over the hold.
Questions for the listing agent
- What do current leases actually rent for vs. the listed asking? Can we see a recent rent roll and the last 12 months of T-12 income?
- What does the HOA fee cover, when was the last increase, and are there any pending special assessments or reserve-fund shortfalls?
- Is there a deadline driving the sale (1031 exchange, divorce, estate, relocation)? That informs how much negotiation room exists.
- The area grade is low — what's the realistic commute time and amenity access for the typical tenant pool here? Any planned neighborhood developments (good or bad) we should know about?
- What's the average days-on-market for RENTAL listings here right now (not sales)? A rising rental-DOM trend means longer vacancies and softer asking-rent achievability than the comps imply.
- What's the recent tenant-quality profile in this submarket — average credit score on applications, eviction rate, late-payment / NSF rate, and stable-employment percentage? A property-management company in the area should have these aggregated.
- How much new apartment / multifamily construction is in the pipeline within 1–3 miles? Heavy new supply (>2% of stock underway) typically softens rents 12–24 months out; light construction supports rent growth.
Investment metrics
- 1% rule
- 0.95% ✗
- Cap rate
- 5.52%
- Cash-on-cash
- -2.77%
- DSCR
- 0.88
- GRM
- 8.8
CMA / ARV
No comps found within radius.
Projected returns pro-forma
-1.82% appreciation · 0.0% rent growth · sell at horizon
- IRR
- -16.7%
- Equity multiple
- 0.36×
- Total profit
- $-59,153
- Equity at exit
- $66,664
- IRR
- -14.4%
- Equity multiple
- 0.04×
- Total profit
- $-88,245
- Equity at exit
- $59,632
Cash invested: $92,120 (down + closing). Projections, not guarantees.
Landlord ↔ Tenant lean methodology
- Overall (STATE)
- 87 Strongly Landlord-Friendly
- State Florida
- 87 Strongly Landlord-Friendly · R+3
- County
- — inherits STATE
- City
- — inherits STATE
ZIP-level market 34212
- Home prices YoY
- -0.7%
- Rents YoY
- -3.4%
- Active inventory
- 479
- Price-to-rent
- 8.8×
Monthly cashflow live
- Estimated rent
- $3,129 high interval (Pro) →
- Mortgage (P&I)
- −$1,725
- Tax from tax record
- −$452 /mo · $5,426/yr
- Insurance
- −$137
- HOA
- −$370
- Vacancy / Maint / Mgmt
- −$657
- Net cashflow
- $-212
Break-even live
UW: 25.0% down · 7.5% · 30yr · 1.5% tax · 5.0% vac · 8.0% maint · 8.0% mgmt
Financing live
Cash to close
- Down payment
- $82,250
- Closing costs
- $9,870
- Reserves months
- —
- Total cash needed
- —
Loan-product check · same deal, 3 products live
Conventional
25% down · 7.5% · 30yr
- Down + closing
- —
- Monthly P&I
- —
- Monthly cashflow
- —
- DSCR
- —
- Eligible?
- —
Personal DTI + credit; lowest rate.
DSCR
20% down · 8.5% · 30yr
- Down + closing
- —
- Monthly P&I
- —
- Monthly cashflow
- —
- DSCR
- —
- Eligible?
- —
No personal income docs; deal must DSCR.
Hard money
10% down · 12.0% · 12mo
- Down + closing
- —
- Monthly P&I
- —
- Monthly cashflow
- —
- DSCR
- —
- Eligible?
- —
Short-term bridge; refi at stabilization.
Rent comps 40 comps
| Address | Beds | Baths | Sqft | Rent | $/sqft | DOM | Units | Dist |
|---|---|---|---|---|---|---|---|---|
| 404 Golden Harbour Trl Bradenton, FL | 3.0 | 2.0 | 2204 | $3,700 | $1.68 | 3d | 1 | 0.40mi |
| 115 River Enclave Ct Bradenton, FL | 3.0 | 2.0 | 2074 | $6,900 | $3.33 | 3d | 1 | 0.40mi |
| 135 River Enclave Ct Bradenton, FL | 3.0 | 2.0 | 2062 | $1,950 | $0.95 | 3d | 1 | 0.44mi |
| 8820 Heritage Sound Dr Bradenton, FL | 3.0 | 2.0 | 2036 | $5,000 | $2.46 | 23d | 1 | 0.50mi |
| 7287 Ketch Pl Bradenton, FL | 3.0 | 2.5 | 1968 | $2,295 | $1.17 | 15d | 1 | 0.64mi |
| 339 River Enclave Ct Bradenton, FL | 3.0 | 2.0 | 2074 | $6,900 | $3.33 | 23d | 1 | 0.64mi |
| 7276 Ketch Pl Bradenton, FL | 3.0 | 2.5 | 1986 | $2,050 | $1.03 | 11d | 1 | 0.65mi |
| 803 Fairwaycove Ln Bradenton, FL | 2.0 | 2.0 | 1165 | $1,835 | $1.58 | 3d | 2 | 0.68mi |
| 120 Watercolor WAY Bradenton, FL | 1.0–3.0 | 1.0–2.0 | 1121 | $2,286 | $2.04 | 3d | 41 | 0.74mi |
| 10016 Rembrandt Way #101 Bradenton, FL | 3.0 | 2.0 | 1962 | $4,250 | $2.17 | 23d | 1 | 0.75mi |
| 819 Fairwaycove Ln Bradenton, FL | 2.0 | 2.0 | 1165 | $1,950 | $1.67 | 15d | 2 | 0.76mi |
| 905 Fairwaycove Ln #205 Bradenton, FL | 2.0 | 2.0 | 1104 | $4,000 | $3.62 | 14d | 1 | 0.80mi |
| 9454 Discovery Ter Unit 101A Bradenton, FL | 3.0 | 2.0 | 1666 | $5,000 | $3.00 | 23d | 1 | 0.80mi |
| 8312 Grand Estuary Trl #104 Bradenton, FL | 3.0 | 2.0 | 1786 | $3,200 | $1.79 | 23d | 1 | 0.81mi |
| 416 Winding Brook Ln #102 Bradenton, FL | 3.0 | 2.0 | 2108 | $3,000 | $1.42 | 23d | 1 | 0.86mi |
| 7312 River Hammock Dr #103 Bradenton, FL | 3.0 | 2.0 | 2099 | $4,000 | $1.91 | 23d | 1 | 0.88mi |
| 8309 Grand Estuary Trl Bradenton, FL | 2.0 | 2.0 | 1185 | $3,375 | $2.85 | 15d | 2 | 0.88mi |
| 8403 Grand Estuary Trl Bradenton, FL | 2.0 | 2.0 | 1138 | $2,900 | $2.55 | 23d | 2 | 0.88mi |
| 8205 Grand Estuary Trl Bradenton, FL | 2.0 | 2.0 | 1121 | $2,125 | $1.90 | 15d | 2 | 0.88mi |
| 8105 Grand Estuary Trl Bradenton, FL | 2.0 | 2.0 | 1138 | $2,875 | $2.53 | 3d | 3 | 0.89mi |
| 424 Winding Brook Ln #104 Bradenton, FL | 3.0 | 2.0 | 1786 | $2,995 | $1.68 | 15d | 1 | 0.90mi |
| 7911 Grand Estuary Trl Bradenton, FL | 2.0 | 2.0 | 1156 | $3,500 | $3.03 | 23d | 2 | 0.90mi |
| 7607 Grand Estuary Trl Bradenton, FL | 2.0 | 2.0 | 1226 | $2,900 | $2.37 | 23d | 2 | 0.91mi |
| 7803 Grand Estuary Trl Bradenton, FL | 2.0 | 2.0 | 1371 | $2,650 | $1.93 | 23d | 2 | 0.91mi |
| 7705 Grand Estuary Trl Bradenton, FL | 2.0 | 2.0 | 1175 | $1,975 | $1.68 | 15d | 2 | 0.92mi |
| 7305 River Hammock Dr #206 Bradenton, FL | 2.0 | 2.0 | 1661 | $2,600 | $1.57 | 23d | 1 | 0.93mi |
| 9027 Stone Harbour Loop Bradenton, FL | 2.0 | 2.0 | 1328 | $2,400 | $1.81 | 23d | 1 | 0.94mi |
| 9411 Discovery Ter Unit 102B Bradenton, FL | 3.0 | 2.0 | 1254 | $2,900 | $2.31 | 23d | 1 | 0.97mi |
| 7124 Grand Estuary Trl #104 Bradenton, FL | 3.0 | 2.0 | 1786 | $2,500 | $1.40 | 23d | 1 | 0.99mi |
| 7225 River Hammock Dr #202 Bradenton, FL | 2.0 | 2.0 | 1561 | $1,749 | $1.12 | 3d | 1 | 0.99mi |
| 7015 Grand Estuary Trl #103 Bradenton, FL | 3.0 | 2.0 | 2108 | $2,500 | $1.19 | 15d | 1 | 1.00mi |
| 7112 Grand Estuary Trl #103 Bradenton, FL | 3.0 | 2.0 | 2108 | $3,200 | $1.52 | 23d | 1 | 1.00mi |
| 9712 Sea Turtle Ter #102 Bradenton, FL | 2.0 | 2.0 | 1254 | $2,500 | $1.99 | 23d | 1 | 1.00mi |
| 360 Cape Harbour Loop #105 Bradenton, FL | 3.0 | 2.5 | 1429 | $2,200 | $1.54 | 23d | 1 | 1.02mi |
| 9720 Sea Turtle Ter #201 Bradenton, FL | 3.0 | 2.0 | 1388 | $3,495 | $2.52 | 23d | 1 | 1.03mi |
| 7008 Grand Estuary Trl #104 Bradenton, FL | 3.0 | 2.0 | 1786 | $2,800 | $1.57 | 23d | 1 | 1.04mi |
| 208 Cape Harbour Loop #101 Bradenton, FL | 3.0 | 2.5 | 1200 | $2,000 | $1.67 | 23d | 1 | 1.05mi |
| 311 Cape Harbour Loop #103 Bradenton, FL | 2.0 | 2.5 | 1429 | $1,850 | $1.29 | 14d | 1 | 1.08mi |
| 6911 Grand Estuary Trl #102 Bradenton, FL | 3.0 | 2.0 | 2108 | $6,500 | $3.08 | 23d | 1 | 1.09mi |
| 7121 River Hammock Dr Bradenton, FL | 2.0 | 2.0 | 1176 | $2,248 | $1.91 | 23d | 2 | 1.10mi |
HOA detail
- Monthly dues
- $370 · $4,440/yr
- Likely covers
- water
Listing history 19 events
-
2026-04-10status Pending
-
2026-04-06$329,000 Active
-
2025-05-19historical
-
2025-02-20$325,000 Active
-
2018-06-12soldstatus $219,000
-
2008-04-19historical
-
2008-04-19historical
-
2007-11-26$215,000
-
2007-11-26$215,000
-
2006-03-01historical
-
2006-03-01historical
-
2006-01-07$350,000
-
2005-11-15$350,000
-
2005-11-04$350,000
-
2005-10-07$385,000
-
2005-08-07$375,000
-
2004-10-11soldstatus $255,385
-
2004-07-21$248,386
-
2004-04-06soldstatus $939,300
ⓘ Source: listings_history table (triggers on properties + properties_extension) + one-shot
backfill from property_details.listing_events for pre-trigger history.
Tax reassessment forecast FL · Resets to sale price
- Current annual tax
- $5,426 · $452/mo
- Projected year-2 tax
- $5,426 · $452/mo
- Expected delta
- $0/yr ($0/mo · 0.0%)
ⓘ Screening estimate from a state-policy table — verify with the county assessor before closing.
Climate risk First Street
- Flood 1/10 Low FEMA zone X (unshaded) · 0% chance over 30 yrs
- Wildfire 3/10 Moderate
- Heat 10/10 Extreme 7 d/yr ≥107°F today · 29 d/yr by 30 yrs out
- Wind 10/10 Extreme 99% chance of damaging wind over 30 yrs
- Air quality 3/10 Moderate 3 unhealthy d/yr today · 3 by 30 yrs out
Nearby sold comps map
Loading sold comps map…
Walkable amenities ~0.75 mi
Loading nearby amenities…
Taxation est. · year 1
- Rental income
- $37,554
- − Mortgage interest
- −$18,429
- − Property taxes
- −$5,426
- − Insurance
- −$1,645
- − Repairs & maintenance
- −$3,004
- − Management
- −$3,004
- − HOA
- −$4,440
- − Depreciation
- −$9,571
- Taxable loss
- −$7,966
- Est. tax savings @ 24.0%
- +$1,912
- After-tax cash flow
- $-636/yr
For passive investors: Depreciation is non-cash, so a rental often shows a tax loss while cash-flowing — sheltering income. Rental losses are passive: they offset passive income freely, and up to $25,000/yr can offset ordinary (W-2) income if you actively participate and your MAGI is under $100k (phasing out to $0 by $150k); unused losses carry forward. On sale, claimed depreciation is recaptured at up to 25%, and gains may owe capital-gains tax (a 1031 exchange can defer both). Figures are a year-1 estimate at your 24.0% rate — not tax advice; consult a CPA.
Schools (NCES district)
- District
- Manatee
- NCES district ID
- 1201230
- Math proficiency
- 54% ▼ -6.00%
- Reading proficiency
- 50% ▼ -2.00%
- Median HH income
- $49,607
- Composite
- 44.43/100
- National rank
- #2806
- State rank
- #26 of 73 in FL
Livability — Lakewood Ranch
No livability data for this city. (Only ~50 U.S. cities are tracked.)
Census & demographics
- County
- Manatee County · 416,364 people
- City population
- 52,177
- Metro
- North Port-Sarasota-Bradenton, FL
- Population (ZIP)
- 25,536
- Household income
- $125,486
- Rent vs Own
- Severe rent burden
- 383.0
Population outlook (Manatee County) Hauer SSP2
- Today (2025)
- 447,342 people
- By 2030
- 488,911 · +9.3%
- By 2040
- 567,934 · +27.0%
- By 2050
- 637,995 · +42.6%
- By 2075
- 781,970 · +74.8%
- By 2100
- 848,272 · +89.6%
Race, ethnicity, and origin ACS 2023
- Neighborhood character
- Predominantly White (81%)
- Race & ethnicity
- White 81% Hispanic / Latino 10% Two or more races 8% Black 3% Asian 2%
- Hispanic origin (detail)
- Mexican 1% Puerto Rican 2% Cuban 1%
- Common ancestry
- Romanian 5% Lithuanian 3% Slovak 2%
- Foreign-born
- 9% · Canada, Vietnam, China
- Languages at home
- 89% English-only · Spanish 6% Other Indo-European 2% Vietnamese 2%
Political lean MEDSL · Manatee
- 2024 margin
- Strong R (+23.5) · D 37.9% · R 61.4%
- 2008→2024 swing
- -16.5pp toward R · 2008: -7.0pp · 2024: -23.5pp
- All cycles
- 2024: R+23.5 2020: R+16.1 2016: R+17.1 2012: R+12.5 2008: R+7.0
Not yet ingested
- Civics
- —
Market trends
- HPI YoY
- ▼ -1.82%
- Current HPI
- 276.7636
- Rent YoY
- ▼ -3.44%
- Metro
- North Port-Sarasota-Bradenton, FL
- State GDP YoY
- ▲ 3.28%
- F500 in state
- 36
Industry mix (Fortune 500 HQ in FL)
| Industry | F500 HQs | Revenue |
|---|---|---|
| Industrial Technology | 2 | $29B |
|
||
| Insurance | 2 | $17B |
|
||
| Retail | 1 | $60B |
|
||
| Technology Distribution | 1 | $58B |
|
||
| Homebuilding | 1 | $35B |
|
||
| Technology Manufacturing | 1 | $35B |
|
||
Price history
-65.0% since first listed19 events — show timeline
- 2026-04-10 Pending — Stellar MLS as Distributed by MLS Grid
- 2026-04-06 Listed $329,000 Stellar MLS as Distributed by MLS Grid
- 2025-05-19 Listing Removed — Stellar MLS as Distributed by MLS Grid
- 2025-02-20 Listed $325,000 Stellar MLS as Distributed by MLS Grid
- 2018-06-12 Sold (Public Records) $219,000 Public Records
- 2008-04-19 Listing Removed — Stellar MLS as Distributed by MLS Grid
- 2008-04-19 Listing Removed — Stellar MLS as Distributed by MLS Grid
- 2007-11-26 Listed $215,000 Stellar MLS as Distributed by MLS Grid
- 2007-11-26 Listed $215,000 Stellar MLS as Distributed by MLS Grid
- 2006-03-01 Listing Removed — Stellar MLS as Distributed by MLS Grid
- 2006-03-01 Listing Removed — Stellar MLS as Distributed by MLS Grid
- 2006-01-07 Listed $350,000 Stellar MLS as Distributed by MLS Grid
- 2005-11-15 Listed $350,000 Stellar MLS as Distributed by MLS Grid
- 2005-11-04 Listed $350,000 Stellar MLS as Distributed by MLS Grid
- 2005-10-07 Listed $385,000 Stellar MLS as Distributed by MLS Grid
- 2005-08-07 Listed $375,000 Stellar MLS as Distributed by MLS Grid
- 2004-10-11 Sold (MLS) $255,385 Stellar MLS as Distributed by MLS Grid
- 2004-07-21 Listed $248,386 Stellar MLS as Distributed by MLS Grid
- 2004-04-06 Sold (Public Records) $939,300 Public Records
Property tax history
+5.7%/yrLatest (2024): $5,426 · +57.1% YoY. Source: county tax records.
Cash-flow waterfall
monthlySold comps — $/sqft
last 12 mo · ≤1 miLoading sold comps…