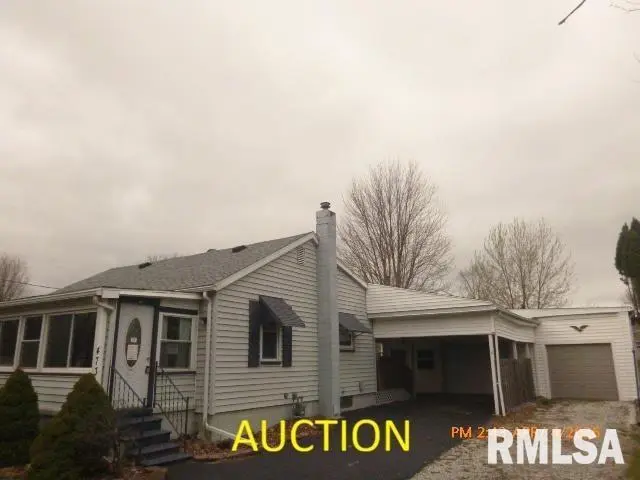
473 W Vine St · Canton, IL
Flood risk 1/10 · Minimal
- FEMA flood zone
- X (unshaded)
- Chance of flooding over 30 yrs
- 0.0%
- Est. flood insurance / yr
- $473 – $860
Fire risk 1/10 · Minimal
- Est. fire insurance / yr
- $804 – $1,492
Heat risk 3/10 · Minor
- Hot days now (above 105°F)
- 7 days/yr
- Hot days in 30 yrs
- 18 days/yr
Wind risk 2/10 · Minimal
- Chance of severe wind over 30 yrs
- 1.0%
Air-quality risk 2/10 · Minimal
- Unhealthy air days now
- 1 days/yr
- Unhealthy air days in 30 yrs
- 2 days/yr
Risk factors via First Street. Map © Google.
Why this score? — see what drove the C grade
The composite is a weighted blend of 9 inputs, each scored 0–100. Each bar is that input's sub-score; the figure is the points it added to the 100-point composite (weight × sub-score).
- Cash flow +21.3/30.0
- ARV discount +12.0/15.0
- DSCR +6.8/10.0
- 1% rule +5.2/10.0
- Livability +3.6/5.0
- Rent growth +2.5/5.0
- Condition / age +2.5/5.0
- Schools +1.8/10.0
- Appreciation +0.0/10.0
$57,600
🖨 Deal sheet 📄 Offer letter ✓ Due diligence
Listing remarks MLS
"AUCTION LISTING" This quaint 2 bedroom home (second bedroom no closet), offers plenty of extra storage space in the basement and oversized, heated garage with large workshop area. The front porch and covered carport offer additional space for hobbies and toys. Don't wait to make your appointment, this home will go fast! All contracts and offers are subject to final review and approval by seller. ** Contracts are not binding unless the entire agreement is ratified by all parties. ** All offers must be submitted by the buyer’s agent via HUBZU AUCTION www.hubzu.com. Once the offer has been accepted through HUBZU the assigned Asset manager from Altisource will upload through Res.net to generating contract addendums. The list price/sales price is subject to the seller’s approval.
Key facts
- 0.34 acre lot
- 2 garage spots
- Built 1931
Neighborhood map
What this means for you Summary
Snapshot
- This is a 2-bed/1.0-bath single-family listed at $58k.
Deal economics
- At list price, monthly cash flow is $84 ($1k/yr) — positive.
- The deal already cash-flows at list — no discount required.
- Meets the 1% rule at list price ($590 rent vs $58k).
- Recommended offer: $54k (6.0% below list) — sets the bar for market timing.
Location & tenants
- Location reads 72/100 on livability (#318 in IL) — a middle-class / working-renter tenant base. Strengths: cost of living A+, housing A+, health & safety A+; Watch: crime C-, schools F, amenities F.
- Canton Union SD 66 (town): math 19% / reading 23% proficiency, ranked #417 of 620 in IL (top 67%) — low school quality limits family demand, transient renter base, plan for 1-2y turnover.
- Market conditions: 102 active listings in the ZIP; 4 comparable units currently listed for rent nearby; rentals lingering (median 44d on market — plan ~5-8 weeks vacancy on turnover, expect pricing pressure); 50% of comp listings sitting > 30 days — soft ceiling on asking rent; 14 units permitted in Fulton County in 2024 (0 in 5+ unit buildings).
Forward outlook
- Local home prices are declining (-3.0%/yr); year-one equity from $398 of loan paydown is wiped out by about $2k of value loss. Plan a longer hold.
- Fulton County population projected at -20% by 2050 — secular population decline; favor cash flow + early exit over multi-decade hold.
Negotiation context
- It's been on market 73 days — a 6% lower offer ($54k) is reasonable based on typical stale-listing flexibility.
- 2 sale attempts since 16y ago; this cycle's ask has dropped $19k (25%) from the opening price — seller is motivated, your offer sets the floor, not the list.
- Current owner paid $49k; 18% above their basis — modest negotiation headroom, anchor on the comps not their cost.
Risks & watch-outs
- Watch-outs: built in 1931 — expect roof / HVAC / electrical / plumbing capex.
Questions for the listing agent
- It's been on market 73 days. Have you received any prior offers? Is the seller open to a 6% concession, seller financing, or rate buy-down credit?
- Built in 1931 — when were the roof, HVAC, electrical panel, plumbing, and water heater last replaced?
- Why hasn't it sold? Are there any deal-killer items the seller is aware of (foundation, flood, title, zoning, code violations)?
- Is there a deadline driving the sale (1031 exchange, divorce, estate, relocation)? That informs how much negotiation room exists.
- Schools are F-rated, which usually means shorter tenancies and higher turnover. Who's the typical renter profile here, and what's been the actual vacancy rate?
- What's the average days-on-market for RENTAL listings here right now (not sales)? A rising rental-DOM trend means longer vacancies and softer asking-rent achievability than the comps imply.
- What's the recent tenant-quality profile in this submarket — average credit score on applications, eviction rate, late-payment / NSF rate, and stable-employment percentage? A property-management company in the area should have these aggregated.
- How much new for-sale + rental construction is in the pipeline within 1–3 miles? Heavy new supply typically softens prices + rents 12–24 months out; constrained supply supports both.
Investment metrics
- 1% rule
- 1.02% ✓
- Cap rate
- 8.05%
- Cash-on-cash
- 6.28%
- DSCR
- 1.28
- GRM
- 8.1
CMA / ARV
- ARV (median comp)
- $63,987
- List price
- $57,600
- Delta
- -9.98%
- Verdict
- FAIR
- Comps
- 20 within 1.0 mi
Show comp detail 12 sales within ~0.75 mi
| Address | Dist | Beds/Ba | Sqft | Sold | Price | $/sf | Match |
|---|---|---|---|---|---|---|---|
| 324 W Spruce St | 0.32mi | 2/1.0 | 968 (+13%) | 1mo | $40,000 | $41 | 63 |
| 148 Robinson Ct | 0.67mi | 2/1.0 | 880 (+2%) | 3mo | $42,000 | $48 | 63 |
| 622 W Walnut St | 0.72mi | 2/1.0 | 812 (-6%) | 0mo | $15,000 | $18 | 57 |
| 36 E Olive St | 0.59mi | 1/1.0 (-1) | 906 (+5%) | 2mo | $69,900 | $77 | 56 |
| 840 Ravine Ct | 0.46mi | 2/1.0 | 955 (+11%) | 5mo | $120,000 | $126 | 56 |
| 702 N Avenue C | 0.35mi | 3/1.0 (+1) | 982 (+14%) | 1mo | $83,000 | $85 | 54 |
| 44 W Myrtle St | 0.50mi | 2/1.0 | 808 (-6%) | 20mo | $10,500 | $13 | 51 |
| 980 W Old Locust St | 0.63mi | 2/1.0 | 940 (+9%) | 9mo | $7,000 | $7 | 47 |
| 356 W Locust St | 0.37mi | 1/1.0 (-1) | 971 (+13%) | 15mo | $50,000 | $51 | 44 |
| 910 Old West Locust St | 0.57mi | 2/1.0 | 744 (-14%) | 14mo | $53,000 | $71 | 39 |
| 105 E Birch St | 0.65mi | 2/1.0 | 968 (+13%) | 19mo | $93,000 | $96 | 33 |
| 788 W Pine St | 0.74mi | 2/1.0 | 966 (+12%) | 19mo | $57,000 | $59 | 29 |
Match score weights: distance 35% · size 25% · config 20% · recency 20%. Top-matched comps best support the ARV.
Projected returns pro-forma
-3.0% appreciation · 3.0% rent growth · sell at horizon
- IRR
- -6.6%
- Equity multiple
- 0.75×
- Total profit
- $-3,959
- Equity at exit
- $8,588
- IRR
- 3.0%
- Equity multiple
- 1.22×
- Total profit
- $3,470
- Equity at exit
- $4,980
Cash invested: $16,128 (down + closing). Projections, not guarantees.
Landlord ↔ Tenant lean methodology
- Overall (STATE)
- 43 Moderately Tenant-Leaning
- State Illinois
- 43 Moderately Tenant-Leaning · D+7
- County
- — inherits STATE
- City
- — inherits STATE
ZIP-level market 61520
- Active inventory
- 102
- Price-to-rent
- 8.1×
Monthly cashflow live
- Estimated rent
- $590 medium interval (Pro) →
- Mortgage (P&I)
- −$302
- Tax from tax record
- −$56 /mo · $670/yr
- Insurance
- −$24
- HOA
- −$0
- Vacancy / Maint / Mgmt
- −$124
- Net cashflow
- $84
Break-even live
UW: 25.0% down · 7.5% · 30yr · 1.5% tax · 5.0% vac · 8.0% maint · 8.0% mgmt
Financing live
Cash to close
- Down payment
- $14,400
- Closing costs
- $1,728
- Reserves months
- —
- Total cash needed
- —
Loan-product check · same deal, 3 products live
Conventional
25% down · 7.5% · 30yr
- Down + closing
- —
- Monthly P&I
- —
- Monthly cashflow
- —
- DSCR
- —
- Eligible?
- —
Personal DTI + credit; lowest rate.
DSCR
20% down · 8.5% · 30yr
- Down + closing
- —
- Monthly P&I
- —
- Monthly cashflow
- —
- DSCR
- —
- Eligible?
- —
No personal income docs; deal must DSCR.
Hard money
10% down · 12.0% · 12mo
- Down + closing
- —
- Monthly P&I
- —
- Monthly cashflow
- —
- DSCR
- —
- Eligible?
- —
Short-term bridge; refi at stabilization.
Rent comps 4 comps
| Address | Beds | Baths | Sqft | Rent | $/sqft | DOM | Units | Dist |
|---|---|---|---|---|---|---|---|---|
| 143 W Locust St Unit 6 Canton, IL | 1.0 | 1.0 | 780 | $650 | $0.83 | 43d | 1 | 0.49mi |
| 1100 W Locust St Lot 127 Canton, IL | 2.0 | 1.0 | 700 | $325 | $0.46 | 43d | 1 | 1.11mi |
| 437 N 8th Ave Canton, IL | 2.0 | 1.0 | 690 | $1,200 | $1.74 | 13d | 1 | 1.15mi |
| 1100 W Locust St Unit 32 Canton, IL | 3.0 | 2.0 | 952 | $698 | $0.73 | 13d | 1 | 1.17mi |
Listing history 20 events
-
2026-06-18days on market $57,600 Active 73 DOM
-
2026-06-17days on market $57,600 Active 72 DOM
-
2026-06-16days on market $57,600 Active 71 DOM
-
2026-06-15days on market $57,600 Active 70 DOM
-
2026-06-13days on market $57,600 Active 68 DOM
-
2026-06-12pricedays on market $57,600 Active 67 DOM
-
2026-06-09days on market $61,600 Active 64 DOM
-
2026-06-08days on market $61,600 Active 63 DOM
-
2026-06-07days on market $61,600 Active 62 DOM
-
2026-06-07days on market $61,600 Active 61 DOM
-
2026-06-04days on market $61,600 Active 58 DOM
-
2026-06-02days on market $61,600 Active 57 DOM
-
2026-06-01days on market $61,600 Active 56 DOM
-
2026-05-31days on market $61,600 Active 55 DOM
-
2026-05-31days on market $61,600 Active 54 DOM
-
2026-04-08price $61,600 811-char remark
Show marketing remark (811 chars)
"AUCTION LISTING" This quaint 2 bedroom home (second bedroom no closet), offers plenty of extra storage space in the basement and oversized, heated garage with large workshop area. The front porch and covered carport offer additional space for hobbies and toys. Don't wait to make your appointment, this home will go fast! All contracts and offers are subject to final review and approval by seller. ** Contracts are not binding unless the entire agreement is ratified by all parties. ** All offers must be submitted by the buyer’s agent via HUBZU AUCTION www.hubzu.com. Once the offer has been accepted through HUBZU the assigned Asset manager from Altisource will upload through Res.net to generating contract addendums. The list price/sales price is subject to the seller’s approval.
-
2026-04-04$77,000 Active 811-char remark
Show marketing remark (811 chars)
"AUCTION LISTING" This quaint 2 bedroom home (second bedroom no closet), offers plenty of extra storage space in the basement and oversized, heated garage with large workshop area. The front porch and covered carport offer additional space for hobbies and toys. Don't wait to make your appointment, this home will go fast! All contracts and offers are subject to final review and approval by seller. ** Contracts are not binding unless the entire agreement is ratified by all parties. ** All offers must be submitted by the buyer’s agent via HUBZU AUCTION www.hubzu.com. Once the offer has been accepted through HUBZU the assigned Asset manager from Altisource will upload through Res.net to generating contract addendums. The list price/sales price is subject to the seller’s approval.
-
2010-06-21soldstatus $49,000
-
2010-03-26soldstatus $49,000 210-char remark
Show marketing remark (210 chars)
2 BEDRM HOME WITH 34 X 33 HEATED GARAGE WITH ATTACHED 15X20 WORKSHOP. THERE IS ALSO AN ADDITIONAL STORAGE AREA. THE CHAIN LINKED FENCEDIN BACK YARD IS ALSO THE HOME OF FRUIT TREES, PERENIALS, AND A GARDEN SPOT.
-
2010-01-27$49,000 210-char remark
Show marketing remark (210 chars)
2 BEDRM HOME WITH 34 X 33 HEATED GARAGE WITH ATTACHED 15X20 WORKSHOP. THERE IS ALSO AN ADDITIONAL STORAGE AREA. THE CHAIN LINKED FENCEDIN BACK YARD IS ALSO THE HOME OF FRUIT TREES, PERENIALS, AND A GARDEN SPOT.
ⓘ Source: listings_history table (triggers on properties + properties_extension) + one-shot
backfill from property_details.listing_events for pre-trigger history.
Tax reassessment forecast IL · Partial reset (capped growth)
- Current annual tax
- $670 · $56/mo
- Projected year-2 tax
- $989 · $82/mo
- Expected delta
- +$319/yr (+$27/mo · 47.6%)
ⓘ Screening estimate from a state-policy table — verify with the county assessor before closing.
Climate risk First Street
- Flood 1/10 Low FEMA zone X (unshaded) · 0% chance over 30 yrs
- Wildfire 1/10 Low
- Heat 3/10 Moderate 7 d/yr ≥105°F today · 18 d/yr by 30 yrs out
- Wind 2/10 Low 100% chance of damaging wind over 30 yrs
- Air quality 2/10 Low 1 unhealthy d/yr today · 2 by 30 yrs out
Nearby sold comps map
Loading sold comps map…
Walkable amenities ~0.75 mi
Loading nearby amenities…
Taxation est. · year 1
- Rental income
- $7,082
- − Mortgage interest
- −$3,226
- − Property taxes
- −$670
- − Insurance
- −$288
- − Repairs & maintenance
- −$567
- − Management
- −$567
- − Depreciation
- −$1,676
- Taxable income
- $90
- Est. tax owed @ 24.0%
- −$21
- After-tax cash flow
- $991/yr
For passive investors: Depreciation is non-cash, so a rental often shows a tax loss while cash-flowing — sheltering income. Rental losses are passive: they offset passive income freely, and up to $25,000/yr can offset ordinary (W-2) income if you actively participate and your MAGI is under $100k (phasing out to $0 by $150k); unused losses carry forward. On sale, claimed depreciation is recaptured at up to 25%, and gains may owe capital-gains tax (a 1031 exchange can defer both). Figures are a year-1 estimate at your 24.0% rate — not tax advice; consult a CPA.
Schools (NCES district)
- District
- Canton Union SD 66
- NCES district ID
- 1708280
- Math proficiency
- 19% ▼ -10.00%
- Reading proficiency
- 23% ▼ -12.00%
- Median HH income
- $42,657
- Composite
- 18.03/100
- National rank
- #8980
- State rank
- #417 of 620 in IL
Livability — Canton
- Score
- 72/100
- State rank
- #318
- US rank
- #6313
Category grades
Schools grade is shown separately in the Schools card above.
Census & demographics
- Census place
- Canton, IL
- Population (ZIP)
- 16,098
Population outlook (Fulton County) Hauer SSP2
- Today (2025)
- 33,356 people
- By 2030
- 32,144 · -3.6%
- By 2040
- 29,518 · -11.5%
- By 2050
- 26,775 · -19.7%
- By 2075
- 19,972 · -40.1%
- By 2100
- 13,580 · -59.3%
Race, ethnicity, and origin ACS 2023
- Neighborhood character
- Predominantly White (88%)
- Race & ethnicity
- White 88% Black 5% Hispanic / Latino 4% Two or more races 4% Native American 1%
- Common ancestry
- Slovak 3% Lithuanian 1% Romanian 1%
- Foreign-born
- 2% · Canada
- Languages at home
- 96% English-only · Spanish 3%
Political lean MEDSL · Fulton
- 2024 margin
- Strong R (+23.8) · D 37.1% · R 60.9% · Other 2.0%
- 2008→2024 swing
- -45.2pp toward R · 2008: 21.3pp · 2024: -23.8pp
- All cycles
- 2024: R+23.8 2020: R+20.1 2016: R+15.1 2012: D+11.1 2008: D+21.3
Not yet ingested
- Civics
- —
Market trends
- HPI YoY
- ▼ -88.00%
- Current HPI
- 123.8086
- Rent YoY
- —
- Metro
- —
- State GDP YoY
- ▲ 1.59%
- F500 in state
- 60
Industry mix (Fortune 500 HQ in IL)
| Industry | F500 HQs | Revenue |
|---|---|---|
| Insurance | 4 | $201B |
|
||
| Consumer Goods | 4 | $87B |
|
||
| Industrial Machinery | 3 | $64B |
|
||
| Healthcare | 2 | $55B |
|
||
| Retail / Pharmacy | 1 | $148B |
|
||
| Agriculture / Food | 1 | $86B |
|
||
Price history
+25.7% since first listed5 events — show timeline
- 2026-04-08 Price Changed $61,600 RMLSA as Distributed by MLS Grid
- 2026-04-04 Listed $77,000 RMLSA as Distributed by MLS Grid
- 2010-06-21 Sold (Public Records) $49,000 Public Records
- 2010-03-26 Sold (MLS) $49,000 RMLSA as Distributed by MLS Grid
- 2010-01-27 Listed $49,000 RMLSA as Distributed by MLS Grid
Property tax history
+6.1%/yrLatest (2024): $670 · -4.9% YoY. Source: county tax records.
Cash-flow waterfall
monthlySold comps — $/sqft
last 12 mo · ≤1 miLoading sold comps…